Downloaded 87 times


![Regression models 32
GenStat® ANOVA
(Original data)
Analysis of variance
Variate: TXB2 𝜎2
2
Source of variation d.f. s.s. m.s. v.r. F pr.
Treatment 5 184596. 36919. 6.31 <.001
Residual 30 175439. 5848.
Total 35 360035.
𝜎1
2
𝜎2
2
𝜎1
2
A2WAY [TREATMENTS=Treatment] TXB2](https://image.slidesharecdn.com/ccmschoosingregressionmodelsv2-160811080457/85/Choosing-Regression-Models-32-320.jpg)
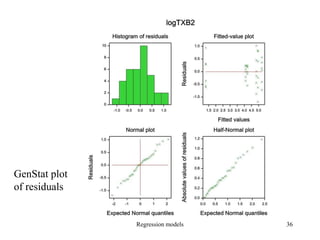
![Regression models 35
GenStat ANOVA
(log transformed)
A2WAY [TREATMENTS=Treatment] logTXB2
Analysis of variance
Variate: logTXB2
Source of variation d.f. s.s. m.s. v.r.
Treatment 5 62.6760 12.5352 40.09
Residual 30 9.3800 0.3127
Total 35 72.0559
Signal to noise ratio is
now much higher](https://image.slidesharecdn.com/ccmschoosingregressionmodelsv2-160811080457/85/Choosing-Regression-Models-35-320.jpg)

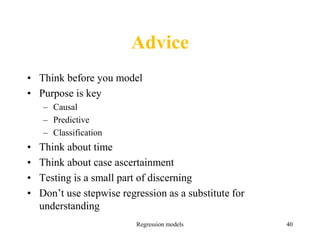

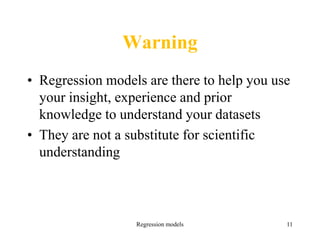
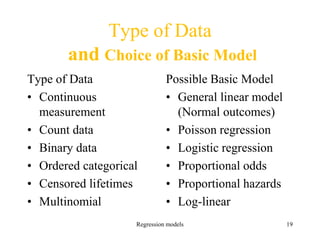
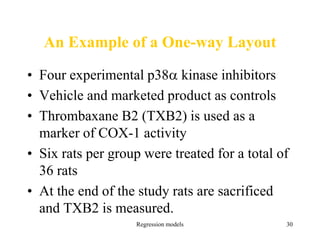
This document provides an introduction to choosing regression models. It discusses basic considerations like determining the purpose of the model, choosing appropriate predictors, and whether predictors or the outcome need transformation. Temporal sequence and prior knowledge are important factors in choosing predictors. The type of data, case ascertainment, and results of model fitting also influence predictor choice. Transforming predictors or the outcome can improve the model fit in some cases. The key is using statistical tools together with experience and understanding, not as a substitute for scientific insight.