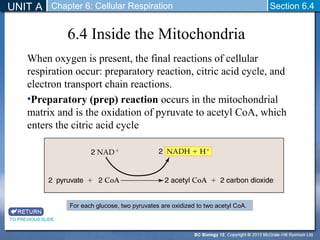
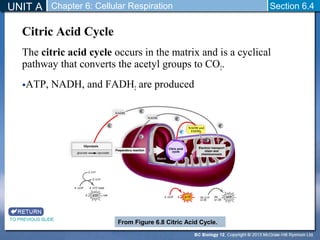
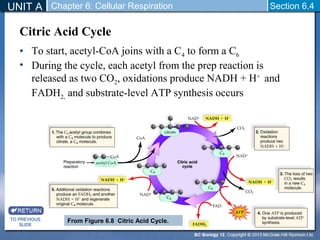
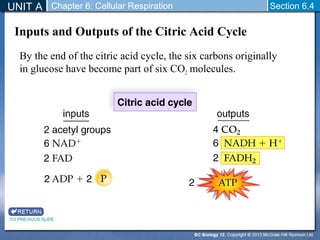
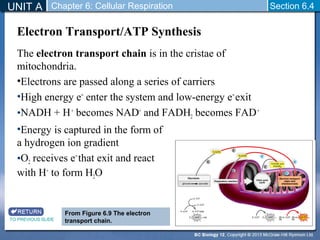
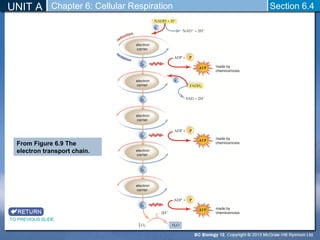
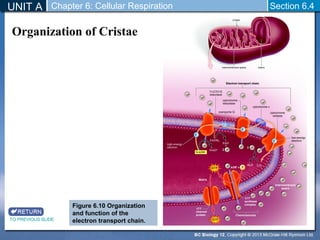
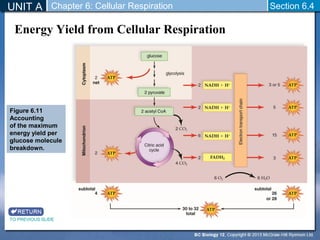
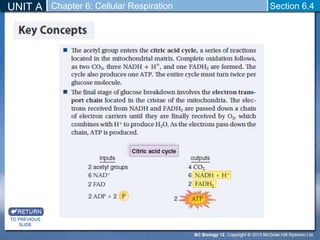
UNIT A: Cell Biology 
Chapter 2: The Molecules of Cells 
Chapter 3: Cell Structure and Function 
Chapter 4: DNA Structure and Gene 
Expression 
Chapter 5: Metabolism: Energy and 
Enzymes 
Chapter 6: Cellular Respiration: 
Section 6.4 
Chapter 7: Photosynthesis
UNIT A Chapter 6: Cellular Respiration 
Chapter 6: Cellular Respiration 
In this chapter you will learn about the many chemical reactions, 
known as cellular respiration, that break down molecules such as 
glucose to produce the ATP that fuels physical activities. 
Why are there differences 
between the aerobic and 
anaerobic pathways? 
How is the energy of a 
glucose molecule harvested by 
a cell? 
How are other organic 
nutrients, such as proteins and 
fats, used as energy? 
TO PREVIOUS SLIDE
UNIT A Chapter 6: Cellular Respiration Section 6.4 
6.4 Inside the Mitochondria 
When oxygen is present, the final reactions of cellular 
respiration occur: preparatory reaction, citric acid cycle, and 
electron transport chain reactions. 
•Preparatory (prep) reaction occurs in the mitochondrial 
matrix and is the oxidation of pyruvate to acetyl CoA, which 
enters the citric acid cycle 
For each glucose, two pyruvates are oxidized to two acetyl CoA. 
TO PREVIOUS SLIDE
UNIT A Chapter 6: Cellular Respiration 
Section 6.4 
Citric Acid Cycle 
The citric acid cycle occurs in the matrix and is a cyclical 
pathway that converts the acetyl groups to CO2. 
•ATP, NADH, and FADH2 are produced 
TO PREVIOUS SLIDE 
From Figure 6.8 Citric Acid Cycle.
UNIT A Section 6.4 
Citric Acid Cycle 
• To start, acetyl-CoA joins with a C4 to form a C6 
• During the cycle, each acetyl from the prep reaction is 
released as two CO2, oxidations produce NADH + H+ and 
FADH2, and substrate-level ATP synthesis occurs 
TO PREVIOUS 
SLIDE 
Chapter 6: Cellular Respiration 
From Figure 6.8 Citric Acid Cycle.
UNIT A Chapter 6: Cellular Respiration 
Section 6.4 
Inputs and Outputs of the Citric Acid Cycle 
By the end of the citric acid cycle, the six carbons originally 
in glucose have become part of six CO2 molecules. 
TO PREVIOUS SLIDE
UNIT A Chapter 6: Cellular Respiration 
Section 6.4 
Electron Transport/ATP Synthesis 
The electron transport chain is in the cristae of 
mitochondria. 
•Electrons are passed along a series of carriers 
•High energy e− enter the system and low-energy e−exit 
•NADH + H + becomes NAD+ and FADH2 becomes FAD + 
•Energy is captured in the form of 
a hydrogen ion gradient 
•O2 receives e− that exit and react 
with H+ to form H2O 
TO PREVIOUS SLIDE 
From Figure 6.9 The electron 
transport chain.
UNIT A Chapter 6: Cellular Respiration 
Section 6.4 
From Figure 6.9 The 
electron transport chain. 
TO PREVIOUS SLIDE
UNIT A Chapter 6: Cellular Respiration 
Section 6.4 
Organization of Cristae 
The components of the electron transport chain have a 
specific arrangement in the cristae of the mitochondria. 
•H+ ions are pumped from the matrix to the intermembrane 
space. This produces an unequal distribution of H+ ions, 
called an electrochemical gradient 
•The H+ move back from the intermembrane space to the 
matrix by passing through the ATP synthase complex. This 
causes the enzyme complex to produce ATP from ADP and 
phosphate. 
•ATP synthesis is said to occur by chemiosmosis 
TO PREVIOUS SLIDE
UNIT A Chapter 6: Cellular Respiration 
Section 6.4 
Organization of Cristae 
TO PREVIOUS SLIDE 
Figure 6.10 Organization 
and function of the 
electron transport chain.
UNIT A Chapter 6: Cellular Respiration 
Section 6.4 
Energy Yield from Cellular Respiration 
The maximum ATP yield from the complete oxidation of 
glucose can be calculated. 
•Glycolysis (cytoplasm): 2 ATP 
•Citric acid cycle (matrix): 2 ATP 
•Electron transport chain and chemiosmosis: 26 to 28 ATP 
Experimental observations show: 
•2-3 ATP per NADH in electron transport chain 
•1-2 ATP per FADH2 in electron transport chain 
In many cells, NADH produced in the cytoplasm by 
glycolysis requires ATP for transport into the mitochondria. 
TO PREVIOUS SLIDE
UNIT A Chapter 6: Cellular Respiration 
Section 6.4 
Energy Yield from Cellular Respiration 
Figure 6.11 
Accounting 
of the maximum 
energy yield per 
glucose molecule 
breakdown. 
TO PREVIOUS SLIDE
UNIT A Section 6.4 
Efficiency of Cellular Respiration 
TO PREVIOUS 
SLIDE 
Chapter 6: Cellular Respiration 
To determine how much of the energy in glucose becomes 
available to the cell: 
•Difference in energy between reactants (glucose and O2) and 
products (CO2 and H2O) = 686 kcal 
•Breaking of 30 phosphate bonds in the conversion of 30 ATP 
to 30 ADP + 30 phosphates = 219 kcal 
Therefore, 219/686, or 32%, of available energy is transferred 
from glucose to ATP. The remaining energy dissipates as heat.
UNIT A Section 6.4 
TO PREVIOUS 
SLIDE 
Chapter 6: Cellular Respiration 
Check Your Progress 
1. Explain the relationship between the metabolic 
pathways within the mitochondria with glycolysis. 
2. Calculate the number of NADH, FADH2, and ATP 
molecules produced by each stage of cellular 
respiration per glucose molecule. 
3. Discuss why there is variation in the number of ATP 
molecules produced per glucose.
UNIT A Section 6.4 
TO PREVIOUS 
SLIDE 
Chapter 6: Cellular Respiration
UNIT A Section 6.4 
TO PREVIOUS 
SLIDE 
Chapter 6: Cellular Respiration
UNIT A Section 6.4 
TO PREVIOUS 
SLIDE 
Chapter 6: Cellular Respiration

Biology 12 - Inside the Mitochondria - Section 6-4

  • 2.
    UNIT A: CellBiology Chapter 2: The Molecules of Cells Chapter 3: Cell Structure and Function Chapter 4: DNA Structure and Gene Expression Chapter 5: Metabolism: Energy and Enzymes Chapter 6: Cellular Respiration: Section 6.4 Chapter 7: Photosynthesis
  • 3.
    UNIT A Chapter6: Cellular Respiration Chapter 6: Cellular Respiration In this chapter you will learn about the many chemical reactions, known as cellular respiration, that break down molecules such as glucose to produce the ATP that fuels physical activities. Why are there differences between the aerobic and anaerobic pathways? How is the energy of a glucose molecule harvested by a cell? How are other organic nutrients, such as proteins and fats, used as energy? TO PREVIOUS SLIDE
  • 4.
    UNIT A Chapter6: Cellular Respiration Section 6.4 6.4 Inside the Mitochondria When oxygen is present, the final reactions of cellular respiration occur: preparatory reaction, citric acid cycle, and electron transport chain reactions. •Preparatory (prep) reaction occurs in the mitochondrial matrix and is the oxidation of pyruvate to acetyl CoA, which enters the citric acid cycle For each glucose, two pyruvates are oxidized to two acetyl CoA. TO PREVIOUS SLIDE
  • 5.
    UNIT A Chapter6: Cellular Respiration Section 6.4 Citric Acid Cycle The citric acid cycle occurs in the matrix and is a cyclical pathway that converts the acetyl groups to CO2. •ATP, NADH, and FADH2 are produced TO PREVIOUS SLIDE From Figure 6.8 Citric Acid Cycle.
  • 6.
    UNIT A Section6.4 Citric Acid Cycle • To start, acetyl-CoA joins with a C4 to form a C6 • During the cycle, each acetyl from the prep reaction is released as two CO2, oxidations produce NADH + H+ and FADH2, and substrate-level ATP synthesis occurs TO PREVIOUS SLIDE Chapter 6: Cellular Respiration From Figure 6.8 Citric Acid Cycle.
  • 7.
    UNIT A Chapter6: Cellular Respiration Section 6.4 Inputs and Outputs of the Citric Acid Cycle By the end of the citric acid cycle, the six carbons originally in glucose have become part of six CO2 molecules. TO PREVIOUS SLIDE
  • 8.
    UNIT A Chapter6: Cellular Respiration Section 6.4 Electron Transport/ATP Synthesis The electron transport chain is in the cristae of mitochondria. •Electrons are passed along a series of carriers •High energy e− enter the system and low-energy e−exit •NADH + H + becomes NAD+ and FADH2 becomes FAD + •Energy is captured in the form of a hydrogen ion gradient •O2 receives e− that exit and react with H+ to form H2O TO PREVIOUS SLIDE From Figure 6.9 The electron transport chain.
  • 9.
    UNIT A Chapter6: Cellular Respiration Section 6.4 From Figure 6.9 The electron transport chain. TO PREVIOUS SLIDE
  • 10.
    UNIT A Chapter6: Cellular Respiration Section 6.4 Organization of Cristae The components of the electron transport chain have a specific arrangement in the cristae of the mitochondria. •H+ ions are pumped from the matrix to the intermembrane space. This produces an unequal distribution of H+ ions, called an electrochemical gradient •The H+ move back from the intermembrane space to the matrix by passing through the ATP synthase complex. This causes the enzyme complex to produce ATP from ADP and phosphate. •ATP synthesis is said to occur by chemiosmosis TO PREVIOUS SLIDE
  • 11.
    UNIT A Chapter6: Cellular Respiration Section 6.4 Organization of Cristae TO PREVIOUS SLIDE Figure 6.10 Organization and function of the electron transport chain.
  • 12.
    UNIT A Chapter6: Cellular Respiration Section 6.4 Energy Yield from Cellular Respiration The maximum ATP yield from the complete oxidation of glucose can be calculated. •Glycolysis (cytoplasm): 2 ATP •Citric acid cycle (matrix): 2 ATP •Electron transport chain and chemiosmosis: 26 to 28 ATP Experimental observations show: •2-3 ATP per NADH in electron transport chain •1-2 ATP per FADH2 in electron transport chain In many cells, NADH produced in the cytoplasm by glycolysis requires ATP for transport into the mitochondria. TO PREVIOUS SLIDE
  • 13.
    UNIT A Chapter6: Cellular Respiration Section 6.4 Energy Yield from Cellular Respiration Figure 6.11 Accounting of the maximum energy yield per glucose molecule breakdown. TO PREVIOUS SLIDE
  • 14.
    UNIT A Section6.4 Efficiency of Cellular Respiration TO PREVIOUS SLIDE Chapter 6: Cellular Respiration To determine how much of the energy in glucose becomes available to the cell: •Difference in energy between reactants (glucose and O2) and products (CO2 and H2O) = 686 kcal •Breaking of 30 phosphate bonds in the conversion of 30 ATP to 30 ADP + 30 phosphates = 219 kcal Therefore, 219/686, or 32%, of available energy is transferred from glucose to ATP. The remaining energy dissipates as heat.
  • 15.
    UNIT A Section6.4 TO PREVIOUS SLIDE Chapter 6: Cellular Respiration Check Your Progress 1. Explain the relationship between the metabolic pathways within the mitochondria with glycolysis. 2. Calculate the number of NADH, FADH2, and ATP molecules produced by each stage of cellular respiration per glucose molecule. 3. Discuss why there is variation in the number of ATP molecules produced per glucose.
  • 16.
    UNIT A Section6.4 TO PREVIOUS SLIDE Chapter 6: Cellular Respiration
  • 17.
    UNIT A Section6.4 TO PREVIOUS SLIDE Chapter 6: Cellular Respiration
  • 18.
    UNIT A Section6.4 TO PREVIOUS SLIDE Chapter 6: Cellular Respiration

Editor's Notes

  • #2 Presentation title slide
  • #4 Chapter opener background information During a typical 90-minute soccer game, such as the one shown here involving Canada’s Emily Zurrer, the starting players run an average of about 10 km. However, unlike the endurance running experienced by marathoners, soccer players experience periods of intense activity (sprinting) followed by brief periods of rest. This start-and-stop nature of the game means that the muscles of the athlete are constantly switching between aerobic and anaerobic metabolism. During aerobic metabolism, the muscle cells use oxygen in order to completely break down glucose, producing more ATP, a high-energy molecule used for muscle contraction. The breakdown of glucose in the presence of oxygen to produce carbon dioxide and water is called cellular respiration. However, running short, fast sprints quickly depletes oxygen levels and drives the muscles into anaerobic metabolism. Without oxygen, glucose cannot be broken down completely. It is changed into lactate. Once oxygen is restored to the muscles, the body is able to return to aerobic metabolism and dispose of the lactate. In this chapter, we will discuss the metabolic pathways of cellular respiration that allow the energy within a glucose molecule, and other organic nutrients, to be converted into ATP.
  • #5 preparatory (prep) reaction: a reaction that produces the molecule that can enter the citric acid cycle
  • #6 citric acid cycle: cyclical metabolic pathway in mitochondria resulting in the production of two ATP; also called the Krebs cycle
  • #7 Caption text From Figure 6.8 Citric Acid Cycle. The net result of this cycle of reactions is the oxidation of an acetyl group to two molecules of CO2, along with a transfer of electrons to NAD+ and FAD and a gain of one ATP. The citric acid cycle turns twice per glucose molecule.
  • #9 electron transport chain: a series of carriers that pass electrons from one to the other, located in the cristae of mitochondria; the energy released is used to synthesize ATP
  • #10 Caption text Figure 6.9 The electron transport chain. NADH and FADH2 bring electrons to the electron transport chain. As the electrons move down the chain, energy is captured and used to form ATP. For every two electrons that enter by way of NADH, two to three ATP result. For every two electrons that enter by way of FADH2, one to two ATP result. Oxygen, the final acceptor of the electrons, becomes a part of water. electron transport chain: a series of carriers that pass electrons from one to the other, located in the cristae of mitochondria; the energy released is used to synthesize ATP
  • #11 chemiosmosis: the process by which mitochondria and chloroplasts use the energy of an electron transport chain to create a hydrogen ion gradient that drives ATP formation
  • #12 Caption text Figure 6.10 Organization and function of the electron transport chain. The electron transport chain is located in the cristae of the mitochondria. As electrons move from one protein complex to the other, hydrogen ions (H+) are pumped from the mitochondrial matrix into the intermembrane space. As hydrogen ions flow down a concentration gradient from the intermembrane space into the matrix, ATP is synthesized by the enzyme ATP synthase. ATP leaves the matrix by way of a channel protein.
  • #14 Caption text Figure 6.11 Accounting of the maximum energy yield per glucose molecule breakdown. Substrate-level ATP synthesis during glycolysis and the citric acid cycle accounts for four ATP. Chemiosmosis accounts for a maximum of 26 or 28 ATP, depending on the cell type. The maximum total of ATP is therefore 30 to 32 ATP.
  • #16 Answers 1. Glycolysis is anaerobic and the metabolic pathways within the mitochondria are aerobic. Glycolysis provides pyruvate, which is the reactant for the preparatory reaction and the citric acid cycle occurring in the mitochondria. In glycolysis ATP is produced by substrate-level ATP synthesis. In the mitochondria most ATP are produced by chemiosmosis. 2. Some ATP are generated directly by various early stages of cellular respiration, specifically 2 ATP from glycolysis and 2 ATP from the citric acid cycle. The remaining ATP are generated from the electron carriers NADH and FADH2 in the electron transport chain (ETC). As a general rule, 2 to 3 ATP are generated from each NADH and 1-2 ATP are generated by FADH2. This is because FADH2 enters the electron transport chain at a lower energy than NADH.   The number of molecules of NADH, FADH2, and ATP produced by each stage of cellular respiration are: Glycolysis: 2 ATP plus 2 NADH Preparatory Reaction: 2 NADH Citric Acid Cycle: 2 ATP, plus 6 NADH and 2 FADH2 Electron Transport Chain: 4-6 ATP from 2 NADH of glycolysis (2 NADH × 3 = 4-6) 6 ATP from the 2 NADH of prep reaction (2 NADH × 3 = 6 ATP) 18 ATP from the citric acid cycle (6 NADH × 3 = 18 ATP) 4 ATP from the citric acid cycle (2 FADH2 × 2 = 4 ATP) See chart in Chapter 6 Answer Key for details 3. In some cells the NADH formed outside the mitochondria during glycolysis cannot easily cross into the mitochondria. Instead NADH delivers its electrons to the electron transport chain using a process that costs one ATP per 2 electrons. Since 2 NADH are formed during glycolysis, the total ATP count is reduced from 6 to 4. Also in the electron transport chain reactions, the actual yield per NADH varies from 2 to 3 ATP and the yield from FADH2 varies from 1 to 2 ATP. The amounts in the final column of the table above are theoretical maximum yields.