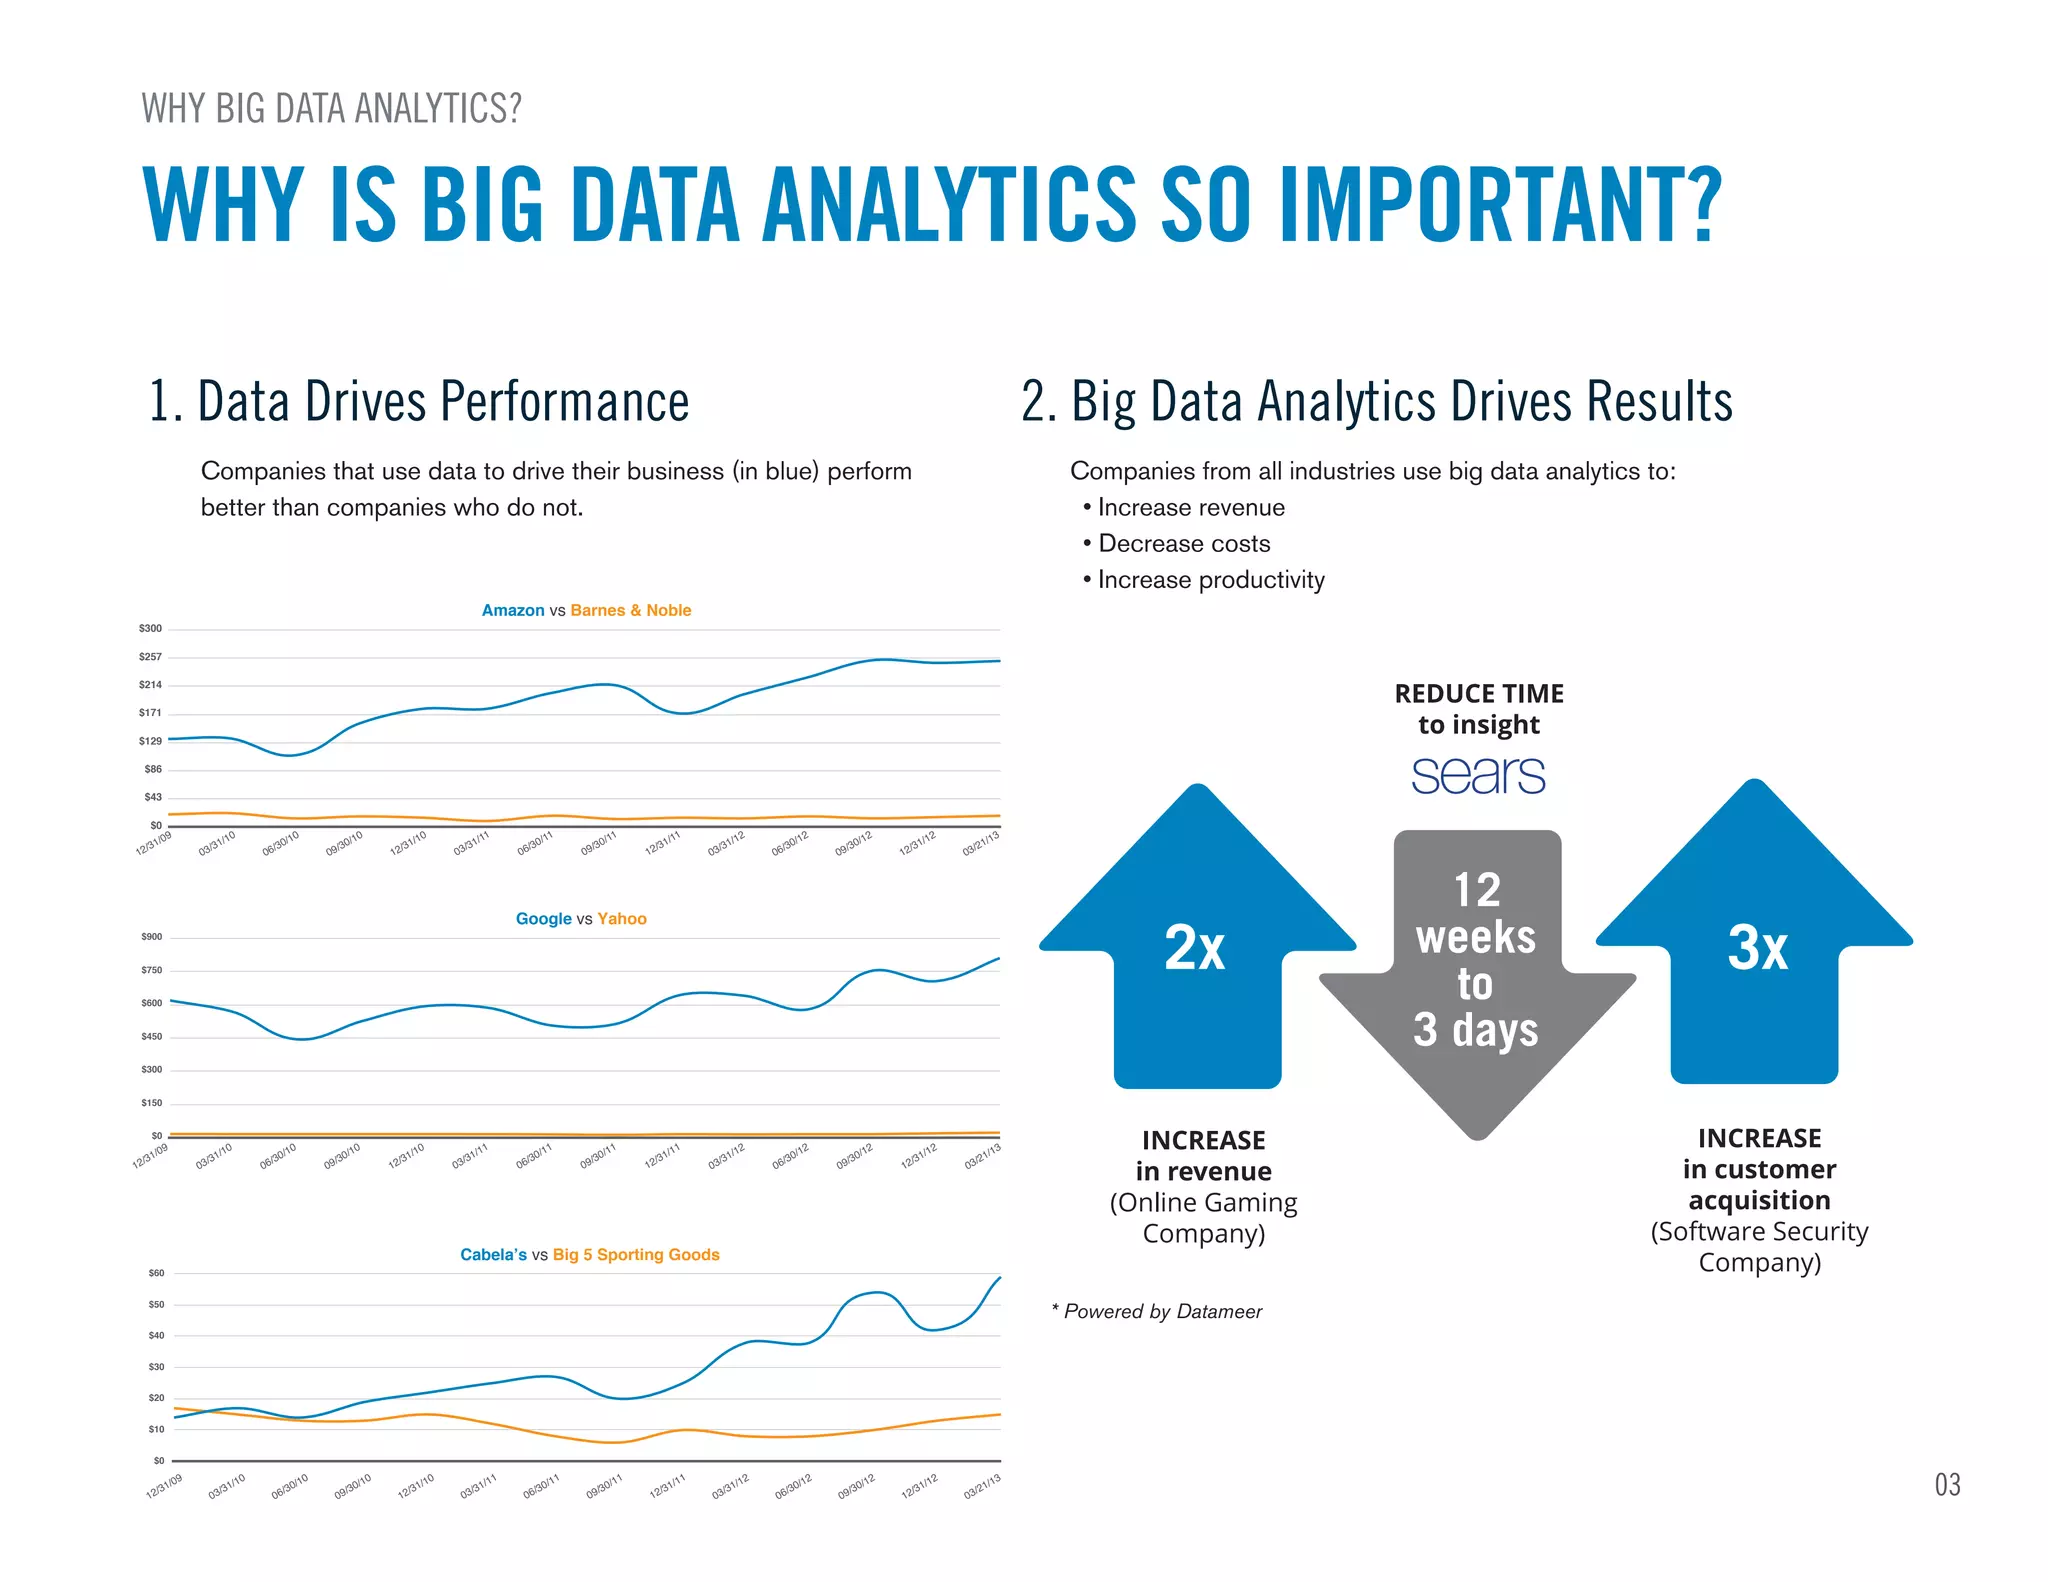
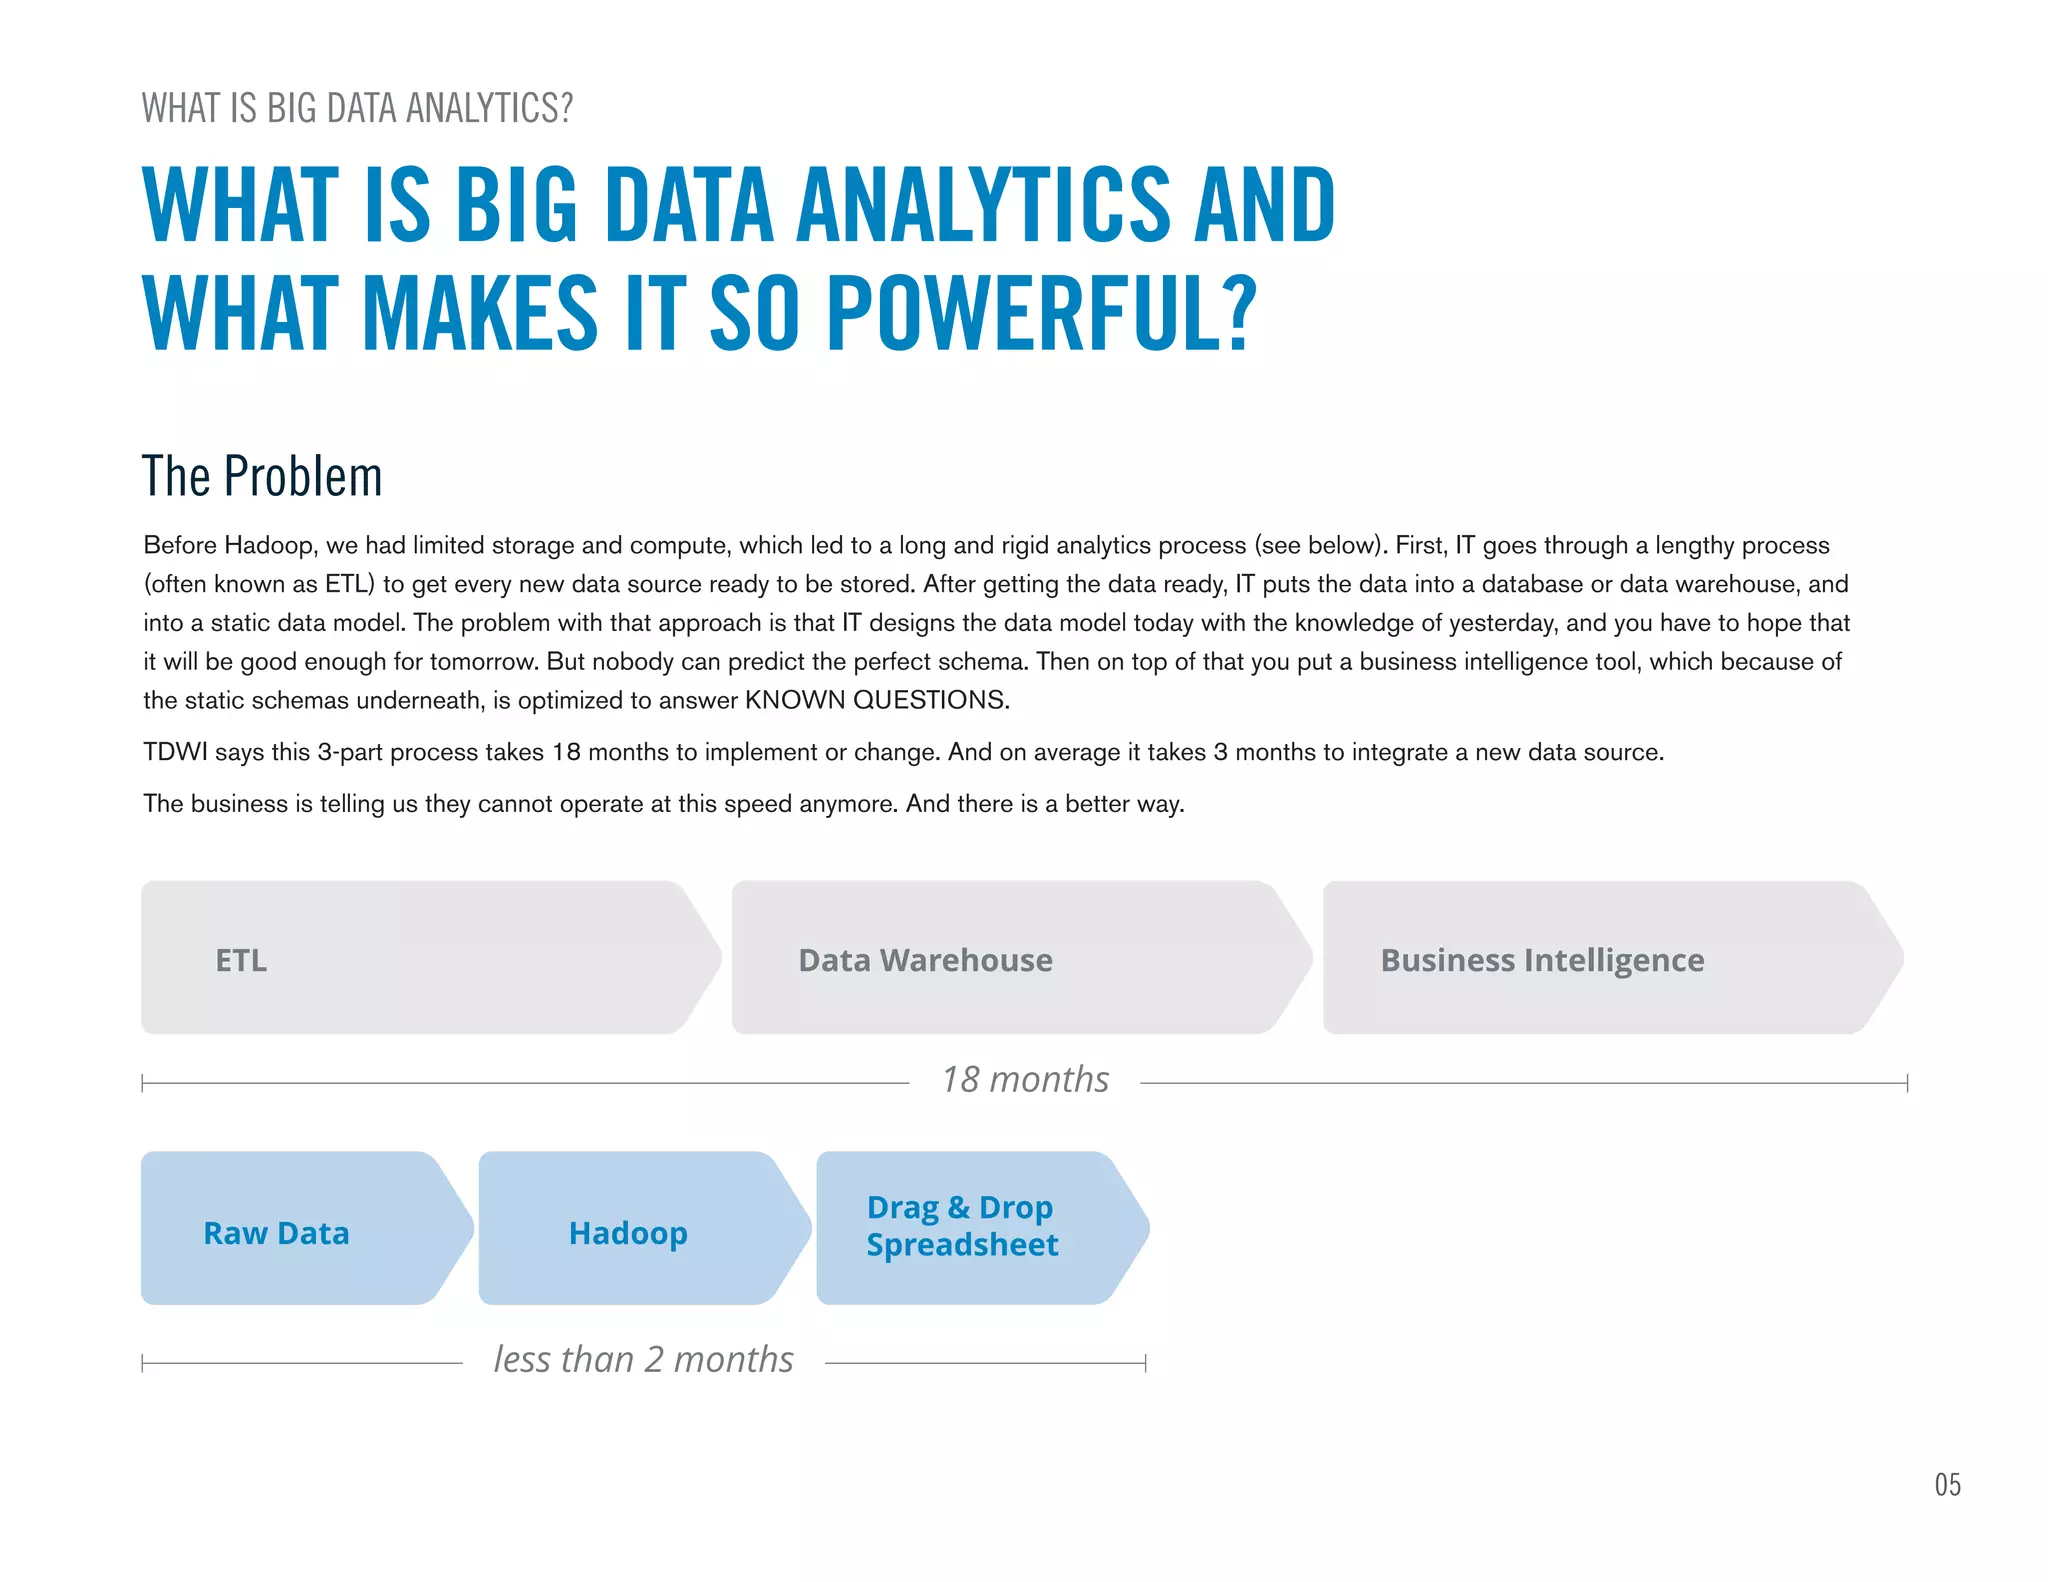
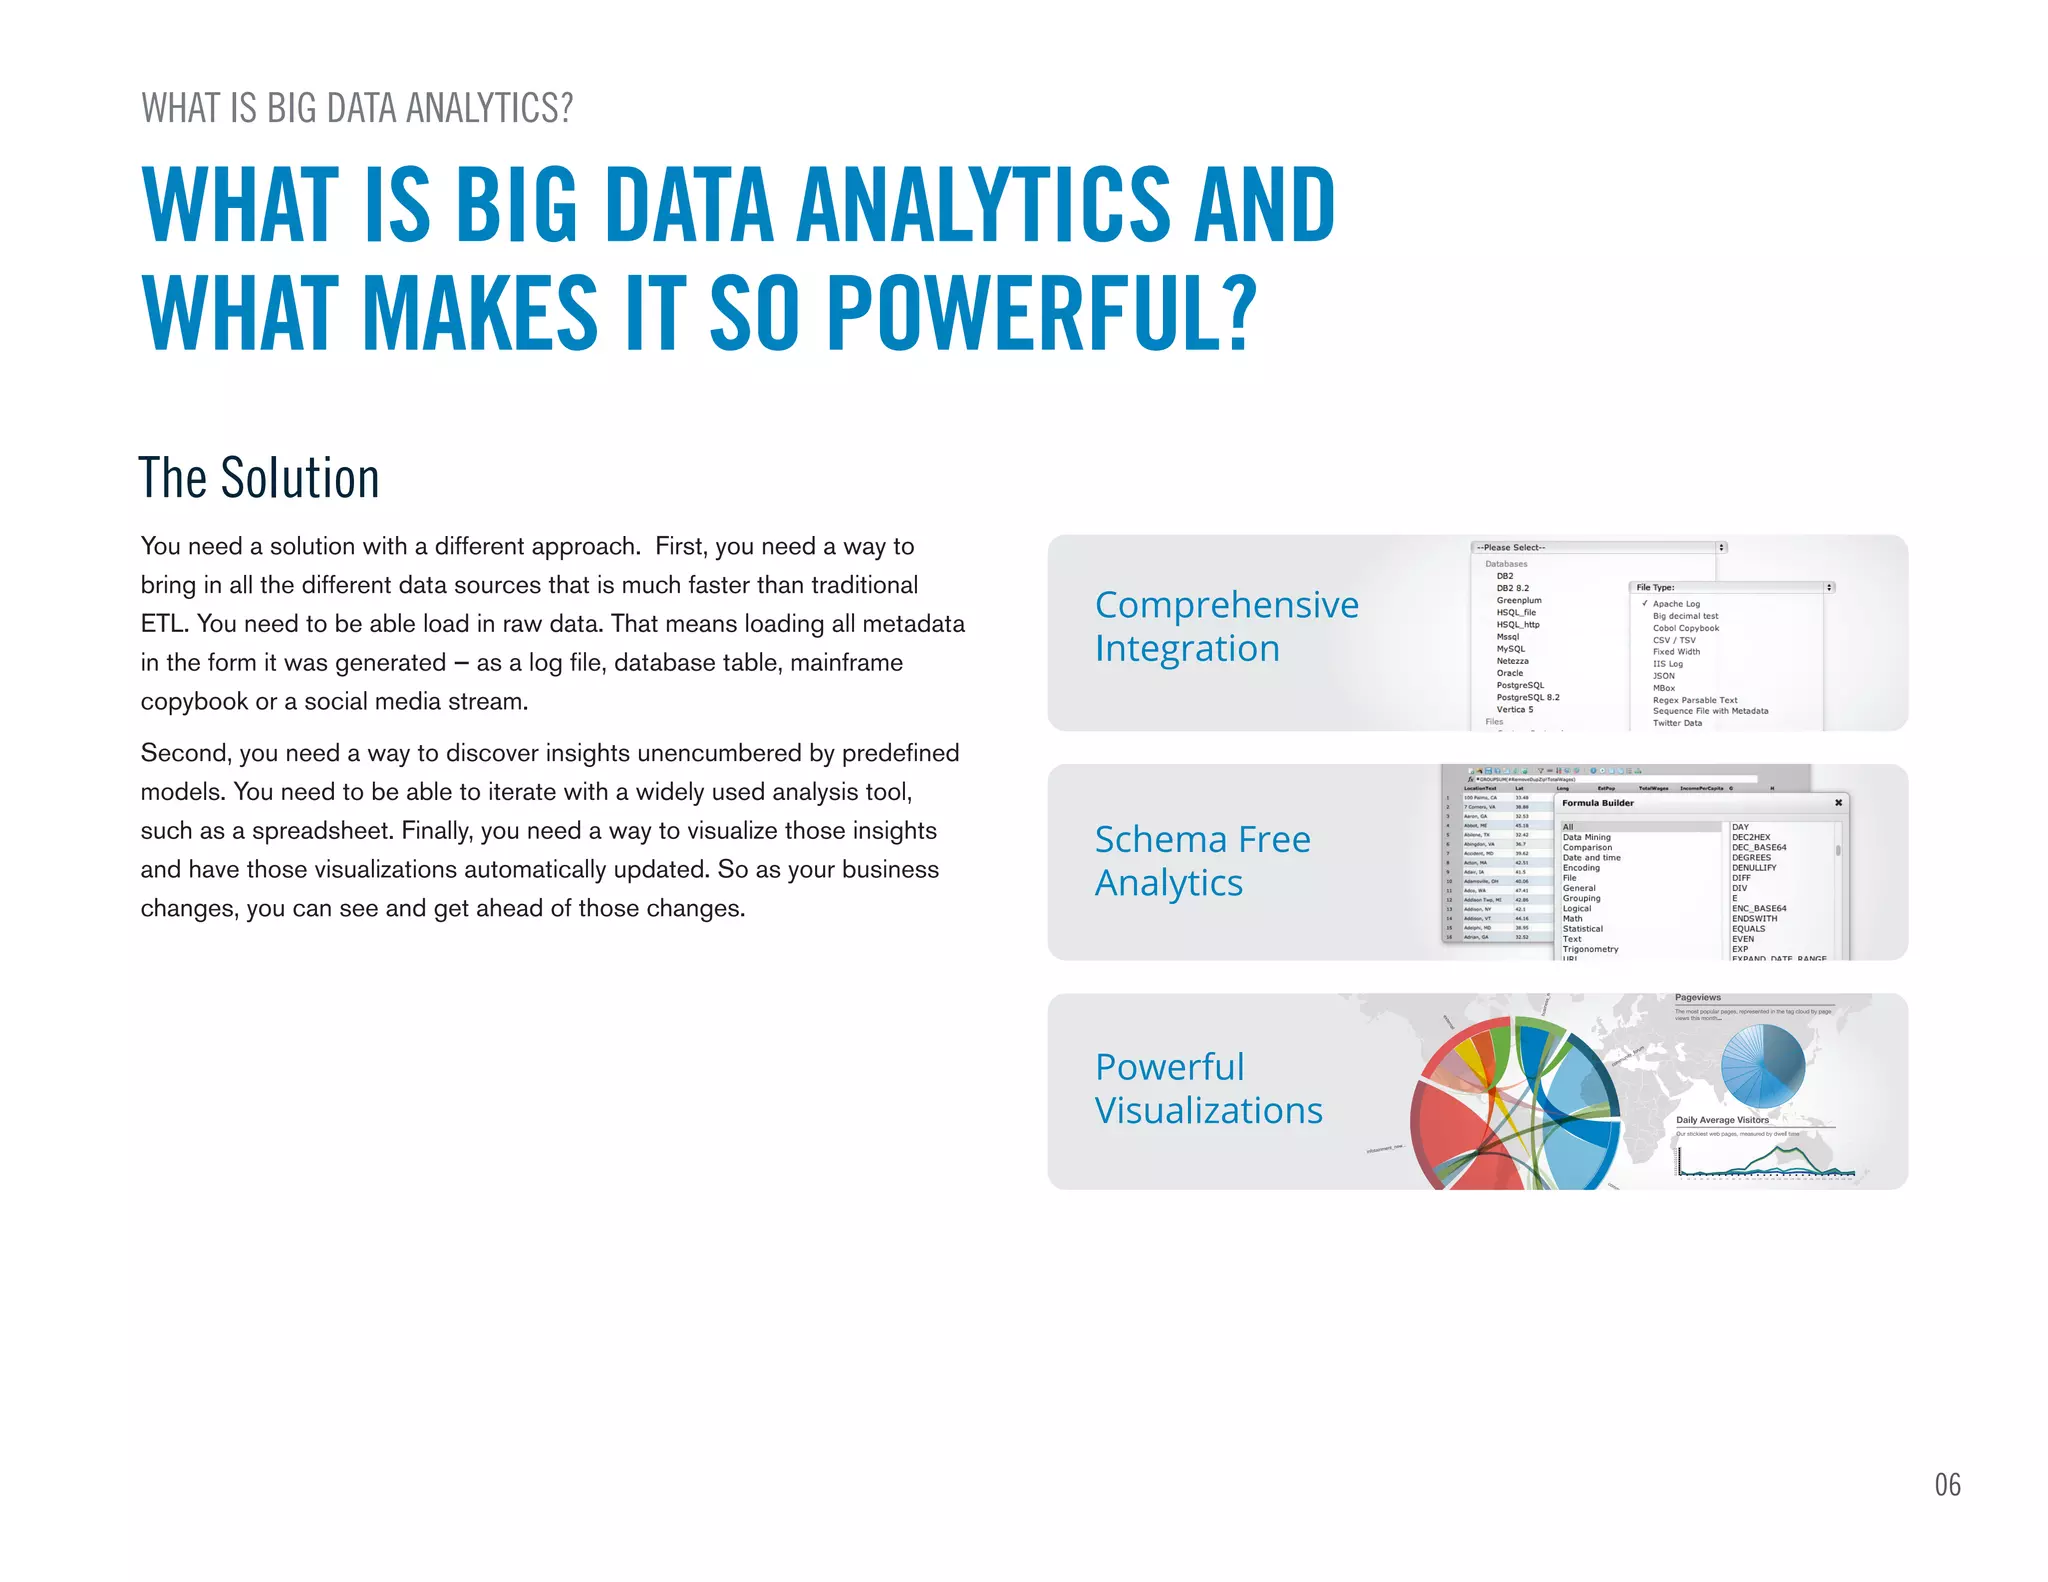
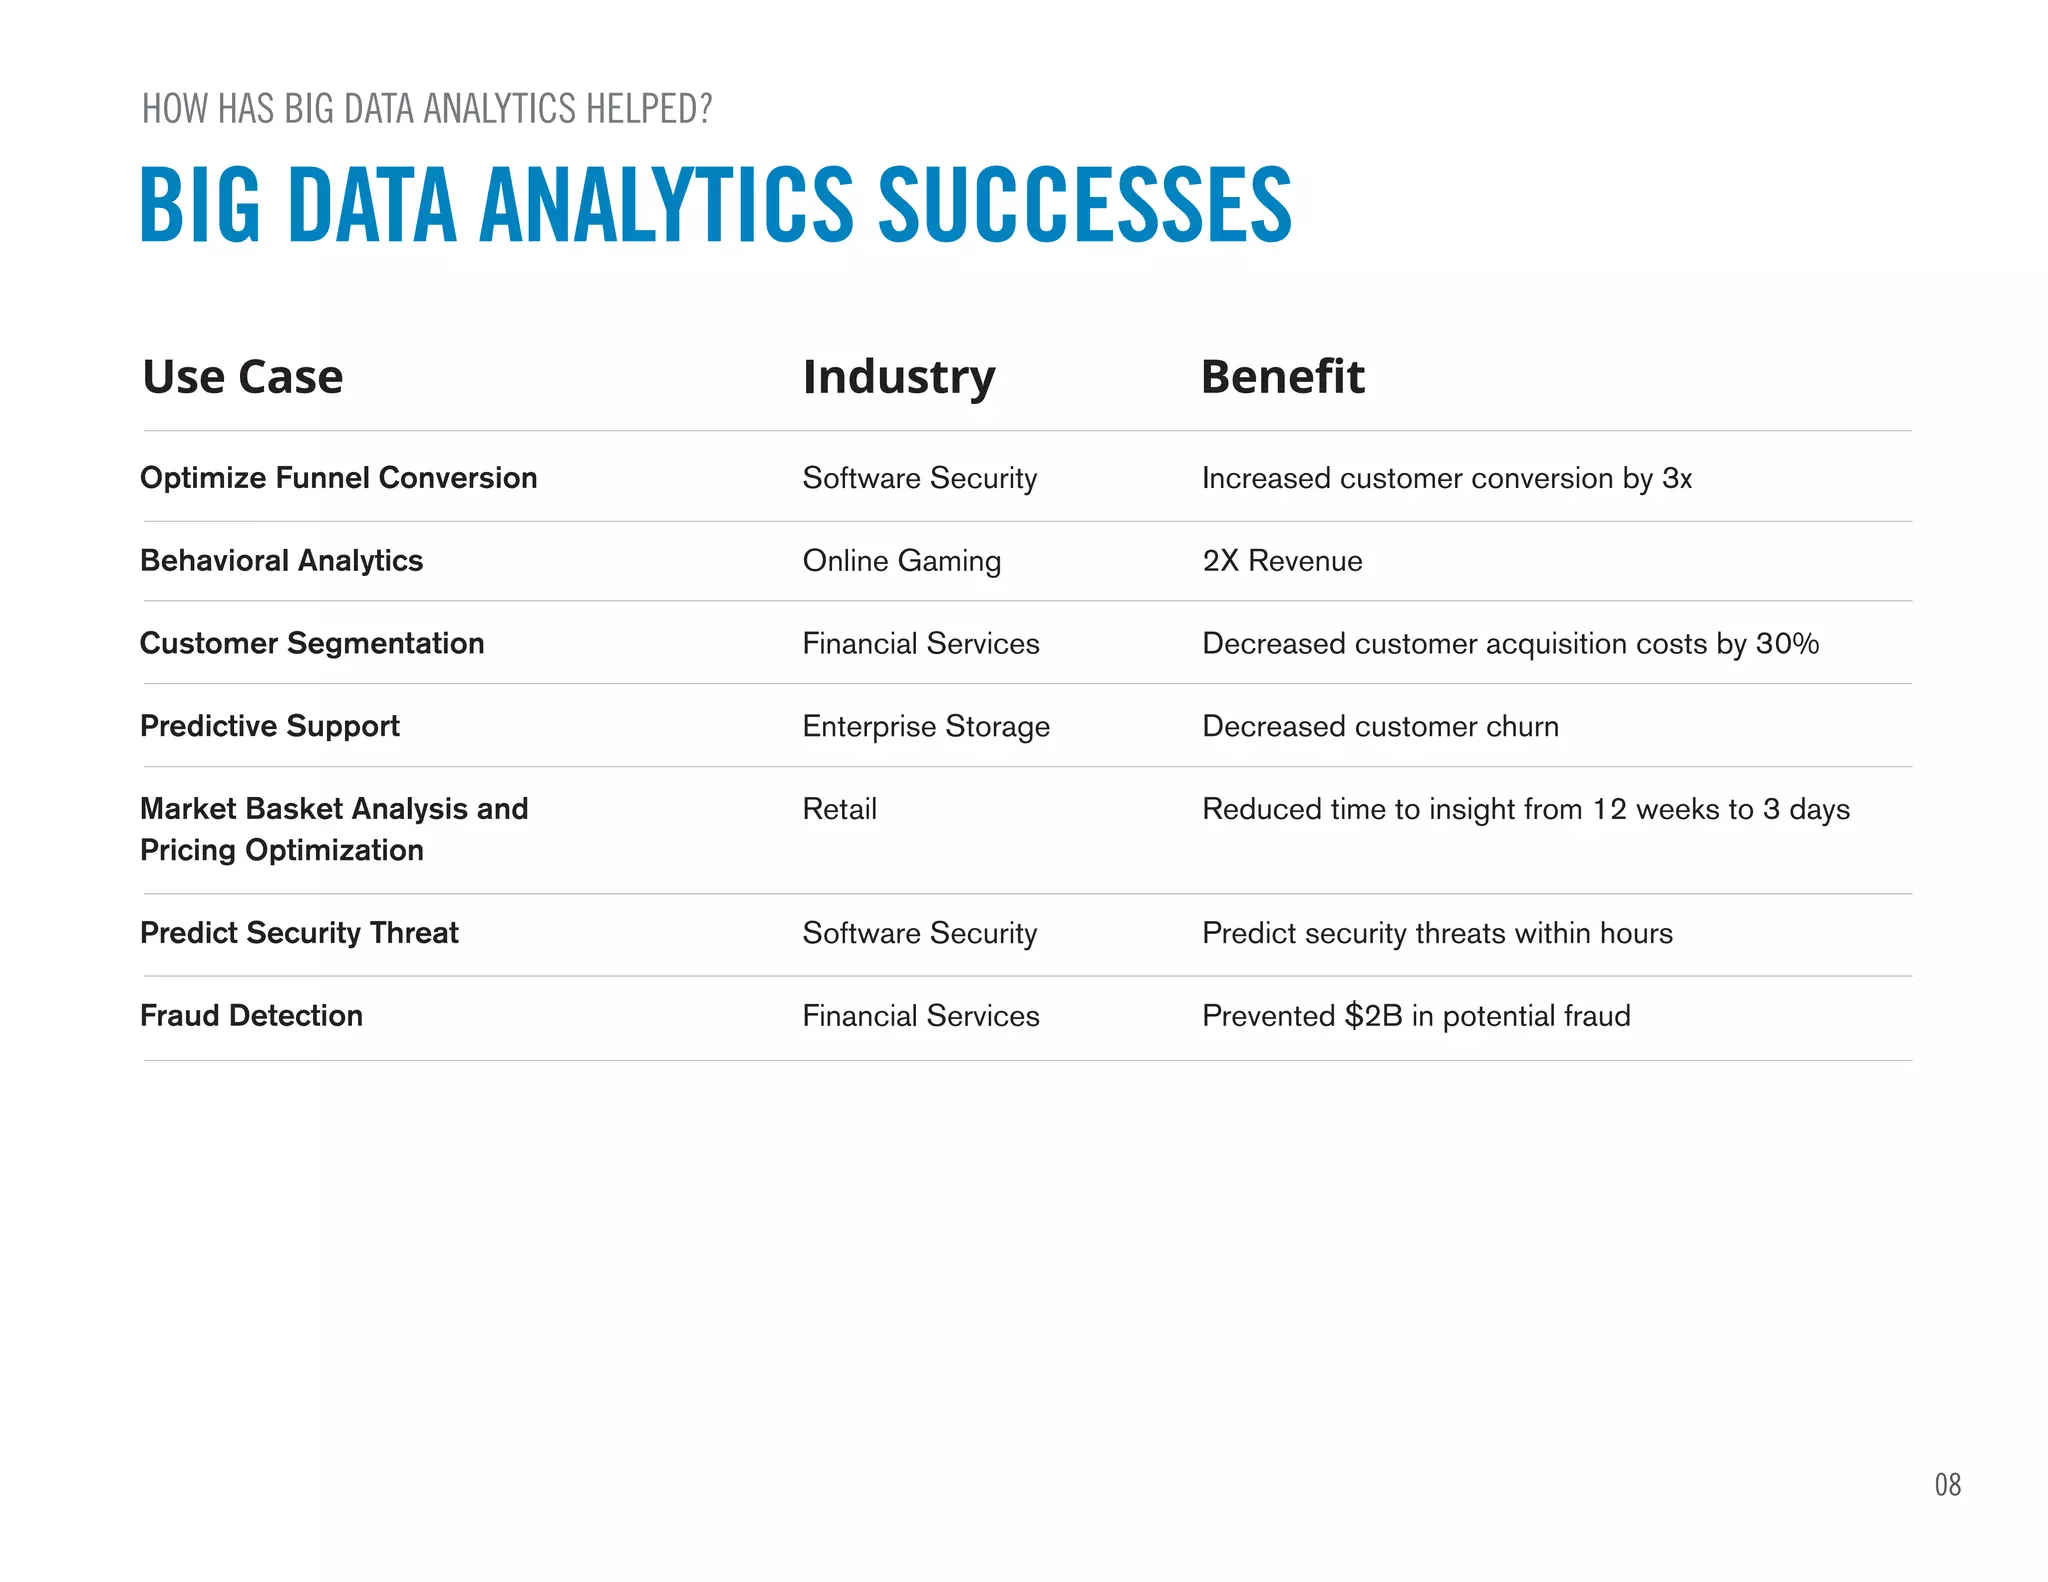
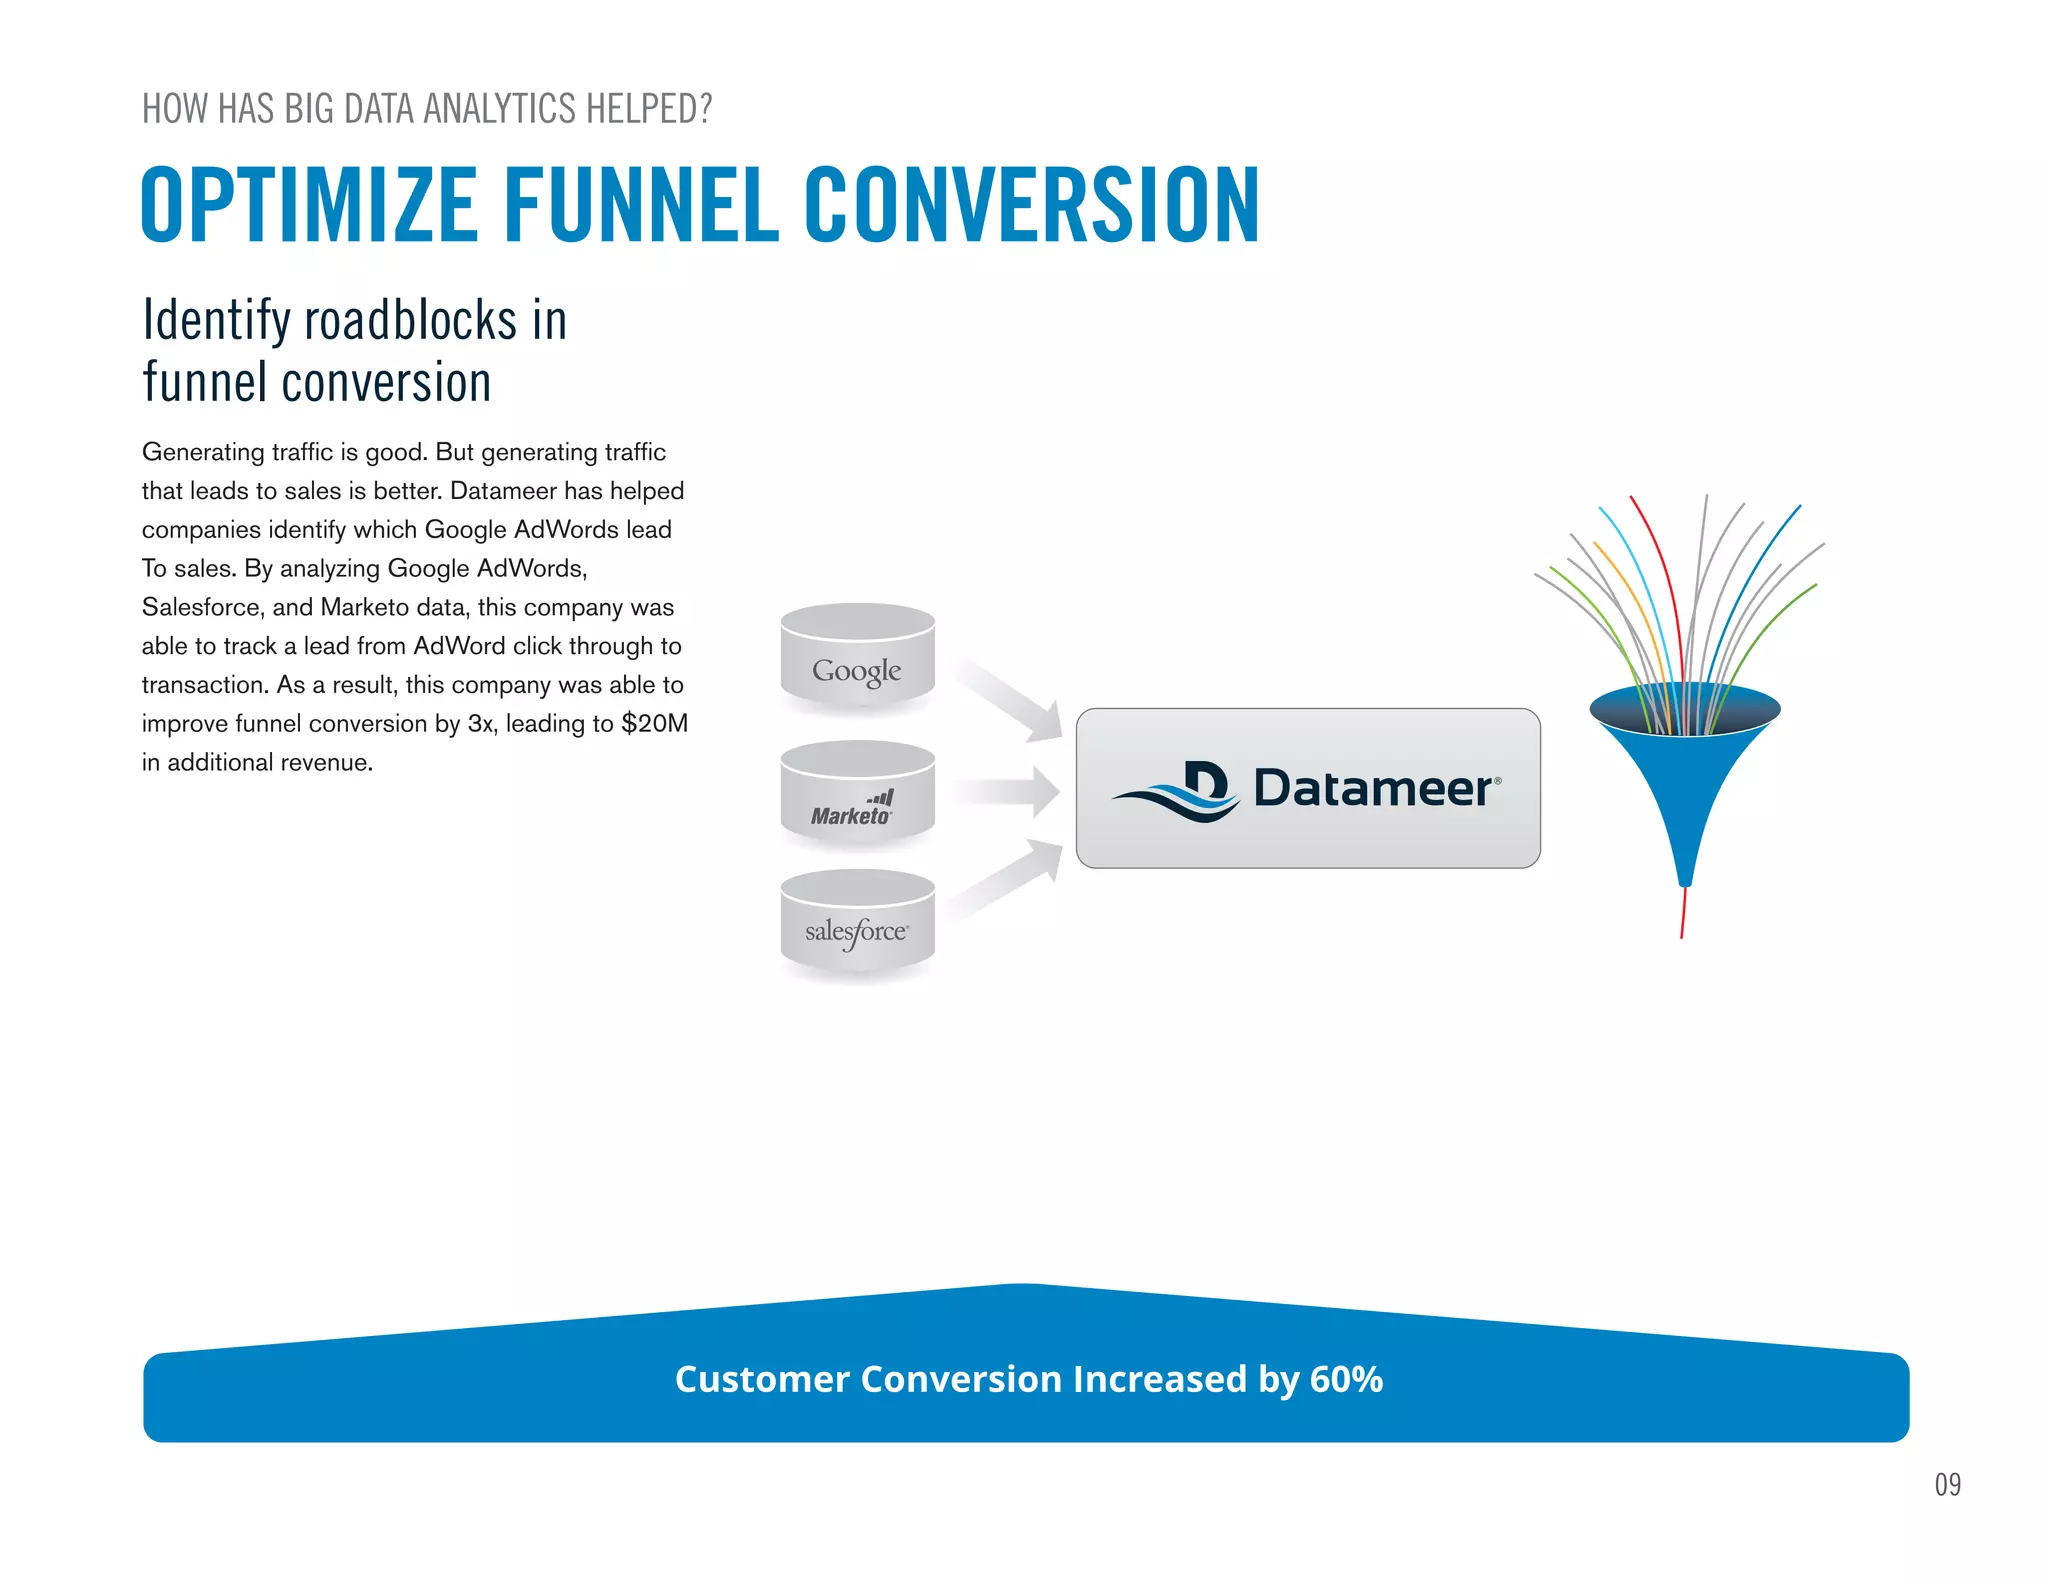
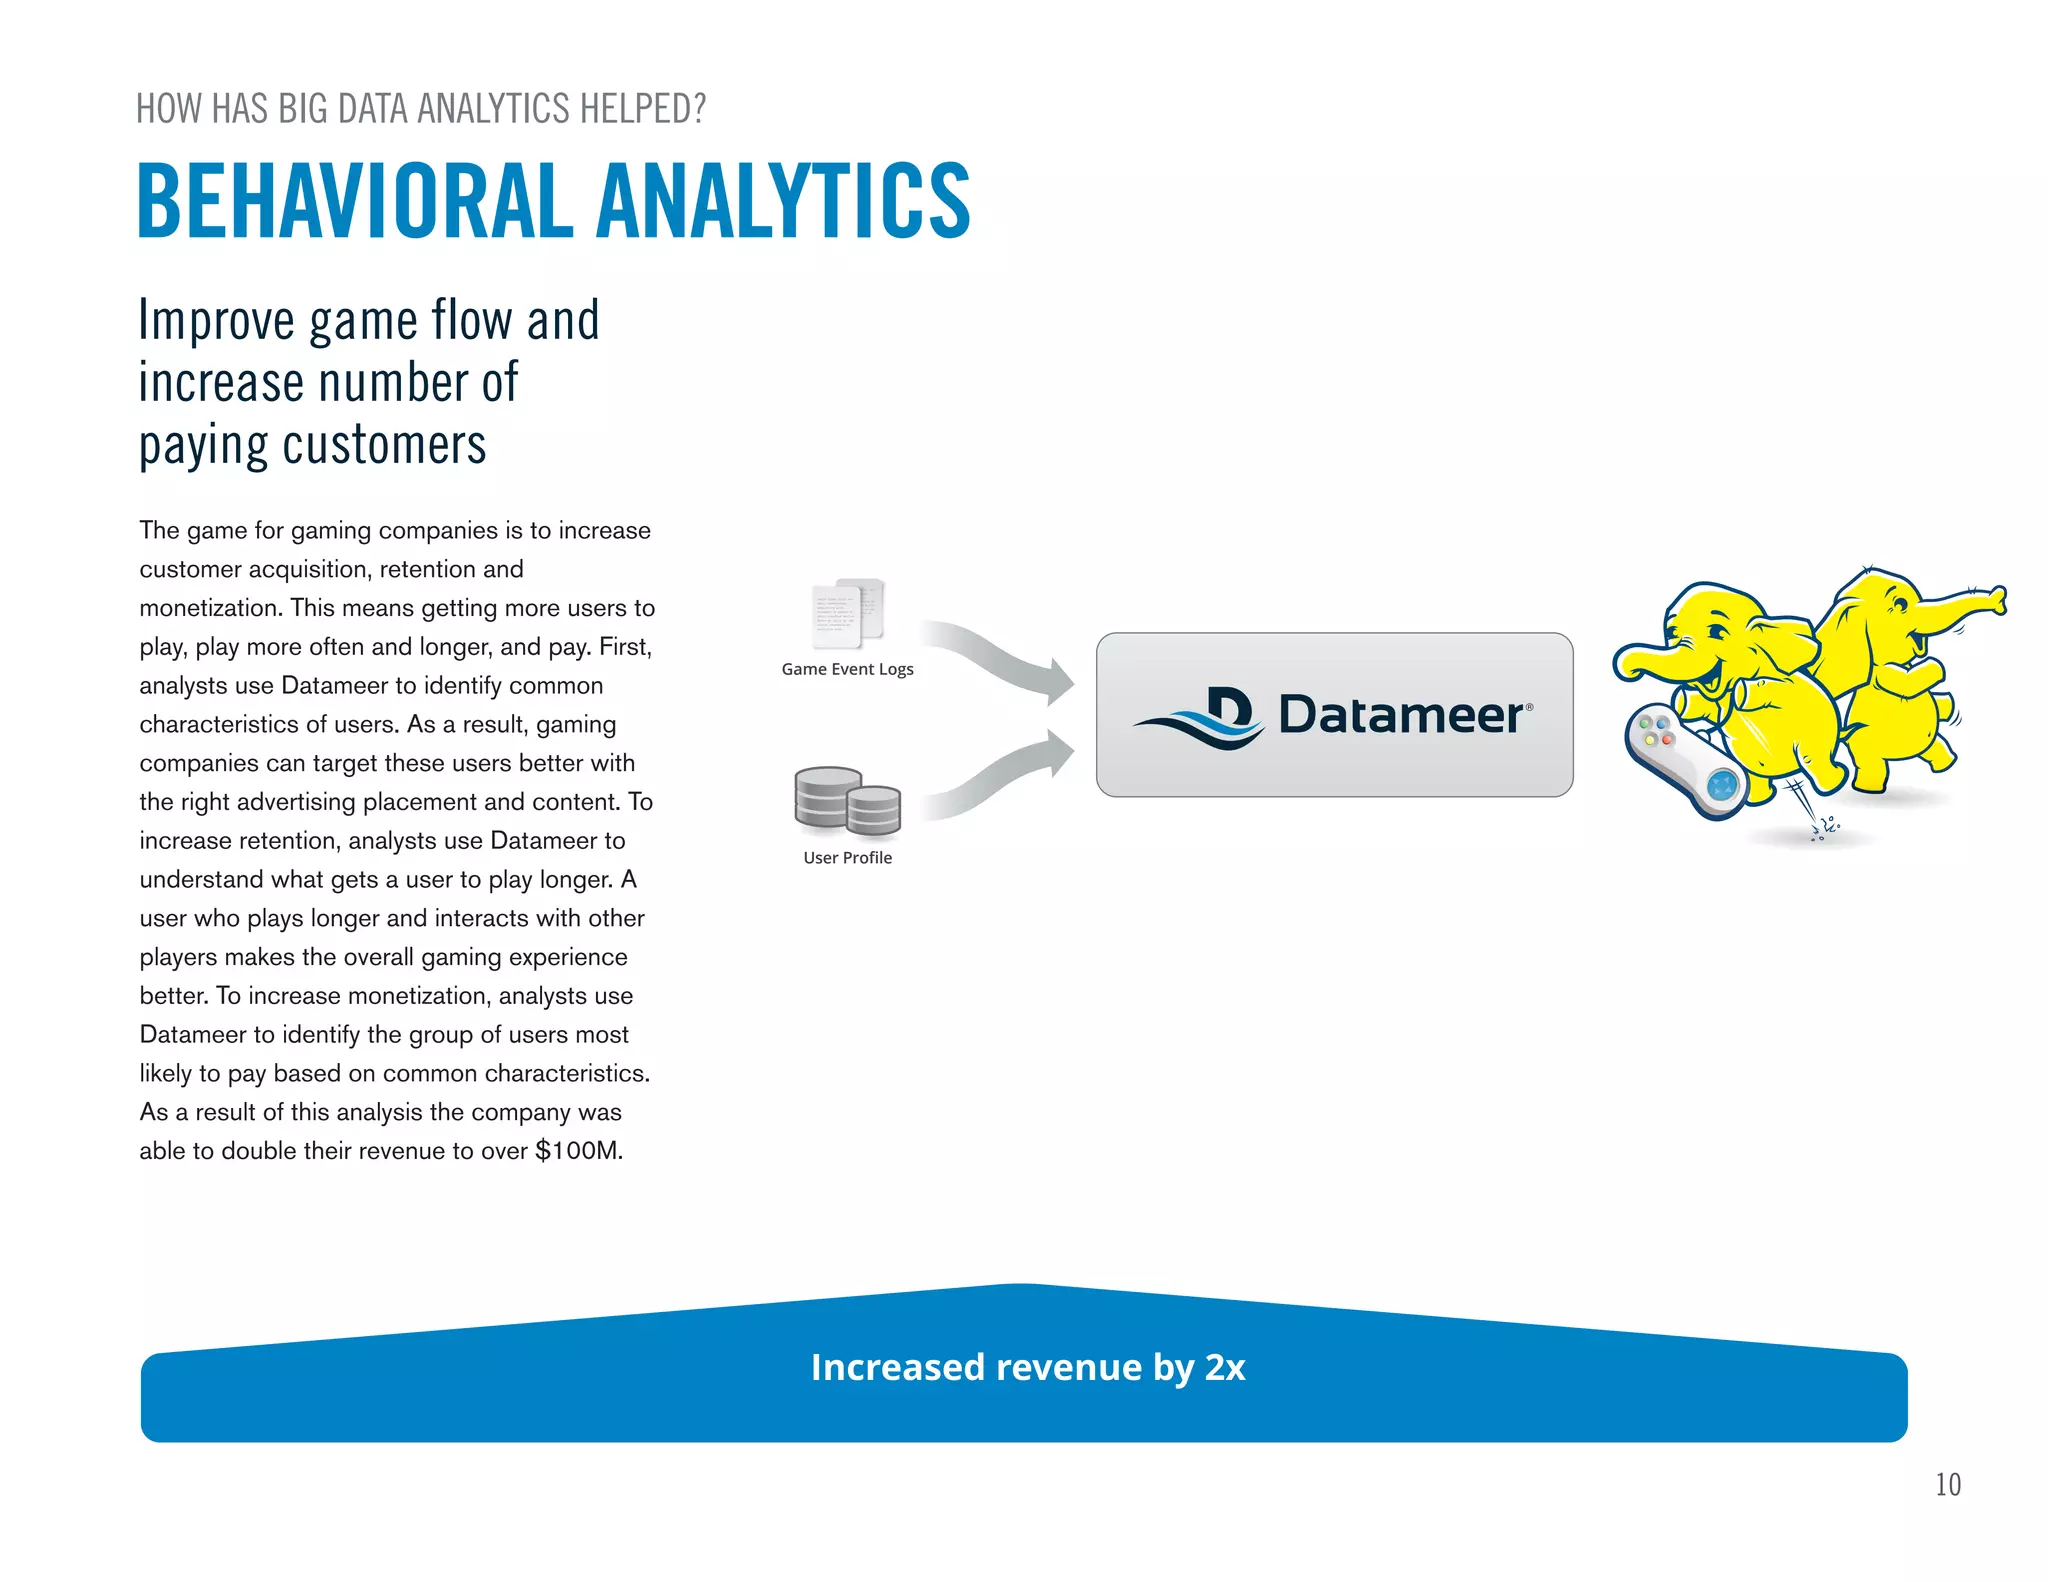
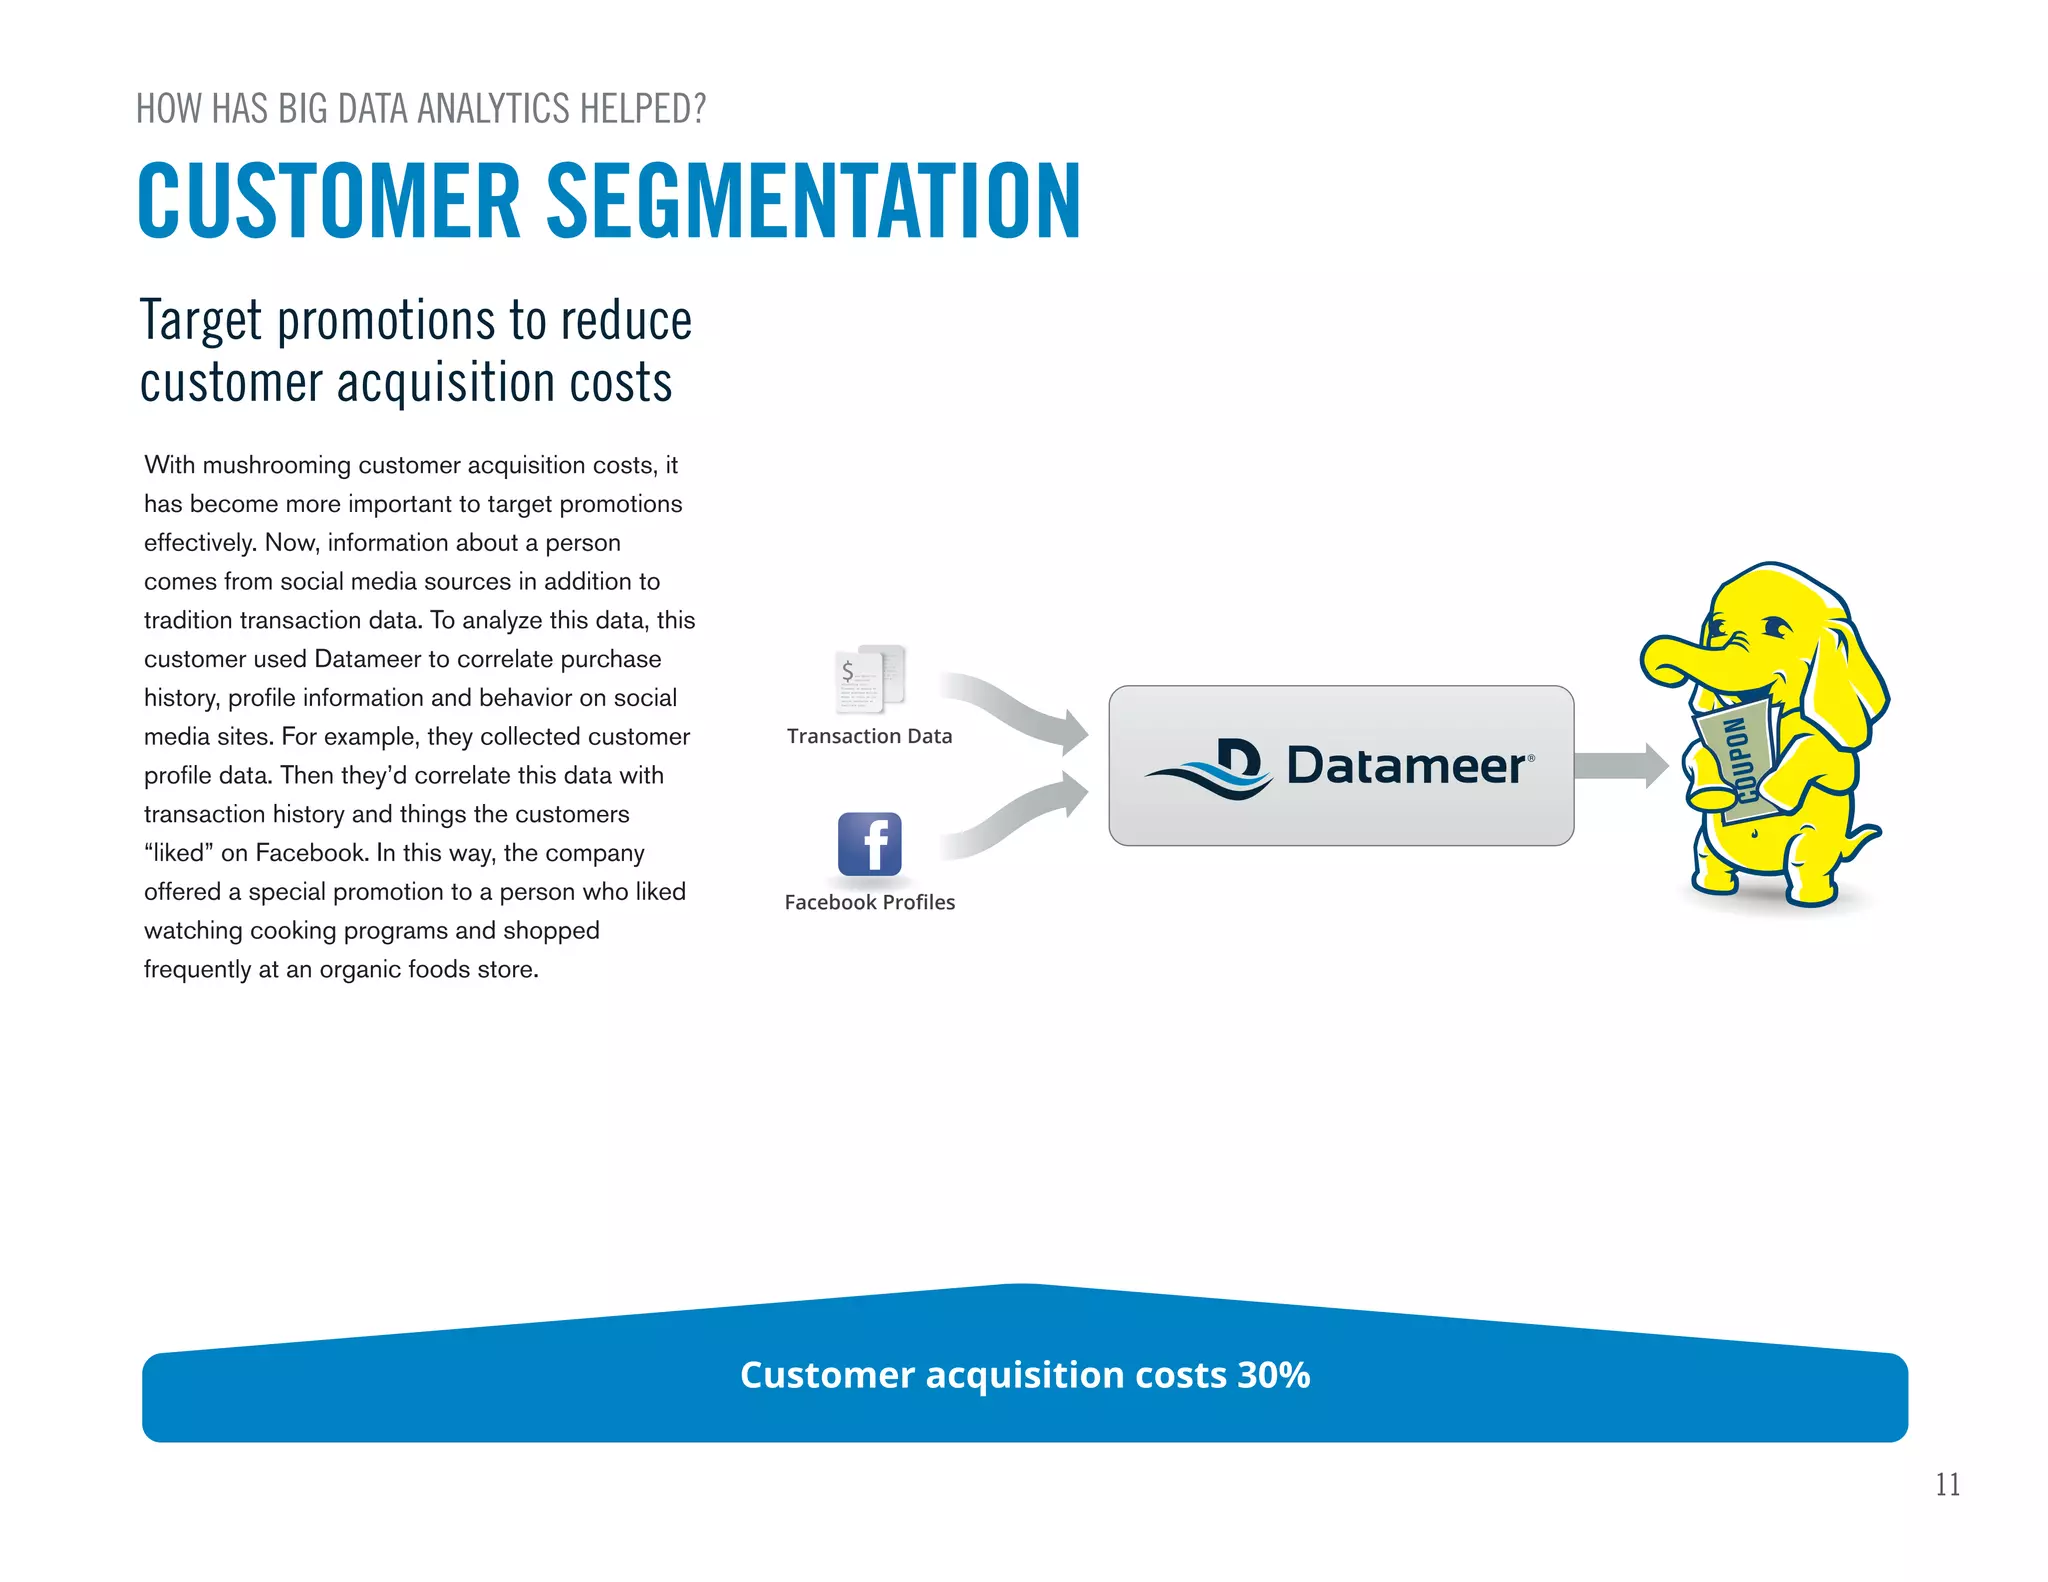
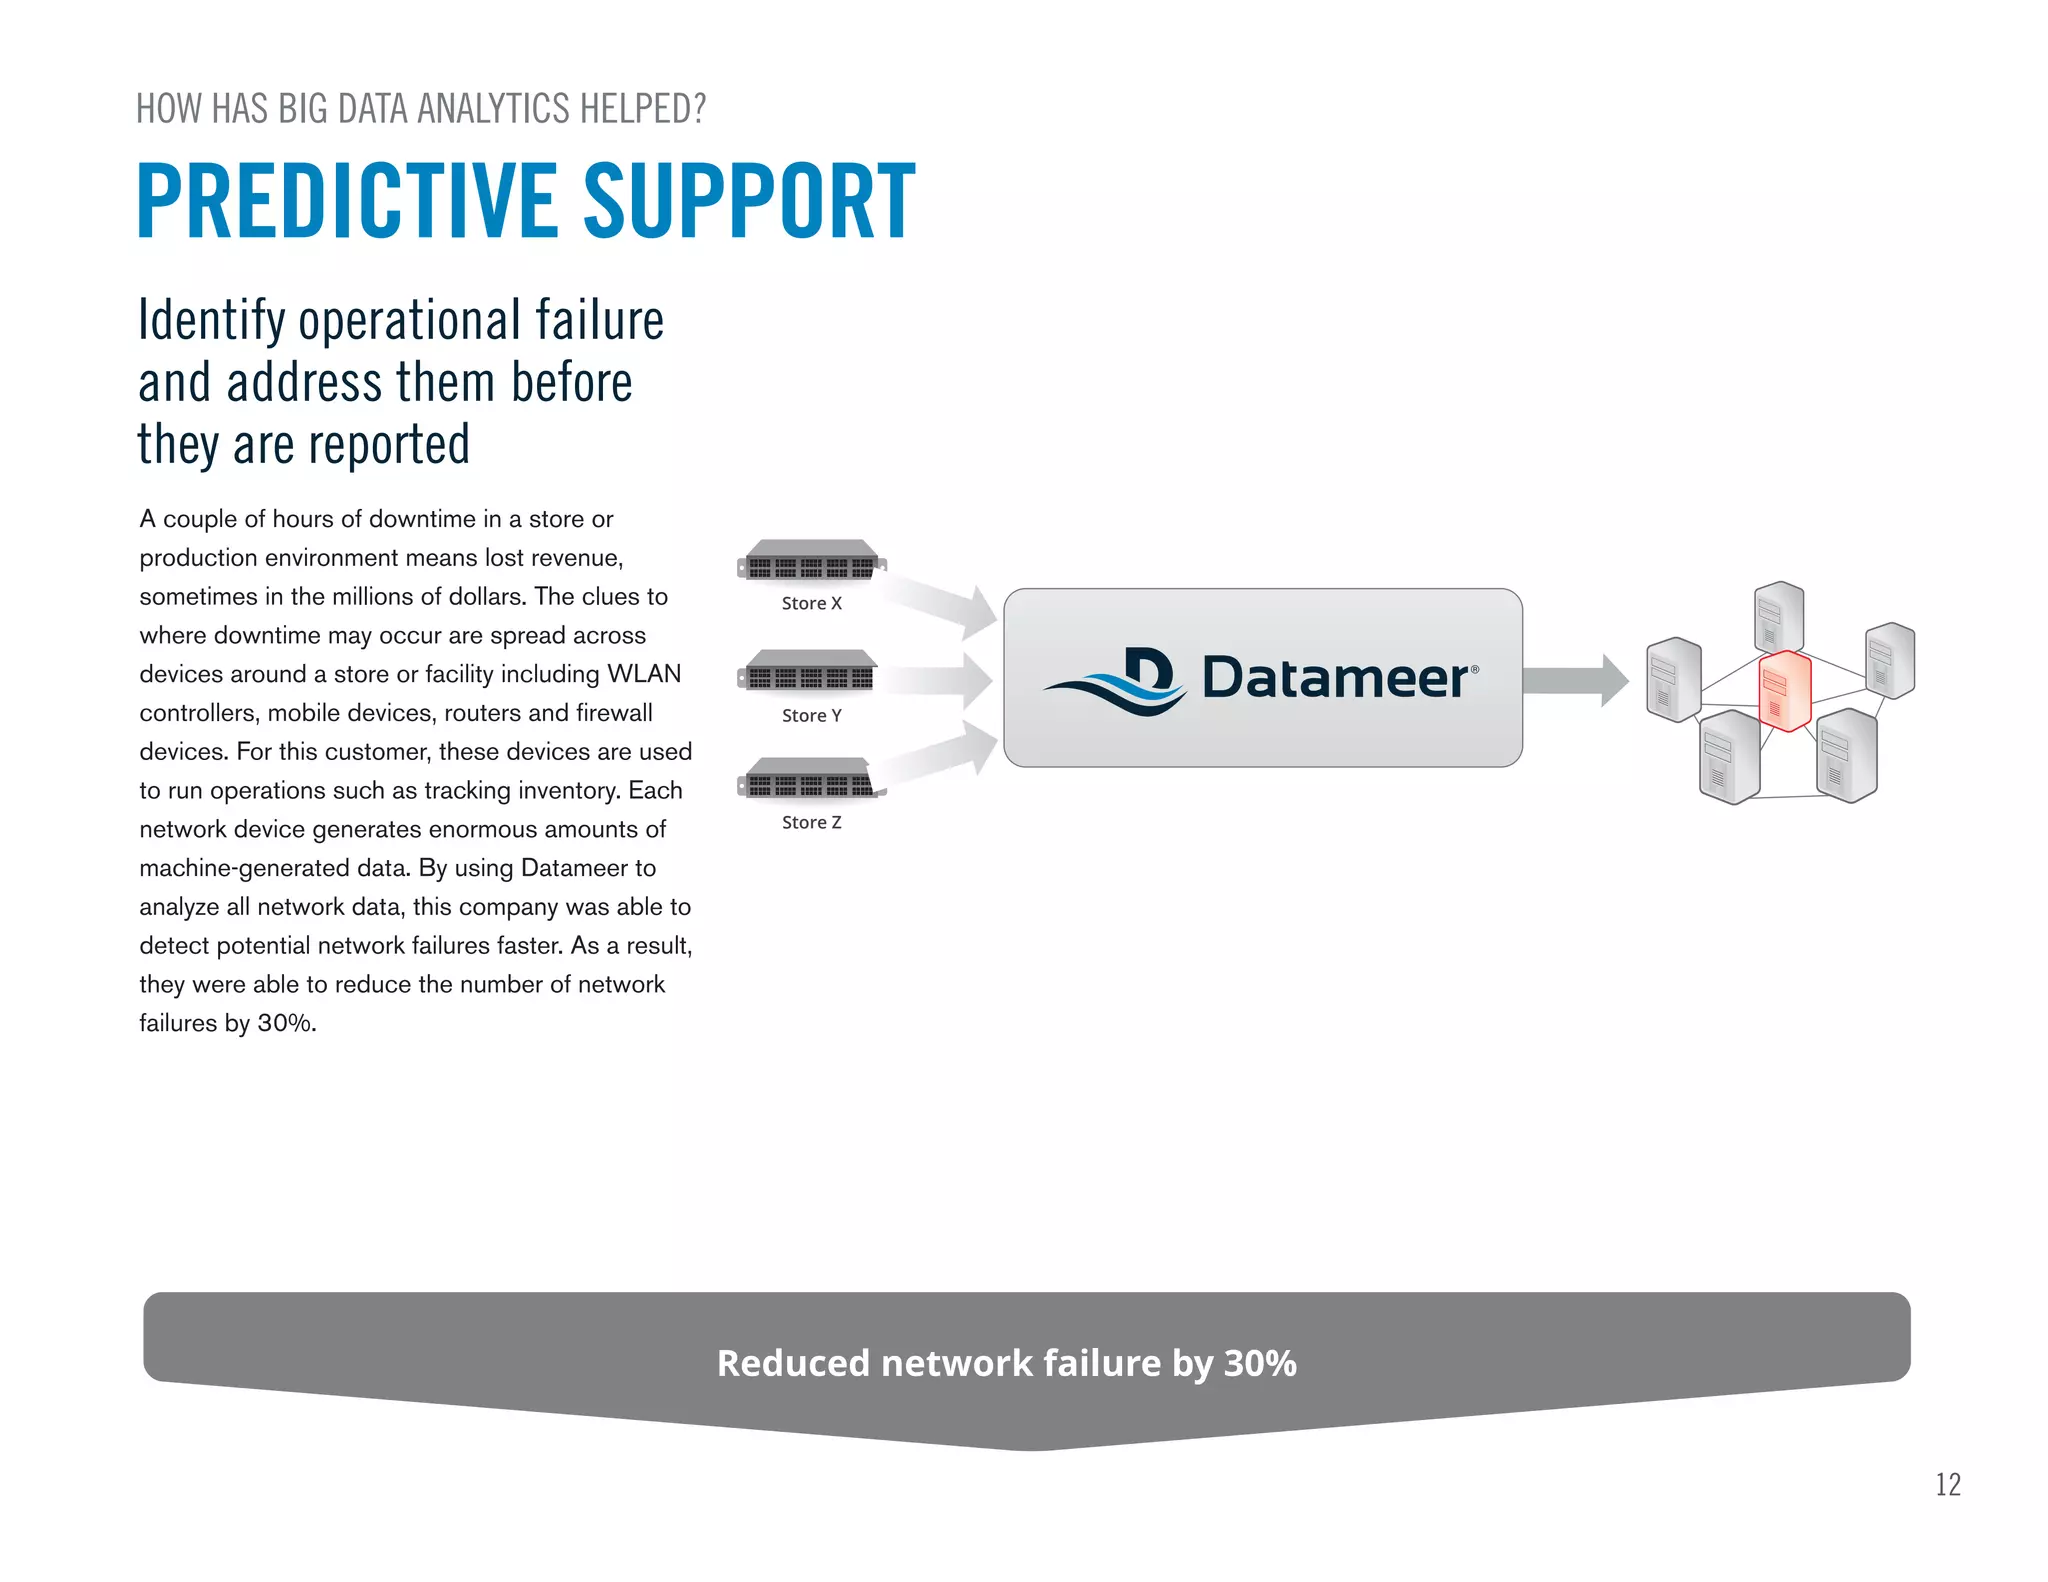
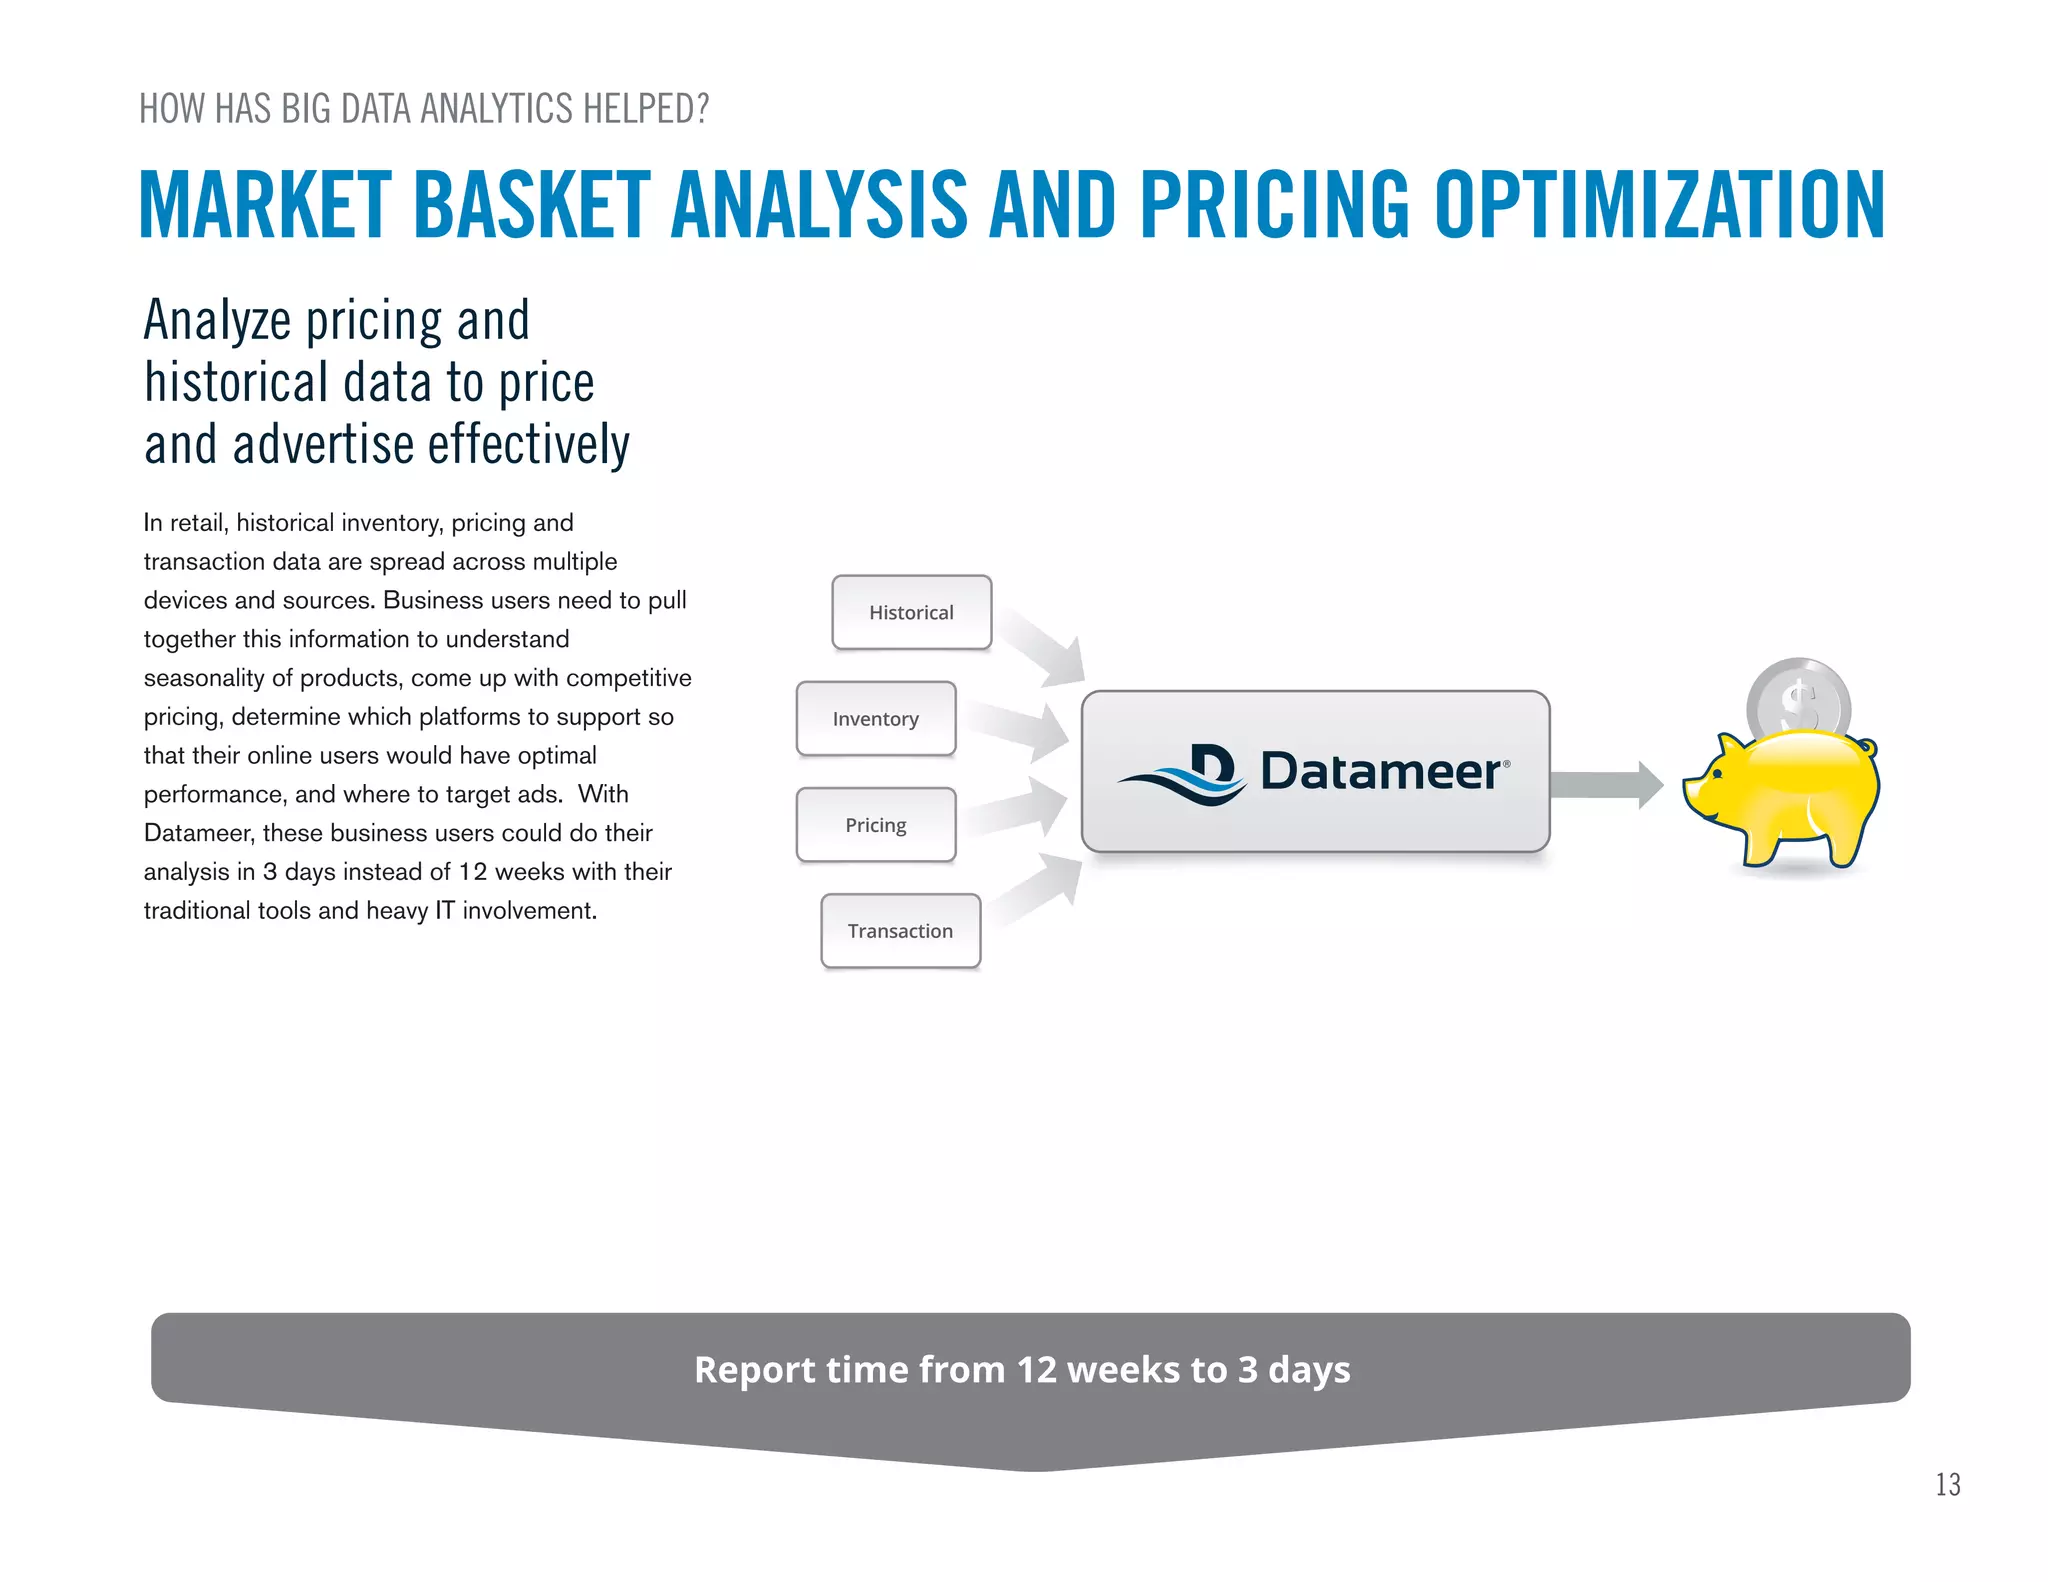
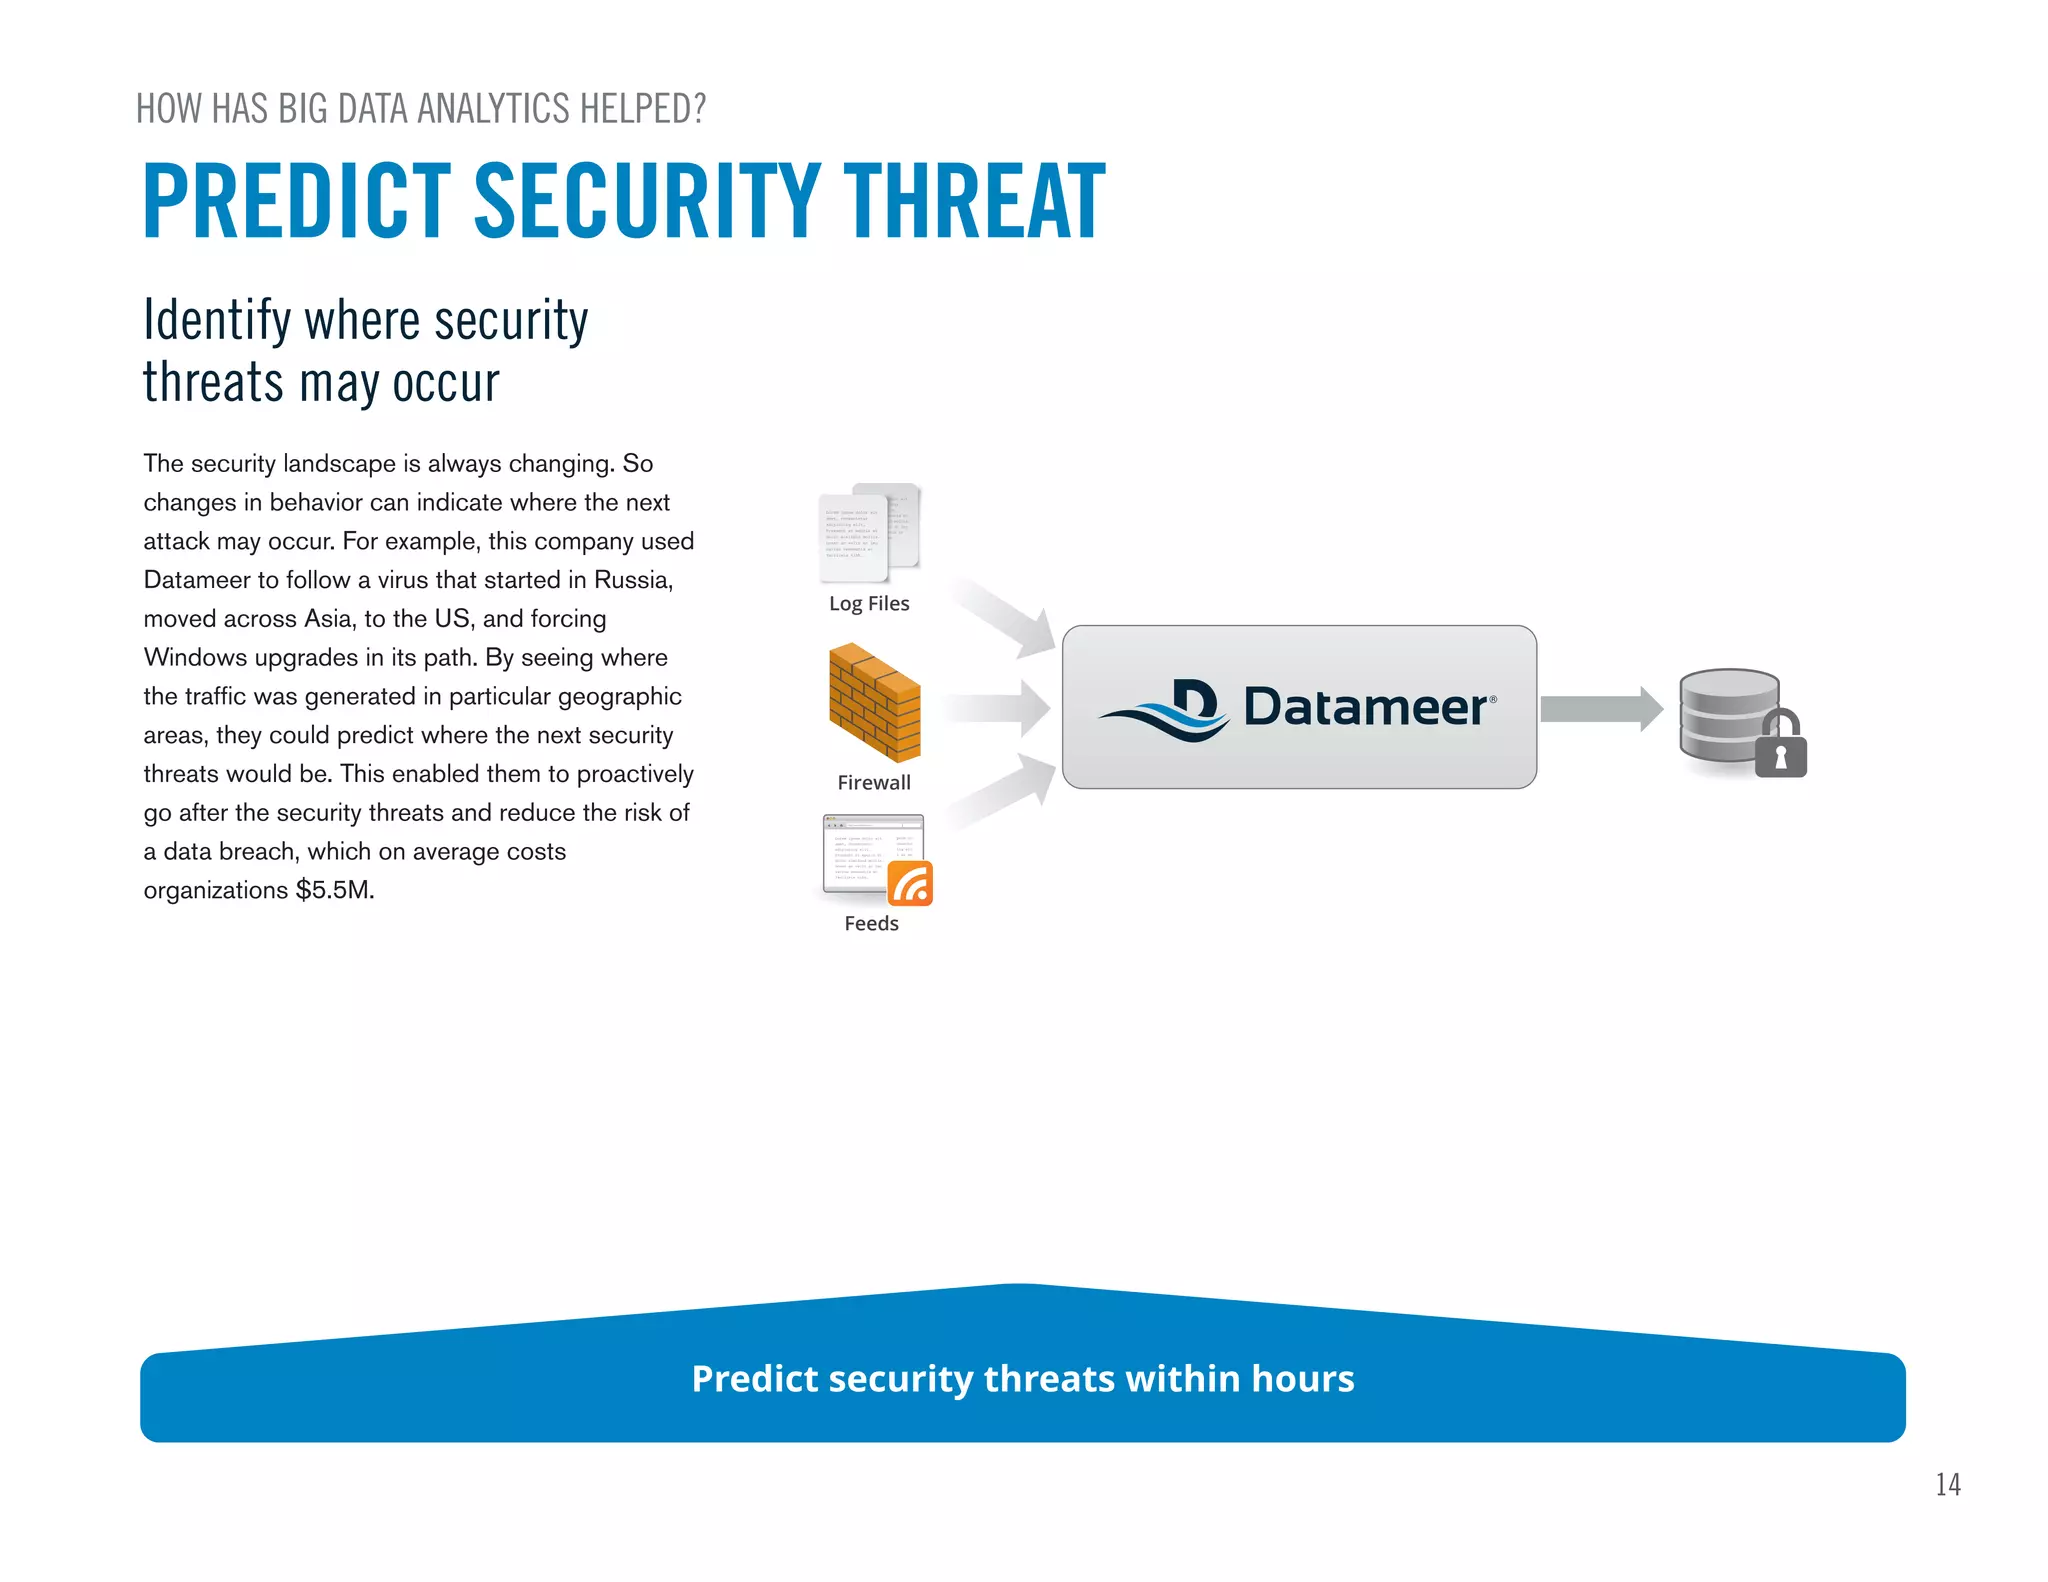
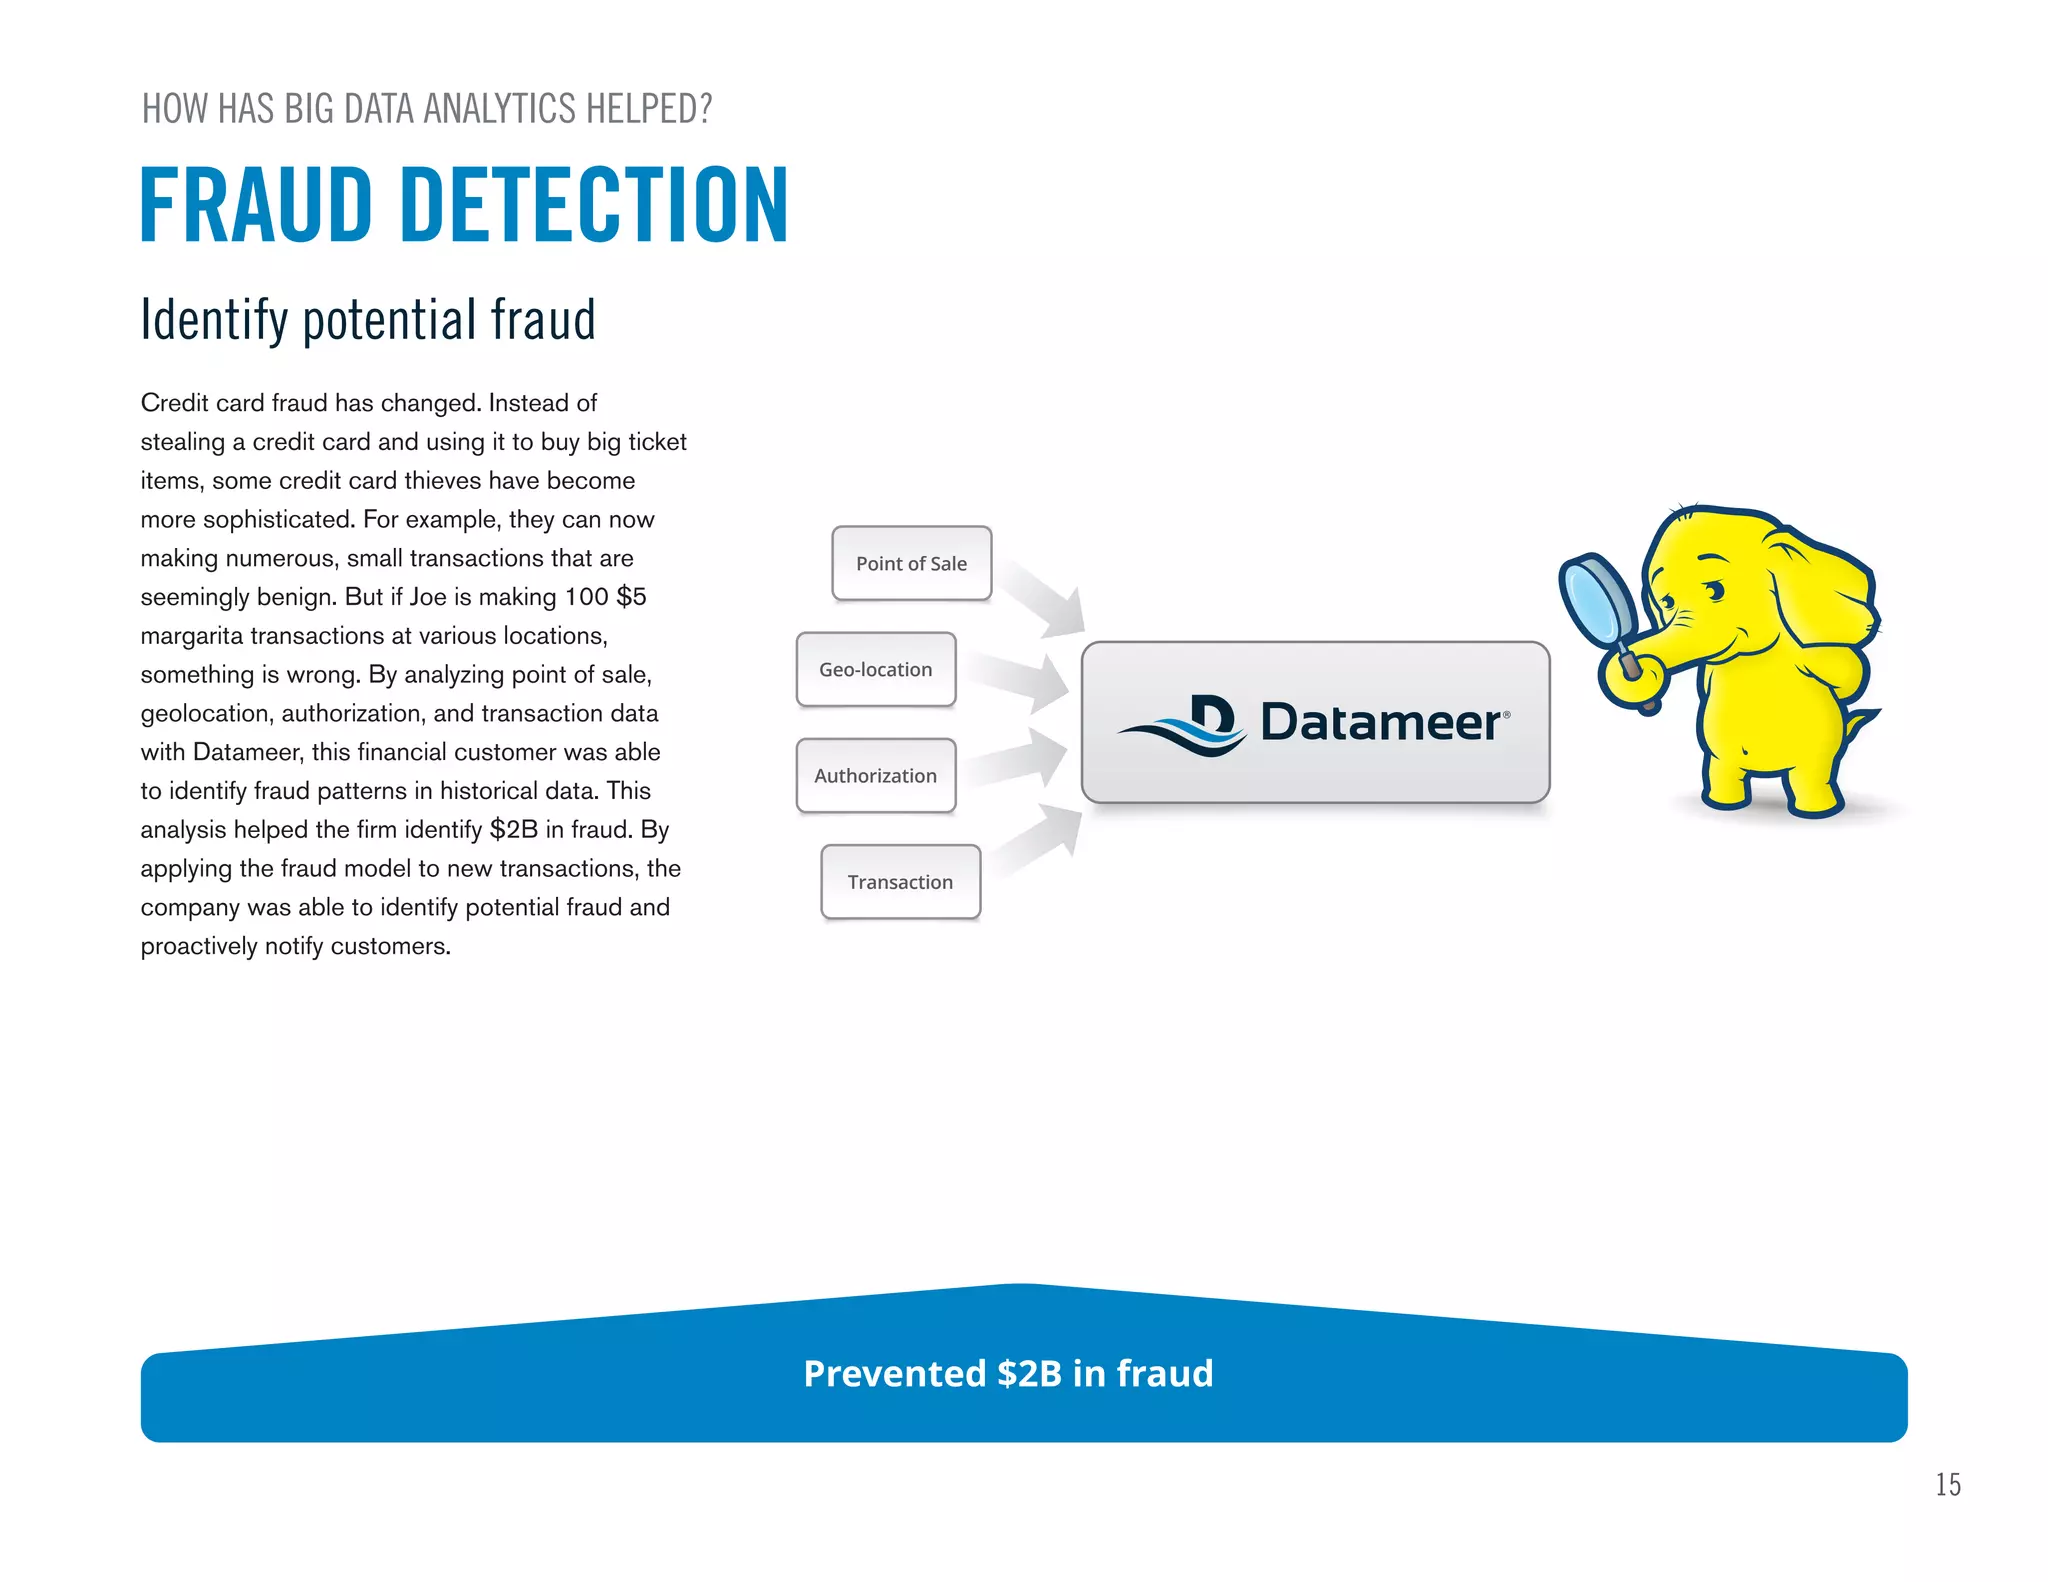
The document provides guidance on big data analytics. It discusses why big data analytics is important for companies to drive performance and results. It defines big data analytics as using analytics on large, diverse datasets to discover insights faster. The document then gives examples of how big data analytics has helped companies by increasing revenue, decreasing costs and time to insight, and improving customer acquisition, retention, and security. It addresses common questions around whether to buy or build a big data analytics solution.
1.Introduction
2.Overview
3.Why Big Data
4.Application of Big Data
5.Risks of Big Data
6.Benefits & Impact of Big Data
7.Conclusion
‘Big Data’ is similar to ‘small data’, but bigger in size
But having data bigger it requires different approaches:
Techniques, tools and architecture
An aim to solve new problems or old problems in a better
way
Big Data generates value from the storage and processing
of very large quantities of digital information that cannot be
analyzed with traditional computing techniques.
What is Big Data?
Big Data Laws
Why Big Data?
Industries using Big Data
Current process/SW in SCM
Challenges in SCM industry
How Big data can solve the problems?
Migration to Big data for an SCM industry
A Seminar Presentation on Big Data for Students.
Big data refers to a process that is used when traditional data mining and handling techniques cannot uncover the insights and meaning of the underlying data. Data that is unstructured or time sensitive or simply very large cannot be processed by relational database engines. This type of data requires a different processing approach called big data, which uses massive parallelism on readily-available hardware.
Big Data Ppt PowerPoint Presentation Slides SlideTeam
Big data has brought about a revolution in the field of information technology. Our content-ready big data PPT PowerPoint presentation slides shed light on the importance and relevance of large volumes of data. The data management presentation covers myriad of topics such as big data sources, market forecast, 3 Vs, technologies, workflow, data analytics process, impact, benefit, future, opportunity and challenges, and many additional slides containing graphs and charts. The biggest benefit that this big data analytics presentation template offers is that it enables you to unearth the information that can be used to shape the future of your business. Moreover, these designs can also be utilized to craft your own presentation on predictive analytics, data processing application, database, cloud computing, business intelligence, and user behavior analytics. Download big data PPT visuals which will help you make accurate business decisions. Enlighten folks on fraud with our Big Data PPt PowerPoint Presentation Slides. Convince them to be highly alert.
presentation on recent data mining Techniques ,and future directions of research from the recent research papers made in Pre-master ,in Cairo University under supervision of Dr. Rabie
What is big data ? | Big Data ApplicationsShilpaKrishna6
Big data is similar to ‘small data’ but bigger in size. It is a term that describes the large volume of data both structured and unstructured. Big data generates value from the storage and processing of very large quantities of digital information that cannot be analyzed with traditional computing techniques
It is a brief overview of Big Data. It contains History, Applications and Characteristics on BIg Data.
It also includes some concepts on Hadoop.
It also gives the statistics of big data and impact of it all over the world.
Disclaimer :
The images, company, product and service names that are used in this presentation, are for illustration purposes only. All trademarks and registered trademarks are the property of their respective owners.
Data/Image collected from various sources from Internet.
Intention was to present the big picture of Big Data & Hadoop
This lecture gives various definitions of Data Mining. It also gives why Data Mining is required. Various examples on Classification , Cluster and Association rules are given.
Big Data Analytics | What Is Big Data Analytics? | Big Data Analytics For Beg...Simplilearn
The presentation about Big Data Analytics will help you know why Big Data analytics is required, what is Big Data analytics, the lifecycle of Big Data analytics, types of Big Data analytics, tools used in Big Data analytics and few Big Data application domains. Also, we'll see a use case on how Spotify uses Big Data analytics. Big Data analytics is a process to extract meaningful insights from Big Data such as hidden patterns, unknown correlations, market trends, and customer preferences. One of the essential benefits of Big Data analytics is used for product development and innovations. Now, let us get started and understand Big Data Analytics in detail.
Below are explained in this Big Data analytics tutorial:
1. Why Big Data analytics?
2. What is Big Data analytics?
3. Lifecycle of Big Data analytics
4. Types of Big Data analytics
5. Tools used in Big Data analytics
6. Big Data application domains
What is this Big Data Hadoop training course about?
The Big Data Hadoop and Spark developer course have been designed to impart an in-depth knowledge of Big Data processing using Hadoop and Spark. The course is packed with real-life projects and case studies to be executed in the CloudLab.
What are the course objectives?
This course will enable you to:
1. Understand the different components of the Hadoop ecosystem such as Hadoop 2.7, Yarn, MapReduce, Pig, Hive, Impala, HBase, Sqoop, Flume, and Apache Spark
2. Understand Hadoop Distributed File System (HDFS) and YARN as well as their architecture, and learn how to work with them for storage and resource management
3. Understand MapReduce and its characteristics, and assimilate some advanced MapReduce concepts
4. Get an overview of Sqoop and Flume and describe how to ingest data using them
5. Create database and tables in Hive and Impala, understand HBase, and use Hive and Impala for partitioning
6. Understand different types of file formats, Avro Schema, using Arvo with Hive, and Sqoop and Schema evolution
7. Understand Flume, Flume architecture, sources, flume sinks, channels, and flume configurations
8. Understand HBase, its architecture, data storage, and working with HBase. You will also understand the difference between HBase and RDBMS
9. Gain a working knowledge of Pig and its components
10. Do functional programming in Spark
11. Understand resilient distribution datasets (RDD) in detail
12. Implement and build Spark applications
13. Gain an in-depth understanding of parallel processing in Spark and Spark RDD optimization techniques
14. Understand the common use-cases of Spark and the various interactive algorithms
15. Learn Spark SQL, creating, transforming, and querying Data frames
Learn more at https://www.simplilearn.com/big-data-and-analytics/big-data-and-hadoop-training
Big Data & Analytics (Conceptual and Practical Introduction)Yaman Hajja, Ph.D.
A 3-day interactive workshop for startups involve in Big Data & Analytics in Asia. Introduction to Big Data & Analytics concepts, and case studies in R Programming, Excel, Web APIs, and many more.
DOI: 10.13140/RG.2.2.10638.36162
Content:
Introduction
What is Big Data?
Big Data facts
Three Characteristics of Big Data
Storing Big Data
THE STRUCTURE OF BIG DATA
WHY BIG DATA
HOW IS BIG DATA DIFFERENT?
BIG DATA SOURCES
BIG DATA ANALYTICS
TYPES OF TOOLS USED IN BIG-DATA
Application Of Big Data analytics
HOW BIG DATA IMPACTS ON IT
RISKS OF BIG DATA
BENEFITS OF BIG DATA
Future of big data
Big data is a term that describes the large volume of data – both structured and unstructured – that inundates a business on a day-to-day basis. But it’s not the amount of data that’s important. It’s what organizations do with the data that matters. Big data can be analyzed for insights that lead to better decisions and strategic business moves.
This presentation, by big data guru Bernard Marr, outlines in simple terms what Big Data is and how it is used today. It covers the 5 V's of Big Data as well as a number of high value use cases.
This ppt was presented during the workshop on 'How to start mLearning' at the Online Educa Berlin 2009.
It includes m-planning, some tools and information on qr-codes for learning.
Universidad Minuto de Dios, presentado y realizado por Iveth Andrea Orduña Cruz, para al materia Gestión Básica de la información, ID 392209
POR FAVOR RESPONDA EL SIGUIENTE FORMULARIO DE ACUERDO A LO QUE LEYÓ: https://docs.google.com/forms/d/158OH8f91aUQ_BJ5FJoKpazWIYFCraZA_5ALUo1jzqOg/viewform?usp=send_form
LINK PRESENTACIÓN PREZI: http://prezi.com/qyqoni6basoj/gestion-basica-de-la-informacion/?utm_campaign=share&utm_medium=copy
Case study for incidence tracking system – Times groupMike Taylor
Incidence Tracking System-The ticket management solution is a web and mobile app that effectively manages tickets and helps the organization and individuals to organize their tickets. With a simple to use interface, the users can begin scheduling, assigning and creating tickets within seconds. No lengthy user manuals, no learning curve and no training sessions are needed at all. The ticket management solution is designed to be easy to use so that individuals can focus more time on their work. See More At: http://www.brainvire.com/incidence-tracking-system-times-group/
The best utilisation of biogas is upgrading to natural gas quality. The best way to do this is with pressurized water scrubbing. This presentation shows 4 innovations in the field of biogas upgrading with the PWS system, making it the ultimate upgrading technology. (presented at Bremen, waste to energy fair).
Weather Risk Limited founded in 2004, pioneered Weather Derivative contracts in the Indian Market. Since then, it has grown into a comprehensive global Climate Risk Management company with a fast growing footprint that spans India, Africa and Asia.
IBM Connections 4.5 CR2 Installation - From Zero To Social Hero - 2.02 - with...Frank Altenburg
IBM Connections 4.5 setup can be fast, smooth and easy when you know what you are doing. And I will show you how.
With this presentation I want to prove, that it is possible to install an IBM Connections 4.5 "Proof-Of-Concept" setup very quickly.
You can install and configure all the new IBM Connections 4.5 components : DB2 Server, IBM Tivoli Directory Integrator, IBM WebSphere Application Server (WAS), IBM HTTP Server, IBM COgnos, IBM Connections Content Manager and IBM Connections. This new version (2.01) does not contain any integration like Social Mail and Sametime. This is now separated in a separate document "IBM Connections 4.5 Integration - From Zero To Social Hero" This document now contains the CR1 update.
This is a place holder only. the full document can be downloaded from IBM Greenhouse (after your registration)
Oracle's BigData solutions consist of a number of new products and solutions to support customers looking to gain maximum business value from data sets such as weblogs, social media feeds, smart meters, sensors and other devices that generate massive volumes of data (commonly defined as ‘Big Data’) that isn’t readily accessible in enterprise data warehouses and business intelligence applications today.
An overview on FAIR Data and FAIR Data stewardship, and the roadmap for FAIR Data solutions coordinated by the Dutch Techcentre for Life Sciences. This presentation was given at the Netherlands eScience Center's "Essential skills in data-intensive research" course week.
An introduction to the FAIR principles and a discussion of key issues that must be addressed to ensure data is findable, accessible, interoperable and re-usable. The session explored the role of the CDISC and DDI standards for addressing these issues.
Presented by Gareth Knight at the ADMIT Network conference, organised by the Association for Data Management in the Tropics, in Antwerp, Belgium on December 1st 2015.
Big data analytics is the process of examining large and varied data sets -- i.e., big data -- to uncover hidden patterns, unknown correlations, market trends, customer preferences and other useful information that can help organizations make more-informed business decisions.
Is Your Company Braced Up for handling Big Datahimanshu13jun
Has your company recently launched new product or company is concerned with the poor sales figure or want to reach new prospects and also reduce the existing customers' attrition, then this thought evoking short hand guide is available for you to explore.
Now companies are in the middle of a renovation that forces them to be analytics-driven to
continue being competitive. Data analysis provides a complete insight about their business. It
also gives noteworthy advantages over their competitors. Analytics-driven insights compel
businesses to take action on service innovation, enhance client experience, detect irregularities in
process and provide extra time for product or service marketing. To work on analytics driven
activities, companies require to gather, analyse and store information from all possible sources.
Companies should bring appropriate tools and workflows in practice to analyse data rapidly and
unceasingly. They should obtain insight from data analysis result and make changes in their
business process and practice on the basis of gained result. It would help to be more agile than
their previous process and function.
Camssguide Big Data Analytics Solutions, can help you meet and exceed challenges and opportunities for business, industry, and technology solution areas
This talk is an introduction to Data Science. It explains Data Science from two perspectives - as a profession and as a descipline. While covering the benefits of Data Science for business, It explaints how to get started for embracing data science in business.
Data Mining: The Top 3 Things You Need to Know to Achieve Business Improvemen...Dr. Cedric Alford
While companies have been using various CRM and automation technologies for many years to capture and retain traditional business data, these existing technologies were not built to handle the massive explosion in data that is occurring today. The shift started nearly 10 years ago with expanding usage of the internet and the introduction of social media. But the pace has accelerated in the past five years following the introduction of smart phones and digital devices such as tablets and GPS devices. The continued rise in these technologies is creating a constant increase in complex data on a daily basis.
The result? Many companies don't know how to get value and insights from the massive amounts of data they have today. Worse yet, many more are uncertain how to leverage this data glut for business advantage tomorrow. In this white paper, we will explore three important things to know about big data and how companies can achieve major business benefits and improvements through effective data mining of their own big data.
Dr. Cedric Alford provides a roadmap for organizations seeking to understand how to make Big Data actionable.
Who needs Big Data? What benefits can organisations realistically achieve with Big Data? What else required for success? What are the opportunities for players in this space? In this paper, Cartesian explores these questions surrounding Big Data.
www.cartesian.com
The objective of this module is to provide an overview of what the future impacts of big data are likely to be.
Upon completion of this module you will:
Gain valuable insight into the predictions for the future of Big Data
Be better placed to recognise some of the trends that are emerging
Acquire an overview of the possible opportunities your business can have with Big Data
Understand some of the start up challenges you might have with Big Data
Data Analytics has become a powerful tool to drive corporates and businesses. check out this 6 Reasons to Use Data Analytics. Visit: https://www.raybiztech.com/blog/data-analytics/6-reasons-to-use-data-analytics
Let's dive deeper into the world of ODC! Ricardo Alves (OutSystems) will join us to tell all about the new Data Fabric. After that, Sezen de Bruijn (OutSystems) will get into the details on how to best design a sturdy architecture within ODC.
DevOps and Testing slides at DASA ConnectKari Kakkonen
My and Rik Marselis slides at 30.5.2024 DASA Connect conference. We discuss about what is testing, then what is agile testing and finally what is Testing in DevOps. Finally we had lovely workshop with the participants trying to find out different ways to think about quality and testing in different parts of the DevOps infinity loop.
Connector Corner: Automate dynamic content and events by pushing a buttonDianaGray10
Here is something new! In our next Connector Corner webinar, we will demonstrate how you can use a single workflow to:
Create a campaign using Mailchimp with merge tags/fields
Send an interactive Slack channel message (using buttons)
Have the message received by managers and peers along with a test email for review
But there’s more:
In a second workflow supporting the same use case, you’ll see:
Your campaign sent to target colleagues for approval
If the “Approve” button is clicked, a Jira/Zendesk ticket is created for the marketing design team
But—if the “Reject” button is pushed, colleagues will be alerted via Slack message
Join us to learn more about this new, human-in-the-loop capability, brought to you by Integration Service connectors.
And...
Speakers:
Akshay Agnihotri, Product Manager
Charlie Greenberg, Host
Builder.ai Founder Sachin Dev Duggal's Strategic Approach to Create an Innova...Ramesh Iyer
In today's fast-changing business world, Companies that adapt and embrace new ideas often need help to keep up with the competition. However, fostering a culture of innovation takes much work. It takes vision, leadership and willingness to take risks in the right proportion. Sachin Dev Duggal, co-founder of Builder.ai, has perfected the art of this balance, creating a company culture where creativity and growth are nurtured at each stage.
"Impact of front-end architecture on development cost", Viktor TurskyiFwdays
I have heard many times that architecture is not important for the front-end. Also, many times I have seen how developers implement features on the front-end just following the standard rules for a framework and think that this is enough to successfully launch the project, and then the project fails. How to prevent this and what approach to choose? I have launched dozens of complex projects and during the talk we will analyze which approaches have worked for me and which have not.
Smart TV Buyer Insights Survey 2024 by 91mobiles.pdf91mobiles
91mobiles recently conducted a Smart TV Buyer Insights Survey in which we asked over 3,000 respondents about the TV they own, aspects they look at on a new TV, and their TV buying preferences.
Kubernetes & AI - Beauty and the Beast !?! @KCD Istanbul 2024Tobias Schneck
As AI technology is pushing into IT I was wondering myself, as an “infrastructure container kubernetes guy”, how get this fancy AI technology get managed from an infrastructure operational view? Is it possible to apply our lovely cloud native principals as well? What benefit’s both technologies could bring to each other?
Let me take this questions and provide you a short journey through existing deployment models and use cases for AI software. On practical examples, we discuss what cloud/on-premise strategy we may need for applying it to our own infrastructure to get it to work from an enterprise perspective. I want to give an overview about infrastructure requirements and technologies, what could be beneficial or limiting your AI use cases in an enterprise environment. An interactive Demo will give you some insides, what approaches I got already working for real.
Slack (or Teams) Automation for Bonterra Impact Management (fka Social Soluti...Jeffrey Haguewood
Sidekick Solutions uses Bonterra Impact Management (fka Social Solutions Apricot) and automation solutions to integrate data for business workflows.
We believe integration and automation are essential to user experience and the promise of efficient work through technology. Automation is the critical ingredient to realizing that full vision. We develop integration products and services for Bonterra Case Management software to support the deployment of automations for a variety of use cases.
This video focuses on the notifications, alerts, and approval requests using Slack for Bonterra Impact Management. The solutions covered in this webinar can also be deployed for Microsoft Teams.
Interested in deploying notification automations for Bonterra Impact Management? Contact us at sales@sidekicksolutionsllc.com to discuss next steps.
JMeter webinar - integration with InfluxDB and GrafanaRTTS
Watch this recorded webinar about real-time monitoring of application performance. See how to integrate Apache JMeter, the open-source leader in performance testing, with InfluxDB, the open-source time-series database, and Grafana, the open-source analytics and visualization application.
In this webinar, we will review the benefits of leveraging InfluxDB and Grafana when executing load tests and demonstrate how these tools are used to visualize performance metrics.
Length: 30 minutes
Session Overview
-------------------------------------------
During this webinar, we will cover the following topics while demonstrating the integrations of JMeter, InfluxDB and Grafana:
- What out-of-the-box solutions are available for real-time monitoring JMeter tests?
- What are the benefits of integrating InfluxDB and Grafana into the load testing stack?
- Which features are provided by Grafana?
- Demonstration of InfluxDB and Grafana using a practice web application
To view the webinar recording, go to:
https://www.rttsweb.com/jmeter-integration-webinar
Software Delivery At the Speed of AI: Inflectra Invests In AI-Powered QualityInflectra
In this insightful webinar, Inflectra explores how artificial intelligence (AI) is transforming software development and testing. Discover how AI-powered tools are revolutionizing every stage of the software development lifecycle (SDLC), from design and prototyping to testing, deployment, and monitoring.
Learn about:
• The Future of Testing: How AI is shifting testing towards verification, analysis, and higher-level skills, while reducing repetitive tasks.
• Test Automation: How AI-powered test case generation, optimization, and self-healing tests are making testing more efficient and effective.
• Visual Testing: Explore the emerging capabilities of AI in visual testing and how it's set to revolutionize UI verification.
• Inflectra's AI Solutions: See demonstrations of Inflectra's cutting-edge AI tools like the ChatGPT plugin and Azure Open AI platform, designed to streamline your testing process.
Whether you're a developer, tester, or QA professional, this webinar will give you valuable insights into how AI is shaping the future of software delivery.
2. TABLE OF
CONTENTS 02 Why Big Data Analytics?
04 What is Big Data Analytics?
06 How has Big Data Analytics helped
companies?
17 How do I decide whether to buy or build?
21 If I build, what do I need?
25 How do I select the right Big Data Analytics
Solution for me?
27 Getting Successful with Big Data Analytics -
more than technology
38 Key Takeaways
39 Key Big Data Analytics Experts
01
4. Companies that use data to drive their business (in blue) perform
better than companies who do not.
WHY IS BIG DATA ANALYTICS SO IMPORTANT?
1. Data Drives Performance
Companies from all industries use big data analytics to:
• Increase revenue
• Decrease costs
• Increase productivity
2. Big Data Analytics Drives Results
$0
$43
$86
$129
$171
$214
$257
$300
12/31/09
03/31/10
06/30/10
09/30/10
12/31/10
03/31/11
06/30/11
09/30/11
12/31/11
03/31/12
06/30/12
09/30/12
12/31/12
03/21/13
Amazon vs Barnes & Noble
$0
$150
$300
$450
$600
$750
$900
12/31/09
03/31/10
06/30/10
09/30/10
12/31/10
03/31/11
06/30/11
09/30/11
12/31/11
03/31/12
06/30/12
09/30/12
12/31/12
03/21/13
Google vs Yahoo
$0
$10
$20
$30
$40
$50
$60
12/31/09
03/31/10
06/30/10
09/30/10
12/31/10
03/31/11
06/30/11
09/30/11
12/31/11
03/31/12
06/30/12
09/30/12
12/31/12
03/21/13
Cabela’s vs Big 5 Sporting Goods
2x 3x
12
weeks
to
3 days
INCREASE
in revenue
(Online Gaming
Company)
REDUCE TIME
to insight
INCREASE
in customer
acquisition
(Software Security
Company)
03
WHY BIG DATA ANALYTICS?
* Powered by Datameer
6. WHAT IS BIG DATA ANALYTICS AND
WHAT MAKES IT SO POWERFUL?
The Problem
05
WHAT IS BIG DATA ANALYTICS?
Before Hadoop, we had limited storage and compute, which led to a long and rigid analytics process (see below). First, IT goes through a lengthy process
(often known as ETL) to get every new data source ready to be stored. After getting the data ready, IT puts the data into a database or data warehouse, and
into a static data model. The problem with that approach is that IT designs the data model today with the knowledge of yesterday, and you have to hope that
it will be good enough for tomorrow. But nobody can predict the perfect schema. Then on top of that you put a business intelligence tool, which because of
the static schemas underneath, is optimized to answer KNOWN QUESTIONS.
TDWI says this 3-part process takes 18 months to implement or change. And on average it takes 3 months to integrate a new data source.
The business is telling us they cannot operate at this speed anymore. And there is a better way.
Data Warehouse Business IntelligenceETL
Raw Data Hadoop
Drag & Drop
Spreadsheet
18 months
less than 2 months
7. You need a solution with a different approach. First, you need a way to
bring in all the different data sources that is much faster than traditional
ETL. You need to be able load in raw data. That means loading all metadata
in the form it was generated — as a log file, database table, mainframe
copybook or a social media stream.
Second, you need a way to discover insights unencumbered by predefined
models. You need to be able to iterate with a widely used analysis tool,
such as a spreadsheet. Finally, you need a way to visualize those insights
and have those visualizations automatically updated. So as your business
changes, you can see and get ahead of those changes.
The Solution
Comprehensive
Integration
Schema Free
Analytics
Powerful
Visualizations
WHAT IS BIG DATA ANALYTICS AND
WHAT MAKES IT SO POWERFUL?
WHAT IS BIG DATA ANALYTICS?
06
9. 08
BIG DATA ANALYTICS SUCCESSES
Optimize Funnel Conversion
Behavioral Analytics
Customer Segmentation
Predictive Support
Market Basket Analysis and
Pricing Optimization
Predict Security Threat
Fraud Detection
Increased customer conversion by 3x
2X Revenue
Decreased customer acquisition costs by 30%
Decreased customer churn
Reduced time to insight from 12 weeks to 3 days
Predict security threats within hours
Prevented $2B in potential fraud
Software Security
Online Gaming
Financial Services
Enterprise Storage
Retail
Software Security
Financial Services
Use Case Industry Benefit
HOW HAS BIG DATA ANALYTICS HELPED?
10. 09
OPTIMIZE FUNNEL CONVERSION
HOW HAS BIG DATA ANALYTICS HELPED?
Identify roadblocks in
funnel conversion
Customer Conversion Increased by 60%
Generating traffic is good. But generating traffic
that leads to sales is better. Datameer has helped
companies identify which Google AdWords lead
To sales. By analyzing Google AdWords,
Salesforce, and Marketo data, this company was
able to track a lead from AdWord click through to
transaction. As a result, this company was able to
improve funnel conversion by 3x, leading to $20M
in additional revenue.
11. 10
BEHAVIORAL ANALYTICS
HOW HAS BIG DATA ANALYTICS HELPED?
Improve game flow and
increase number of
paying customers
Increased revenue by 2x
User Profile
Game Event Logs
The game for gaming companies is to increase
customer acquisition, retention and
monetization. This means getting more users to
play, play more often and longer, and pay. First,
analysts use Datameer to identify common
characteristics of users. As a result, gaming
companies can target these users better with
the right advertising placement and content. To
increase retention, analysts use Datameer to
understand what gets a user to play longer. A
user who plays longer and interacts with other
players makes the overall gaming experience
better. To increase monetization, analysts use
Datameer to identify the group of users most
likely to pay based on common characteristics.
As a result of this analysis the company was
able to double their revenue to over $100M.
12. 11
CUSTOMER SEGMENTATION
HOW HAS BIG DATA ANALYTICS HELPED?
Target promotions to reduce
customer acquisition costs
Customer acquisition costs 30%
$
Facebook Profiles
Transaction Data
With mushrooming customer acquisition costs, it
has become more important to target promotions
effectively. Now, information about a person
comes from social media sources in addition to
tradition transaction data. To analyze this data, this
customer used Datameer to correlate purchase
history, profile information and behavior on social
media sites. For example, they collected customer
profile data. Then they’d correlate this data with
transaction history and things the customers
“liked” on Facebook. In this way, the company
offered a special promotion to a person who liked
watching cooking programs and shopped
frequently at an organic foods store.
13. 12
PREDICTIVE SUPPORT
HOW HAS BIG DATA ANALYTICS HELPED?
Identify operational failure
and address them before
they are reported
Reduced network failure by 30%
A couple of hours of downtime in a store or
production environment means lost revenue,
sometimes in the millions of dollars. The clues to
where downtime may occur are spread across
devices around a store or facility including WLAN
controllers, mobile devices, routers and firewall
devices. For this customer, these devices are used
to run operations such as tracking inventory. Each
network device generates enormous amounts of
machine-generated data. By using Datameer to
analyze all network data, this company was able to
detect potential network failures faster. As a result,
they were able to reduce the number of network
failures by 30%.
Store X
Store Y
Store Z
14. Historical
Inventory
Pricing
Transaction
13
MARKET BASKET ANALYSIS AND PRICING OPTIMIZATION
HOW HAS BIG DATA ANALYTICS HELPED?
Analyze pricing and
historical data to price
and advertise effectively
Report time from 12 weeks to 3 days
In retail, historical inventory, pricing and
transaction data are spread across multiple
devices and sources. Business users need to pull
together this information to understand
seasonality of products, come up with competitive
pricing, determine which platforms to support so
that their online users would have optimal
performance, and where to target ads. With
Datameer, these business users could do their
analysis in 3 days instead of 12 weeks with their
traditional tools and heavy IT involvement.
15. 14
PREDICT SECURITY THREAT
HOW HAS BIG DATA ANALYTICS HELPED?
Identify where security
threats may occur
Predict security threats within hours
Feeds
Log Files
Firewall
The security landscape is always changing. So
changes in behavior can indicate where the next
attack may occur. For example, this company used
Datameer to follow a virus that started in Russia,
moved across Asia, to the US, and forcing
Windows upgrades in its path. By seeing where
the traffic was generated in particular geographic
areas, they could predict where the next security
threats would be. This enabled them to proactively
go after the security threats and reduce the risk of
a data breach, which on average costs
organizations $5.5M.
16. 15
FRAUD DETECTION
HOW HAS BIG DATA ANALYTICS HELPED?
Identify potential fraud
Prevented $2B in fraud
Credit card fraud has changed. Instead of
stealing a credit card and using it to buy big ticket
items, some credit card thieves have become
more sophisticated. For example, they can now
making numerous, small transactions that are
seemingly benign. But if Joe is making 100 $5
margarita transactions at various locations,
something is wrong. By analyzing point of sale,
geolocation, authorization, and transaction data
with Datameer, this financial customer was able
to identify fraud patterns in historical data. This
analysis helped the firm identify $2B in fraud. By
applying the fraud model to new transactions, the
company was able to identify potential fraud and
proactively notify customers.
Point of Sale
Geo-location
Authorization
Transaction
18. QUESTIONS TO ASK
BUY VS. BUILD
We have done hundreds of implementation and found that in order to make a decision
for build vs. buy, the following questions are critical:
Questions to ask when considering the BUILD option:
How much time and money will it take to build a team that can
build the desired solution?
Does your organization have the time to hire the right people?
Can you afford to wait 1 year or more before you get insights?
Have you considered ongoing software maintenance costs?
Are you willing to wait 3 months to add a new data source?
Are you willing to manage 3 different teams (for integration,
analysis and visualization)?
How about all the communication time required to keep in
sync regarding changes in the project?
Questions to ask when considering the BUY option:
Have you defined your decision criteria?
(See Decision Criteria for selecting a big data analytics solution p.28)
Have you confirmed that the solution solves your
objectives and proof points?
Have you validated your choice? Have you done
reference calls?
Do you have the right people in place to deploy and use
this solution?
Will you need to train people?
What sort of project is my use case? Data application, discovery or reporting?
17
19. 18
HOW LONG DOES IT TAKE TO BUILD A BIG DATA
ANALYTICS SOLUTION AS COMPARED TO BUYING ONE?
BUY VS. BUILD
Data loading
Data loading Analytics
Analyze data Visualize data Export data Secure data Monitoring
Transform data and
perform data quality
Scheduling and
dependencies
BUILD
BUY
14+ months
3 months
20. 19
1
2
3Fewer steps in the process
Instead of hiring developers, ramping them up, defining,
developing, testing, deploying and then analyzing, you can go
directly to defining and analyzing.
Fewer technical requirements
Instead of manually building capabilities for data loading,
data parsing, data analytics, visualization, scheduling,
dependency management, data synchronization, monitoring
API, management UI, and security integration, you can have
it in one, purchased platform.
Prebuilt integration, analytics and
visualization functionality
ADVANTAGES OF BUYING VS. BUILDING
A BIG DATA ANALYTICS SOLUTION
BUY VS. BUILD
Seamless Data Integration
• Structured, semi and unstructured
• Pre-built connectors
• Connector plug-in API
Powerful Analytics
• Interactive spreadsheet UI
• Built-in analytic functions
• Macros and function plug-in API
Business Infographics
• Mash up anything, WYSIWYG
• Infographics and dashboards
• Visualization plug-in API
22. 21
WHAT DO I NEED?
IF I BUILD...
Architecture Hardware
Functionality Process
23. 22
Linux JVM Monitoring Hadoop Analytics
WHAT ARCHITECTURE DO I NEED?
IF I BUILD...
Software
Master/Secondary Slaves Network Application Server
Hardware
24. 23
Data Loading — A software has to be developed to load
data from multiple, various data sources. This system
needs to deal with the distributed nature of Hadoop on
the one side and the non-distributed nature of the data
source. The system needs to deal with corrupted records
and need to provide monitoring services.
In your big data analytics solution, you will need to provide the following:
(see notes section for descriptions)
WHAT FUNCTIONALITY DO I NEED?
IF I BUILD...
Data Loading
Dependency Management — There are complex
dependencies that must be managed. For example,
certain data sets have to be loaded before certain
jobs in Hadoop can be run.
Dependency
Management
Data synchronization — Data often needs to be
pushed from Hadoop in to a data store like a
database or in-memory system.
Data
Synchronization
Monitoring API — Every aspect of a big data
analytics solution needs to be monitored. Things
that need to monitored include who has access to
the system, job health, performance, and data
throughput.
Monitoring API
Management UI — A management user interface
is critical for ease of configuration and monitoring.
Management UI
Security Integration — For security purposes, it is
important to be able to integrate with Kerberos and
LDAP.
Security
Integration
Data Parsing — Most data sources provide data in a
certain format that needs to be parsed into the
Hadoop system. For example, let’s consider parsing a
log file into records. Some formats are complicated to
parse like JSON where a record can be on many lines
of text and not just one line per record.
Data Parsing
Data Analytics — In order for data to be properly
analyzed, a big data analytics solution needs to
support rapid iterations.Data Analytics
Scheduling — All the items discussed above need to
be orchestrated and scheduled. Scheduling needs to
be easy to configure. In addition, the scheduling needs
have monitoring services to notify administrators of
jobs that fail.
Scheduling
Data Visualization — In order for an analyst to see
the insights, data needs to be visualized. Integrating
visualization is difficult because middleware needs to
be built to deliver the data out of Hadoop and into the
visualization layer.
Data
Visualization
25. 24
It is very difficult to hire engineers
that are experienced with Hadoop.
Most already work for other big
companies and/or are very
expensive. Hadoop resources can
cost $300K/ year or more.
The first step is a design phase
and includes requirements
gathering (that will change later),
technical design, release and
resource planning.
In the implementation phase all
the “heavy lifting” development
work has to be done.
In this phase, as test
development is tested, test
engineers and a dedicated test
environment is required. This
often doubles hardware costs.
When building a system frequent
deployment into the production
system occurs. This means the
production system is frequently
down or another staging
environment is required.
When all design, develop, test and
deploy work is done then you can
finally start analyzing the data.
Most often you will find that people have
limited Hadoop experience, and you will need
to train them on the technology. This is a
significant investment in time and money. In
addition, practical Hadoop experience only
comes from running a Hadoop environment.
Hire Team
Train Team
on technology
Define Develop Test Deploy Analyze
In your big data analytics solution, you will need to provide the following:
WHAT PROCESS DO I NEED?
IF I BUILD...
26. How do I Select
THE RIGHT BIG DATA ANALYTICS
SOLUTION FOR ME?
27. 26
Ease of use
Does the business need IT to Help?
Can a business analyst use the tool to do analysis?
Data Integration
Does system support native connectors to unstructured and semi-structured
data sources (e.g. email, log files, social, SaaS, machine data)? Does it
support flexible partitioning of the data so that it is easy to work with large
amounts of data? Does the solution support streaming of data so that users
will have the most current data? Does the solution provide data quality
functions so that the data can be quickly normalized and transformed?
Analytics
Does the solution provide an intuitive environment (e.g. spreadsheet) that
business users can quickly use? Does the solution include pre-built analytic
functions? Does the system provide a preview to validate analysis and show
data lineage for auditing data flows? Do data models have to be defined
before insights can be gained? Do analysts need to know what they want to
do before they have had a chance to look at the data? Or can analysts look at
the data, iterate, make the changes they need and analyze without involving
IT?
Visualizations
Does the solution support complete freeform visualization? Or is it just a
combination of reports and dashboards?
Integration with existing IT infrastructure
Does the solution support import from and export into other BI systems?
Administration
Does the system support flexible security integration with LDAP and
ActiveDirectory?
Extensibility
Does the solution support open API’s for custom data connections and
custom visualizations?
Architecture
Does the solution run natively on Hadoop? Is a separate cluster required
(ideally no separate cluster should be required)? Are there memory
constraints, or is the product limited by the availability of the memory within
the nodes? The ideal solution should have no memory constraints as that
limits the interactivity in analysis and leads to distortion of insights. Does the
solution provide a job planner and optimizer to ensure the lowest number of
MapReduce jobs is executed?
Vendor requirements
Is the system proven, does it have numerous major releases? How much is it in
enterprise use, has it analyze substantial data, (terabytes, petabytes or
exabytes)?
HOW TO SELECT THE RIGHT BIG DATA ANALYTICS SOLUTION
After working with hundreds of customers, we’ve found the following are the top
things to look for in a Big Data Analytics Solution.
DECISION CRITERIA FOR SELECTING
A BIG DATA ANALYTICS SOLUTION
29. 28
Identify
Use Cases
Create
Hypothesis
Find Insight
Show
Value to
Management
Iterate
Sharpen
Insight
Measure
& ROI
GETTING SUCCESSFUL WITH BIG DATA ANALYTICS
As you go through the steps of creating a successful project plan, IT and the Business
must work hand-in-hand.
Here is an overview of the Business and IT best practices. We’ll go into the Business best practices in more detail first and then the IT
best practices.
CREATING A SUCCESSFUL PROJECT PLAN
Business
Identify
the Team
Size
Hardware Train
Identify/
Ingest Data
Deploy
Disaster
Recovery
IT
31. 30
BEST PRACTICES FOR THE BUSINESS
IDENTIFY THE USE CASES AND THE TEAM
Are you trying to:
1. Optimize the funnel?
2. Perform behavioral analytics?
3. Perform customer segmentation?
4. Predict support issues?
5. Analyze credit risk?
6. Perform market basket analysis and
optimize pricing?
7. Automate support?
8. Detect and prevent security threats?
9. Detect and prevent fraud?
Identify the Use Cases
Who is the:
1. Budget owner?
2. Project manager?
3. Data owner?
4. Subject matter expert?
5. Business analyst and users?
Identify the Team
1. Tackle low hanging fruit first for
a quick win to show fast ROI
2. Choose the project that will
provide the biggest potential
value
Data Analyst Best Practices
32. 31
BEST PRACTICES FOR THE BUSINESS
BUDGET SO YOU CAN SELL INTERNALLY
To successfully sell internally, answer
the following questions:
What’s my total cost of ownership?
(Contact marketing@datameer.com for more information on this analysis).
Have I considered and budgeted for:
• People?
• Software Acquisition, Support?
• Hardware (Server, network)?
• Logistics (Hardware / people)?
• Operations/Data Center cost (power, cooling, etc.)?
It is critical to sell your project
internally not just at the beginning
of the project but continuously.
Especially as Big Data Analytics is new and top of mind for
many executives and management, selling internally will pay
off in the short and long term.
To sell internally, it will be important to:
Identify the sponsor
Build a business case
Define your metrics for success
Evangelize big data in business terms
Identify and communicate the risk of not doing big data
Show that the competition is already doing it
Start small, show the results fast
Communicate risks clearly
Demonstrate the use case through pilots
Involve the consumers of data, not just producers, early
33. 32
• Big Data Analytics gets better and more useful the more you use it.
So iterating has been critical to long term success for our customers.
• Start small and build on your success
• Don’t boil the ocean
BEST PRACTICES FOR THE BUSINESS
BIG DATA ANALYTICS IS AN ITERATIVE PROCESS
Analyze
Create your
hypothesis
Act on insight and
measure ROI
Visualize
35. Do I have an I/O or CPU intensive workload?
Do I really need to evaluate the Hadoop Distribution vendors?
Have I considered power consumption?
Have I considered cooling needs?
Have I considered the weight of hardware?
Does our data center support it?
Start with a small cluster. You can always buy more later.
Consider using a cloud provider like Amazon/Rackspace for fast provisioning
Time to insight matters more than time per query!
Hadoop does 3x data replication, no RAID needed
Hadoop stores intermediate results – leave twice as much storage headroom
as you want to analyze
IDENTIFY THE HARDWARE YOU NEED
BEST PRACTICES FOR IT
Master/Secondary Slaves
Network Application Server
• Fault Tolerant
• RAID
• Dual Network Power, etc.
• 4+ HDD
• 1 CPU core per HDD
• 2GB RAM/core
• 1GB fully unblocked network switches
• 10GB uplink for Top-of-Rack switches
• Dual Network Power, etc.
• 2 HDD’s
• 16GB RAM
34
Questions to ask: Best Practices:
36. 1. What data do I have available?
2. What’s missing that I’d like to use?
3. What data elements can I use to link this data with existing data?
4. Will the data be pushed or pulled into Datameer and Hadoop?
5. What is the performance expectation?
6. What type and level of security is needed? Are you looking for data masking or anonymization?
7. What is the data retention policy?
8. What is the data management strategy?
Answering the following will help identify and aggregate the right data sources
in particular:
BEST PRACTICES FOR IT
IDENTIFY AND AGGREGATE YOUR DATA SOURCES
35
37. 36
1. Convert your discovery into scheduled reports and run as needed
2. Measure your improvements
3. Continuously monitor results
4. Share and collaborate
Now that you have the insights, let’s automate the process and make creating
these impactful insights repeatable. To do that, the following are important to
incorporate into your plan.
BEST PRACTICES FOR IT
PUT YOUR PLAN IN ACTION & DEPLOY
Measure your
improvements
Convert your
discovery into
scheduled reports
Share and collaborate
Continuously
monitor results
38. 37
1. Set up workshops instead of lectures
2. Educate and empower users on their own data and systems
3. Encourage users to think outside the box
4. Enable users to access external data sources
5. Inspire them to be creative with data discovery
Enabling your organization, across the different functions and business
stakeholders, can be challenging. The following things have helped with the
customers we worked with:
BEST PRACTICES FOR IT
ENABLEMENT
39. Land and expand. Start small and go after the low hanging fruit. Then build upon
those successes to go broader.
A successful Big Data Analytics solution makes it easier and faster to analyze broader sets of data. You need a solution that:
CONCLUSION
KEY TAKEAWAYS
1
2
Is faster because it has fewer steps in the process.
Instead of hiring developers, ramping them up, defining, developing,
testing, deploying and then analyzing, you can start with defining and
analyzing.
Has fewer technical requirements
Instead of manually building capabilities for data loading, data parsing,
data analytics, data visualization, scheduling, dependency
management, data synchronization, monitoring API, management UI,
and security integration, you can have it all in one platform. Buying the
right solution also means you don’t have force fit a new technology
into old architecture.
3 Prebuilt integration, analytics, dashboards
Data integration – Quickly ingesting data from many different types of data
sources is critical to the success of a big data project. Eliminating the IT
intensive ETL and modeling processes is critical to allowing analysts to be able
to meaningfully interact with data and to prevent long and expensive waits while
data is prepared. To achieve this, a solution should have a large set of native
connectors for the integration of all types of disparate data — structured,
unstructured and semi-structured (e.g. databases, file systems, social media,
mainframe, SaaS applications, XML, JSON).
Analytics – Analysts need a tool to work with the data, turn it into a form that
can be usable and then perform the analysis. The means having pre built
transformations to clean up the data so that is usable as well as prebuilt
analytic functions. These functions should include ones to support unstructured
data and sentiment analysis. This tool should also provide a preview to validate
analysis and show data lineage for auditing data flows.
Visualization – Beyond static dashboards, analysts need Infographics
where data visualizations have no built-in constraints. Users need to be able to
drag and top any widget, graphic, text, dashboard or info graphic element as
needed or desired.
38
40. 39
STEFAN GROSCHUPF
CEO
FRANK HENZE
VP, Product Management
PETER VOSS
CTO
EDUARDO ROSAS
VP, Services
Stefan Groschupf is the co-founder
and CEO of Datameer, the only
end-to-end data integration, analysis
and visualization platform for big data
analytics on Hadoop.
Frank Henze is Vice President of
Product Management at Datameer with
over a decade of experience in building
enterprise software systems.
Peter Voss is CTO at Datameer with
extensive experience in software
engineering and architecture of
large-scale data processing.
Eduardo Rosas is VP of Services and
heads the implementation of Big Data
Analytics projects that triple customer
conversion rates, lead to over $20M in
additional revenue, and cut IT costs of
big data analytics projects in half.
KEN KRUGLER
President, Scale Unlimited
RON BODKIN
CEO, Think Big Analytics
JOE CASERTA
CEO, Caserta Concepts
PHIL SHELLEY
Former CTO, Sears
Consulting and training for big data
processing and web mining problems,
using Hadoop, Cascading, Cassandra
and Solr. Apache Software Foundation
member, committer for Tika open
source content extraction toolkit.
Ron founded Think Big to help
companies realize measurable value from
Big Data. Previously, Ron was VP
Engineering at Quantcast where he led
the data science and engineer teams that
pioneered the use of Hadoop and NoSQL
for batch and real-time decision making.
Joe Caserta is a veteran solution
provider, educator, and President of
Caserta Concepts, a specialized data
warehousing, business intelligence and big
data analytics consulting firm.
Dr. Shelley advises companies on
designing, delivering and operating
Hadoop-based solutions for Analytics,
Mainframe Migration and
massive-scale processing. He was
CTO at Sears Holdings Corporation
(SHC) and lead IT Operations
focusing on the modernization of IT
across the company.
You’re not alone!
Combining decades of experience in Hadoop, data management and business intelligence, there are people who have been working with customers around the
world, across industries such as Communications, Financial Services, Retail, Internet Security, Consumer Packaged Goods, Transportation, Logistics, and deep
into use cases such as fraud detection, behavioral analytics, customer segmentation, pricing optimization and credit risk analysis.
We are happy to help, so please reach out to the following experts with any questions or thoughts you might have. Also please send any questions, comments or
thoughts on this guide to khsu@datameer.com
RESOURCES
EXPERTS IN BIG DATA ANALYTICS