Downloaded 356 times

![RESEARCH BACKGROUND
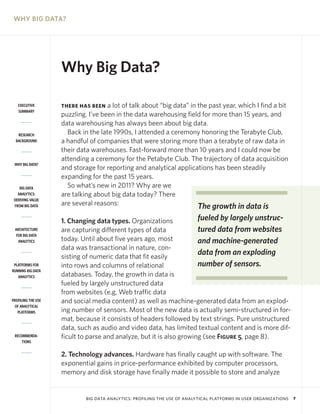
Research Background
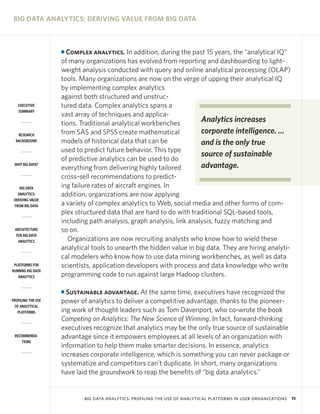
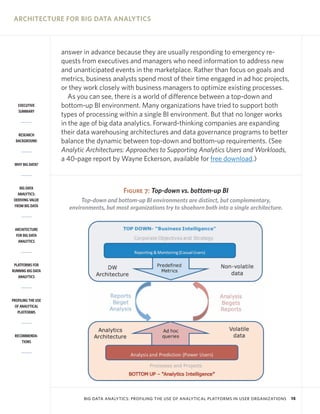
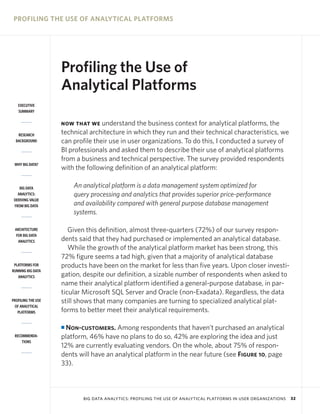
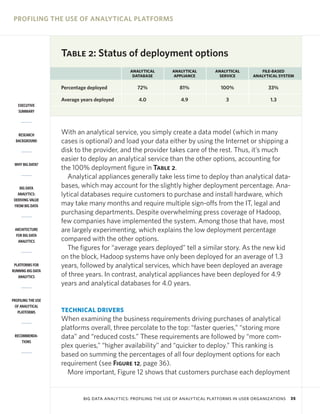
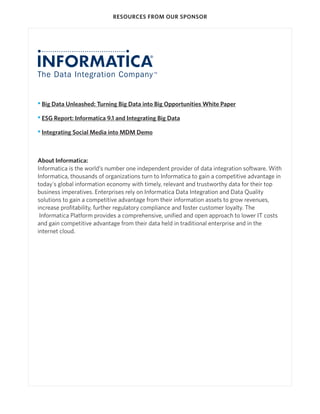
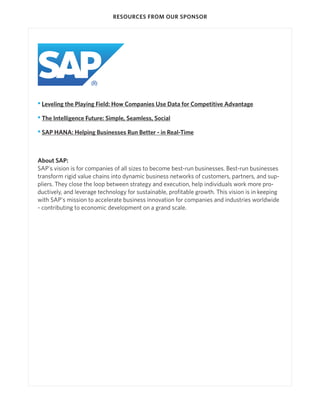
EXECUTIVE THE PURPOSE OF this report is to profile the use of analytical platforms in user
SUMMARY
organizations. It is based on a survey of 302 BI professionals as well as inter-
views with BI practitioners at user organizations and BI experts at consultan-
RESEARCH cies and software companies.
BACKGROUND
I Survey. The survey consists of 25 pages of questions (approximately 50
questions) with four branches, one for each analytical platform deployment
WHY BIG DATA?
option: analytical database (software-only),
analytical appliance (hardware-software
BIG DATA combo), analytical service and file-based
ANALYTICS: analytical system (e.g., Hadoop and [This report] is based
DERIVING VALUE
FROM BIG DATA NoSQL). Respondents who didn’t select an
option were passed to a fifth branch where on a survey of 302
they were asked why they hadn’t purchased BI professionals as
ARCHITECTURE an analytical platform and whether they well as interviews with
FOR BIG DATA
ANALYTICS planned to do so.
The survey ran from June 22 to August 2,
BI practitioners and
2011, and was publicized through several BI experts.
PLATFORMS FOR channels. The BI Leadership Forum and
RUNNING BIG DATA
ANALYTICS BeyeNetwork sent several email broadcasts
to their lists. I tweeted about the survey and
asked followers to retweet the announcement. Several sponsors, including
PROFILING THE USE Teradata, Infobright, and ParAccel, notified their customers about the survey
OF ANALYTICAL
PLATFORMS through email broadcasts and newsletters.
I Respondent profile. Survey respondents are generally IT managers based in
RECOMMENDA- North America who work at large companies in a variety of industries (see
TIONS
Figures 1-4, page 6). I
BIG DATA ANALYTICS: PROFILING THE USE OF ANALYTICAL PLATFORMS IN USER ORGANIZATIONS 5](https://image.slidesharecdn.com/bigdataanalyticsresearchreport-121101133118-phpapp01/85/Big-data-analytics-research-report-5-320.jpg)
![PROFILING THE USE OF ANALYTICAL PLATFORMS
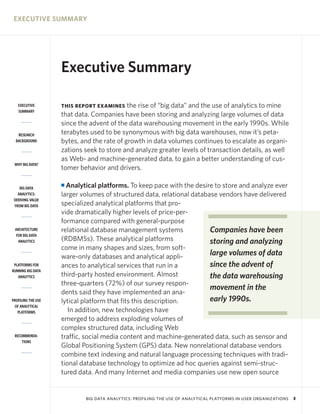
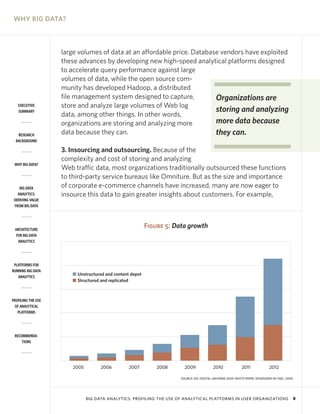
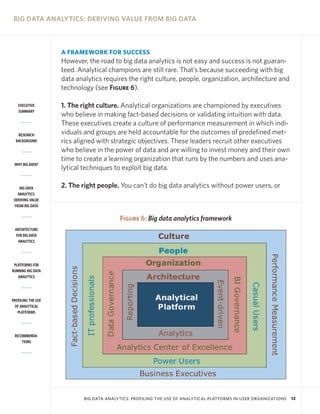
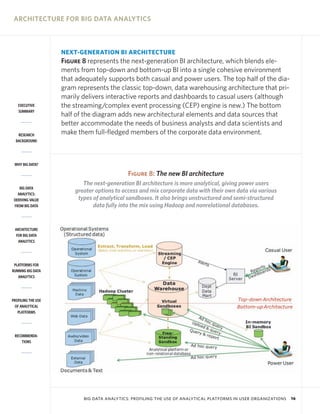
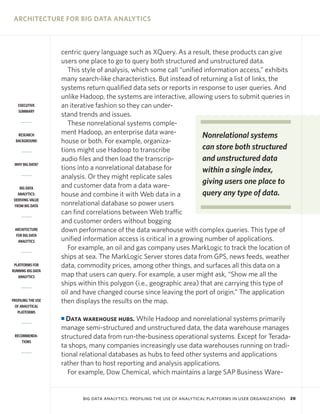
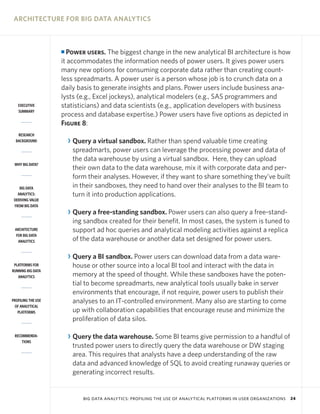
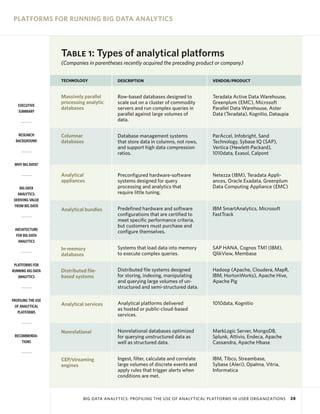
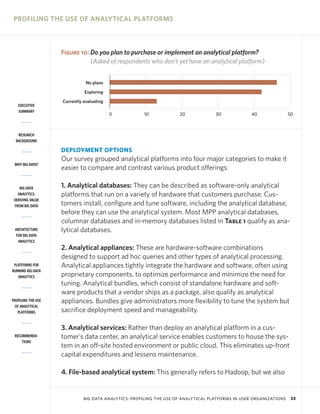
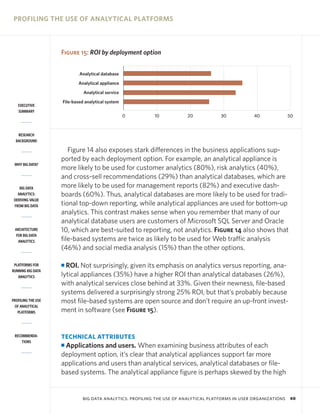
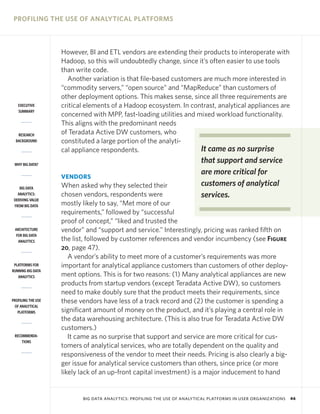
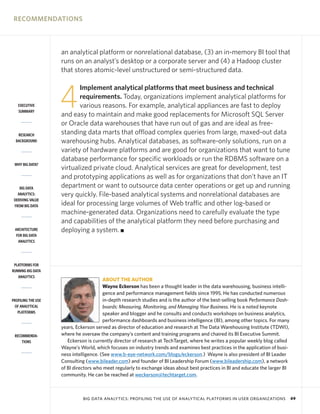
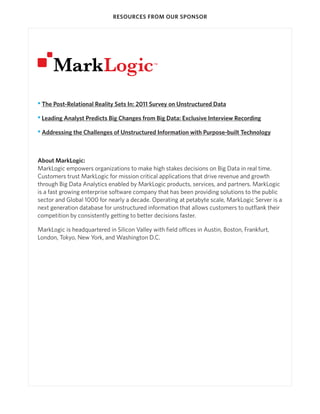
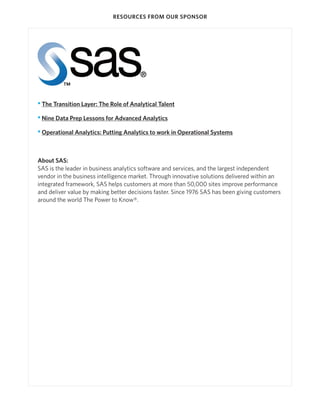
Figure 13: Were you explicitly looking for [this deployment option]?
(Percentages based on respondents who answered “Yes”)
Analytical database
Analytical appliance
Analytical service
EXECUTIVE
SUMMARY File-based analytical system
0 10 20 30 40 50 60
RESEARCH
BACKGROUND
and money.
“Agility and interoperability with existing technologies were key drivers for
WHY BIG DATA?
the customer,” said Rick Glick, vice president of customer and partner devel-
opment at ParAccel.
BIG DATA
ANALYTICS:
DERIVING VALUE
FROM BIG DATA
I Selection by category. We also asked respondents if they were looking for a
specific deployment option when evaluating products (see Figure 13). Except
for customers of file-based systems, most customers investigated products
ARCHITECTURE irrespective of its technology category. For example, Blue Cross Blue Shield of
FOR BIG DATA
ANALYTICS Kansas City looked at three columnar databases (i.e., software-only) and an
appliance before making a decision. Interestingly, no analytical service cus-
tomers intended to subscribe to a service prior to evaluating products. That’s
PLATFORMS FOR because many analytical service customers subscribe to such services on a
RUNNING BIG DATA
ANALYTICS temporary basis, either to test or prototype a system or to wait until the IT
department readies the hardware to house the system. Some of these cus-
tomers continue with the services, recognizing that they provide a more cost-
PROFILING THE USE effective test and development environment than an in-house system.
OF ANALYTICAL
PLATFORMS
BUSINESS APPLICATIONS
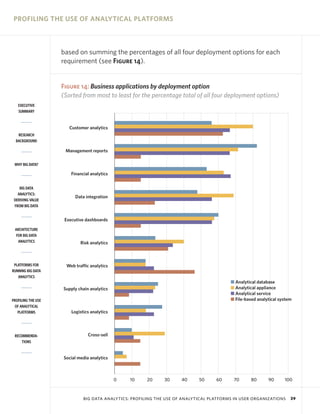
RECOMMENDA- When push comes to shove, the value of an analytical platform is judged not
TIONS
by its technical merits, but by the business applications it supports or makes
possible. The most popular business applications running on analytical plat-
forms are customer analytics, followed by management reports, financial ana-
lytics, data integration, executive dashboards and risk analytics. This ranking is
BIG DATA ANALYTICS: PROFILING THE USE OF ANALYTICAL PLATFORMS IN USER ORGANIZATIONS 38](https://image.slidesharecdn.com/bigdataanalyticsresearchreport-121101133118-phpapp01/85/Big-data-analytics-research-report-38-320.jpg)

This report examines the rise of big data and analytics used to analyze large volumes of data. It is based on a survey of 302 BI professionals and interviews. Most organizations have implemented analytical platforms to help analyze growing amounts of structured data. New technologies also analyze semi-structured data like web logs and machine data. While reports and dashboards serve casual users, more advanced analytics are needed for power users to fully leverage big data.


![Cmmi hm 2008 sepg model changes for high maturity 1v01[1]](https://cdn.slidesharecdn.com/ss_thumbnails/cmmihm2008sepgmodelchangesforhighmaturity1v011-150525024656-lva1-app6892-thumbnail.jpg?width=640&height=640&fit=bounds)
![Cmmi%20 model%20changes%20for%20high%20maturity%20v01[1]](https://cdn.slidesharecdn.com/ss_thumbnails/cmmi20model20changes20for20high20maturity20v011-150525024513-lva1-app6892-thumbnail.jpg?width=640&height=640&fit=bounds)


![Introduction to bayesian_networks[1]](https://cdn.slidesharecdn.com/ss_thumbnails/introductiontobayesiannetworks1-150525024327-lva1-app6891-thumbnail.jpg?width=640&height=640&fit=bounds)
![Workshop healthy ingredients ppm[1]](https://cdn.slidesharecdn.com/ss_thumbnails/workshophealthy-ingredientsppm1-150525024135-lva1-app6892-thumbnail.jpg?width=640&height=640&fit=bounds)


