Downloaded 173 times
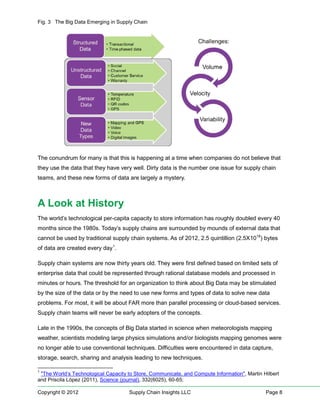
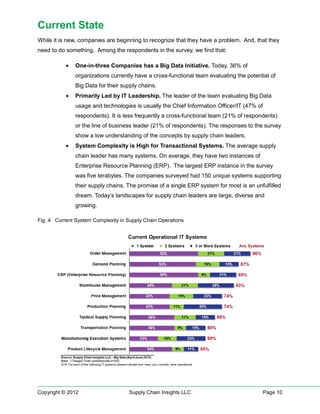


This document discusses the challenges and opportunities presented by big data for supply chain leaders, emphasizing that big data is a revolutionary shift rather than an evolution. It defines big data in the context of supply chains and highlights the need for leaders to understand and leverage these concepts to solve existing problems. The report draws on insights from industry leaders and a quantitative survey, revealing a low understanding of big data concepts among supply chain professionals.


![Space mouse[1]](https://cdn.slidesharecdn.com/ss_thumbnails/spacemouse1-170302013457-thumbnail.jpg?width=640&height=640&fit=bounds)