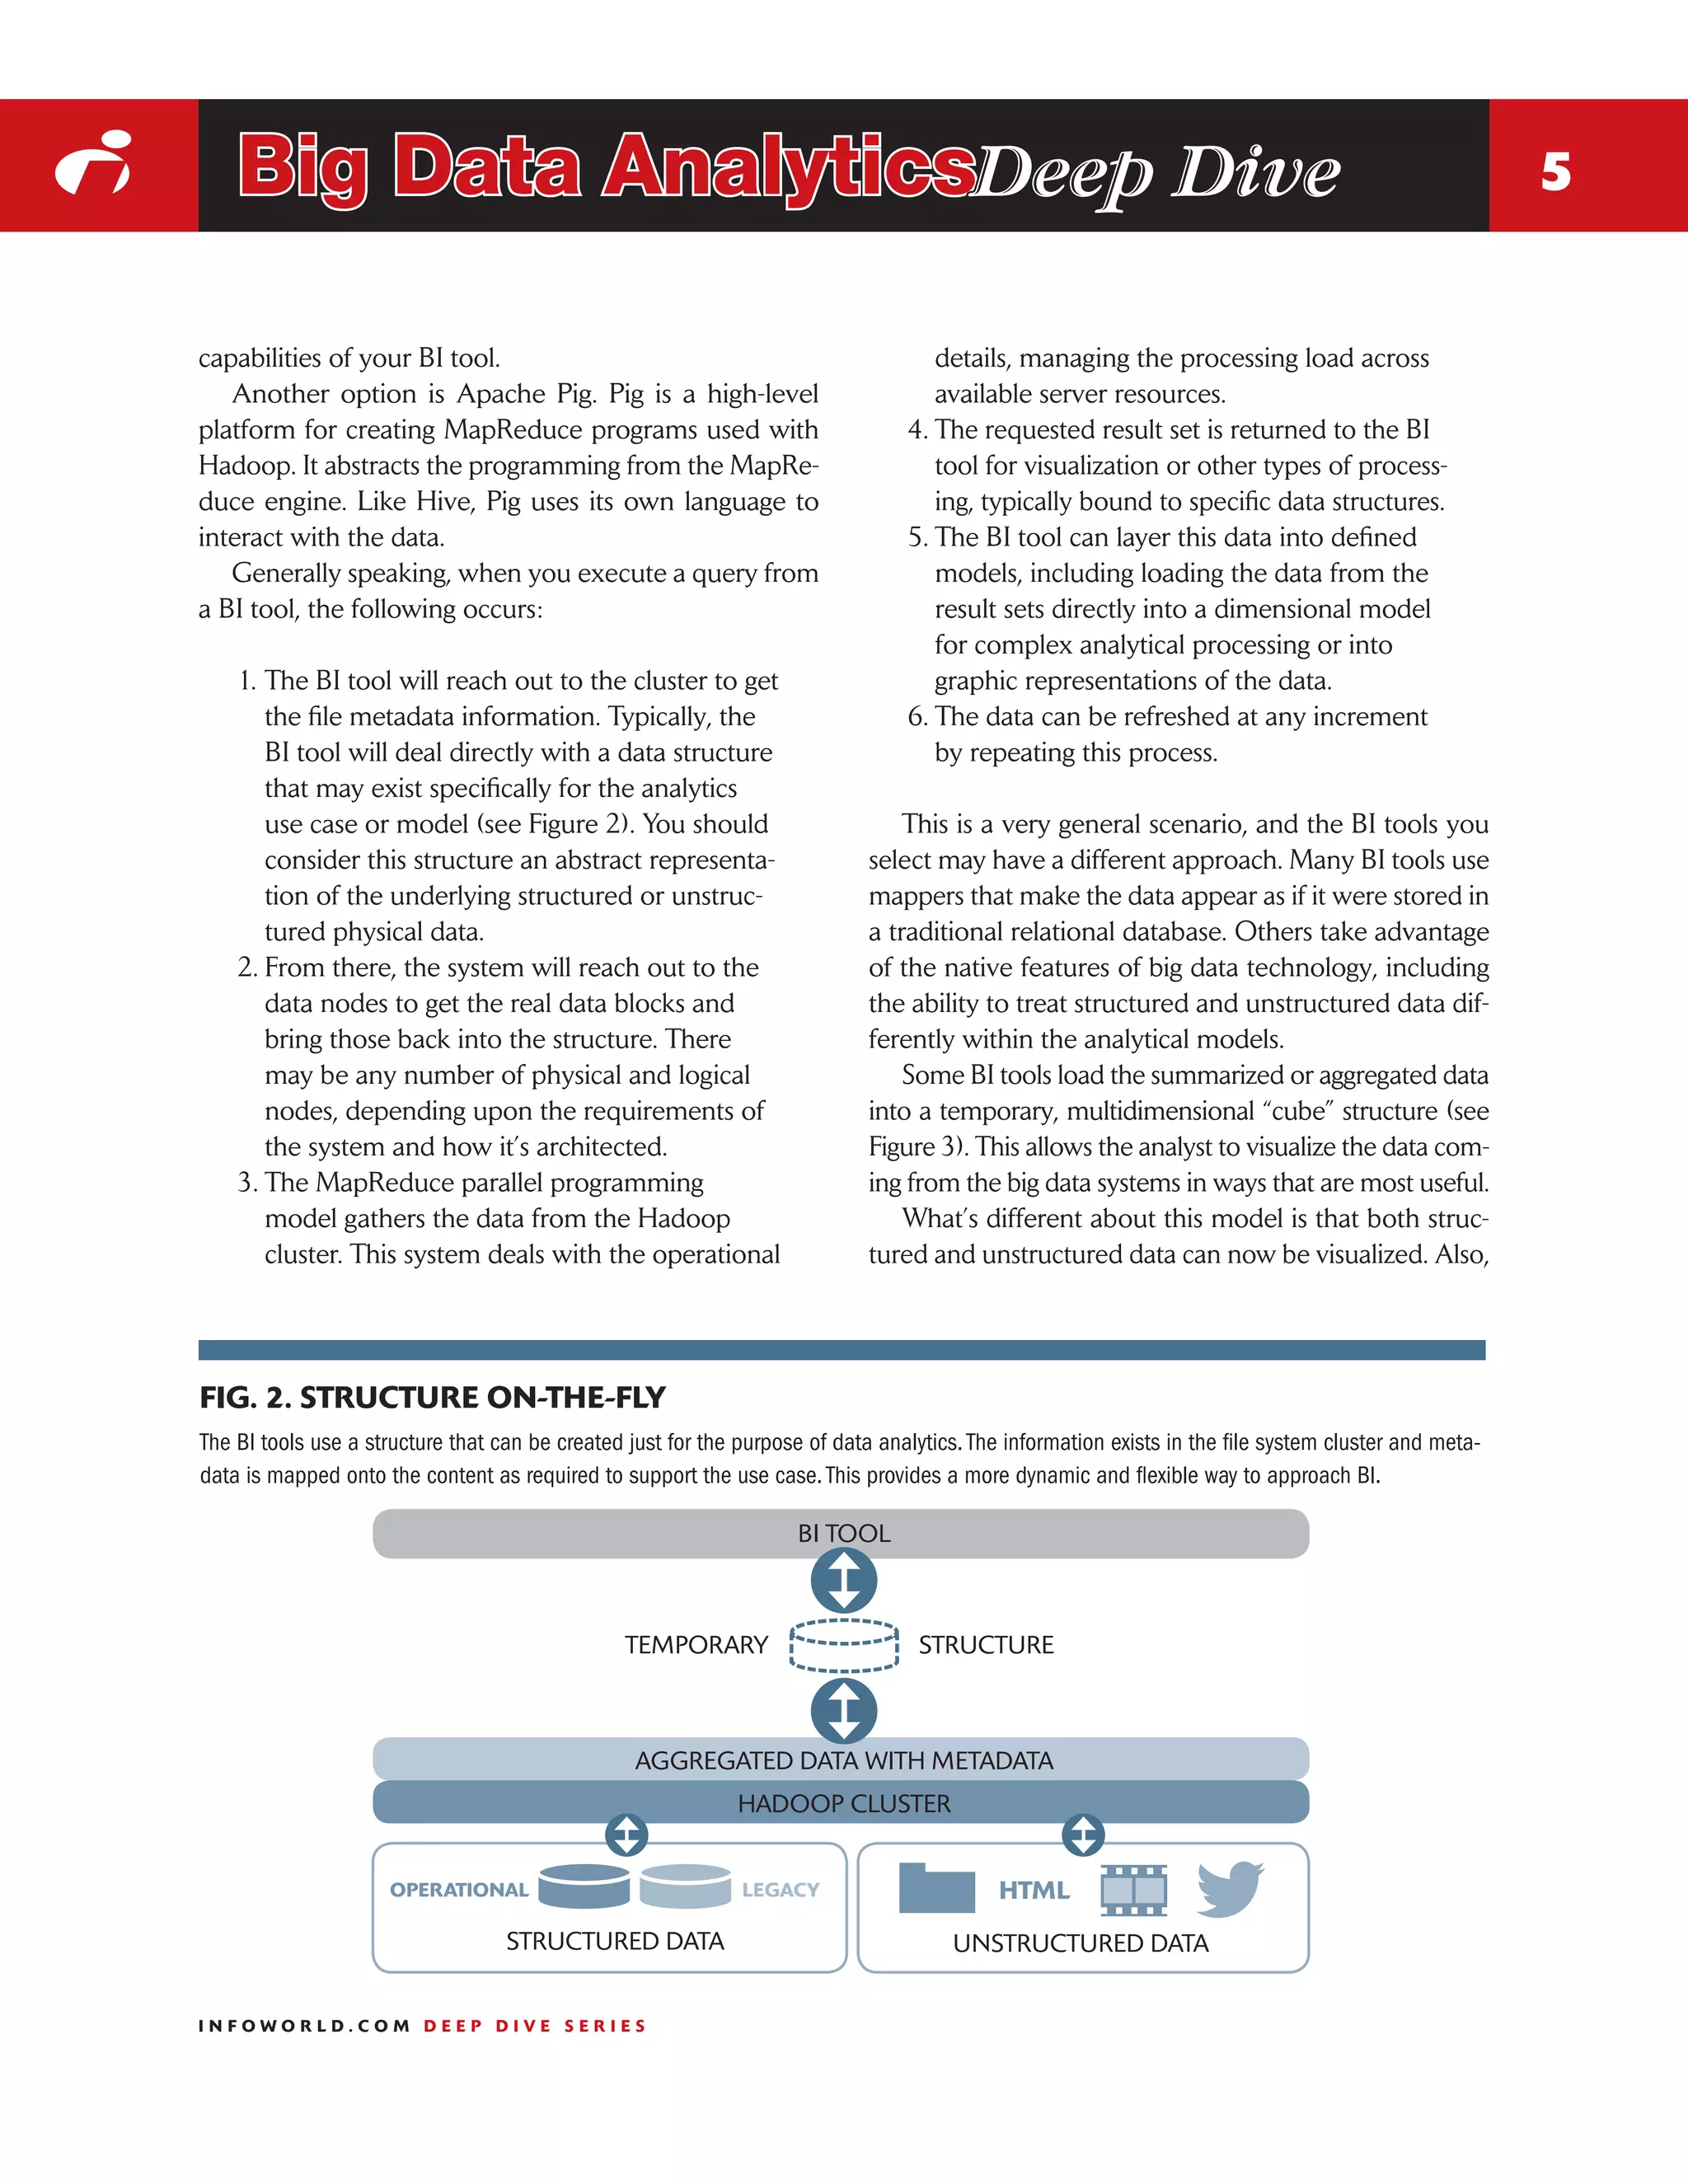
Big data analytics enables organizations to derive meaningful insights from large volumes of structured and unstructured data. New tools can analyze petabytes of data across various formats and identify patterns and trends. This helps optimize processes, reduce risks, and uncover new opportunities. Examples include detecting healthcare treatment patterns that improve outcomes, preventing bank fraud, and predicting consumer demand to inform utility planning. While big data is still emerging, it has potential to enhance business intelligence and integrate diverse internal and external data sources for more powerful analytics.
Companies from across sectors are experiencing exponential growth in data as social interactions, rich media and a variety of devices generate new content. A tidal wave... of digital data is getting created through emails, instant messaging, survey videos, images, RFID tags, web text, blogs, geo-location devices, collaboration platforms like Twitter and Facebook, and so many other sources.
Who needs Big Data? What benefits can organisations realistically achieve with Big Data? What else required for success? What are the opportunities for players in this space? In this paper, Cartesian explores these questions surrounding Big Data.
www.cartesian.com
With many organisations considering getting on the Hadoop bandwagon, this document provides an overview of the planned use cases for Hadoop, an illustration of some of the common technology components, suggestions on when Hadoop is worth considering, some the challenges organisations are experiencing, cost considerations and finally, how an organisation should position for a Big Data initiative. Any organisation considering a Big Data initiative with Hadoop should thoroughly consider each of these areas before embarking on a course of action.
Scaling the mirrorworld with knowledge graphsAlan Morrison
After registration at https://www.brighttalk.com/webcast/9273/364148, you can view the full recording, which begins with Scott Abel's intro for a few minutes, then my talk for 20 minutes, and then Sebastian Gabler's. First presented on October 23 at an SWC webinar.
Conclusions:
(1) The mirrorworld (a world of digital twins, which will be 25 years in the making, according to Kevin Kelly) will require semantic knowledge graphs for interaction and interoperability.
(2) This fact implies massive future demand for knowledge graph technology and other new data infrastructure innovations, comparable to the scale of oil & gas industry infrastructure development over 150 years.
(3) Conceivably, knowledge graphs could be used to address a $205 billion market demand by 2021 for graph databases, information management, digital twins, conversational AI, virtual assistants and as knowledge bases/accelerated training for deep learning, etc. but the problem is that awareness of the tech is low, and the semantics community that understands the tech is still quite small.
(4) Over the next decades, knowledge graphs promise both scalability and substantial efficiencies in enterprises. But lack of awareness of its potential and how to harness it will continue to be stumbling blocks to adoption.
Big Data Impact on Purchasing and SCM - PASIA World Conference DiscussionBill Kohnen
The volume, velocity and variety of data available is almost unthinkable. 90% of the world’s data is less than 2 years old, we are able analyze less than 5% of it and 80% of what people generally are looking at is less than 6 weeks old. Harnessing this data for effective decision making is a goal for organizations worldwide and has created a 50Billion dollar industry to provide tools and consulting.
Even before “Big Data” Purchasing groups were swimming in data and struggled to put it to effective use. The success of Strategic Sourcing methodology had the effect of also identifying and standardizing the types and format of information that can be used to drive improvement.
This discussion will connect how big data sources and methodology can be used to develop specific and relevant spend analytics. Also presented will be an illustration of how you can use data and tools you already have - to get immediate results and make you better prepared to evaluate the need for more powerful analytic tools.
Finally will conclude with comments on how Big Data along with other disruptive digital trends will create a new required skill sets for Purchasing and Supply Chain Professionals and are transform how operate all ready.
LEVERAGING CLOUD BASED BIG DATA ANALYTICS IN KNOWLEDGE MANAGEMENT FOR ENHANCE...ijdpsjournal
In recent past, big data opportunities have gained much momentum to enhance knowledge management in
organizations. However, big data due to its various properties like high volume, variety, and velocity can
no longer be effectively stored and analyzed with traditional data management techniques to generate
values for knowledge development. Hence, new technologies and architectures are required to store and
analyze this big data through advanced data analytics and in turn generate vital real-time knowledge for
effective decision making by organizations. More specifically, it is necessary to have a single infrastructure
which provides common functionality of knowledge management, and flexible enough to handle different
types of big data and big data analysis tasks. Cloud computing infrastructures capable of storing and
processing large volume of data can be used for efficient big data processing because it minimizes the
initial cost for the large-scale computing infrastructure demanded by big data analytics. This paper aims to
explore the impact of big data analytics on knowledge management and proposes a cloud-based conceptual
framework that can analyze big data in real time to facilitate enhanced decision making intended for
competitive advantage. Thus, this framework will pave the way for organizations to explore the relationship
between big data analytics and knowledge management which are mostly deemed as two distinct entities.
Virtual Data Steward: Data Management 3.0CrowdFlower
Every company that is serious about data governance needs data stewards. Data stewards connect business information requirements and processes with information technology capabilities. This function is essential to bridging data management policies and standards to day-to-day operational practices.
Becoming an analytics-driven organization helps companies reduce costs, increase
revenues and improve competitiveness, and this is why business intelligence and
analytics continue to be a top priority for CIOs. Many business decisions, however,
are still not based on analytics, and CIOs are looking for ways to reduce time to value
for deploying business intelligence solutions so that they can expand the use of
analytics to a larger audience of users.
Companies are also interested in leveraging the value of information in so-called big
data systems that handle data ranging from high-volume event data to social media
textual data. This information is largely untapped by existing business intelligence
systems, but organizations are beginning to recognize the value of extending the
business intelligence and data warehousing environment to integrate, manage, govern
and analyze this information.
Data Analytics has become a powerful tool to drive corporates and businesses. check out this 6 Reasons to Use Data Analytics. Visit: https://www.raybiztech.com/blog/data-analytics/6-reasons-to-use-data-analytics
Booz Allen Hamilton uses its Cloud Analytics Reference Architecture to build technology infrastructures that can withstand the weight of massive datasets – and deliver the deep insights organizations need to drive innovation.
Top 10 guidelines for deploying modern data architecture for the data driven ...LindaWatson19
Enterprises are facing a new revolution, powered by the rapid adoption of data analytics with modern technologies like machine learning and artificial intelligence (A).
Data Mining: The Top 3 Things You Need to Know to Achieve Business Improvemen...Dr. Cedric Alford
While companies have been using various CRM and automation technologies for many years to capture and retain traditional business data, these existing technologies were not built to handle the massive explosion in data that is occurring today. The shift started nearly 10 years ago with expanding usage of the internet and the introduction of social media. But the pace has accelerated in the past five years following the introduction of smart phones and digital devices such as tablets and GPS devices. The continued rise in these technologies is creating a constant increase in complex data on a daily basis.
The result? Many companies don't know how to get value and insights from the massive amounts of data they have today. Worse yet, many more are uncertain how to leverage this data glut for business advantage tomorrow. In this white paper, we will explore three important things to know about big data and how companies can achieve major business benefits and improvements through effective data mining of their own big data.
Dr. Cedric Alford provides a roadmap for organizations seeking to understand how to make Big Data actionable.
In this document, the five disruptive trends shaping the corporate IT landscape today are layed out. Out of the five, Big Data has the biggest potential to generate new sustainable competitive advantages. But the benefits will remain out of reach of many organizations as they struggle to adopt the technology, develop new capabilities, and manage the cultural change associated with the use of big data. This document offers a pragmatic approach to generating business value.
Project 3 – Hollywood and IT· Find 10 incidents of Hollywood p.docxstilliegeorgiana
Project 3 – Hollywood and IT
· Find 10 incidents of Hollywood portraying IT security incorrectly
· You can use movies or TV episodes
· Write 2-5 paragraphs for each incident. Use supporting citations for each part.
· What has Hollywood portrayed wrong? Describe the scene and what is being shown. Make sure to state whether it is partially wrong or totally fictitious.
· How would you protect/secure against what they show (answers might include install firewall, load Antivirus etc.)
· Use APA formatting for your sources on everything.
· Make sure to put your name on assignment.
Big Data and Social Media
Colgate Palmolive
Agenda Of socail media use
Buisness intellegence and Social media concenpts
Intellegent organization
Data Anaylysis and Data trustworthiness
Conclusion
Buisness intellegence and Social media concenpts
No-Hassle Documentation
Gain Trusted Followers
Spy on Competition
Learn Customer Demographics
Research and Analyze Events
Advertise More Accurately
Intellegent organization
They consistently use (big) data proactively
They know exactly where they want to go: all-round vision
They continuously discuss business matters: alignment
They talk to each other regarding positive and negative performance
They know their customers through and through
They think and work in an agile way
Data Anaylysis and Data trustworthiness
Data completeness and accuracy
Data credibility
Data consistency
Data processing and algorithms
Data Validity
Conclusion
How Colgate benefit from Big Data and Social Media
Social media increases sales and customers
Big data shows popular trends and popular companies
All around they are both beneficial
Big Data can find trends that can benefit you greatly
Criteria
Title Page:
Name, Contact info, title of Presentation
Slide 1
Adenda : Topic you going to cover in order
Slide 2
Discuss how big data, social media concepts and knowledge to successfully create business intellegence (Support your bullets points with data, analysis, charts)
Slide 3
Describe how big data can be used to build an intelligent organization
Slide 4
Discuss the importance of data source trustworthiness and data analysis
Slide 5
Conclusion
Slide 6
Big Data And Business Intelligence
Business Value With Big Data
For business to survive in a competitive environment, organizational change requires improved governance, sponsorship, processes, and controls, in addition to new skill sets and technology all work in harmony to deliver the benefits of big data. See Fig. 13.2
Data science has taken the business world by storm. Every field of study and area of business has been affected as companies realize the value of the incredible quantities of data being generated. But to extract value from those data, one needs to be trained in the proper data science skills. The R programming language has become the de fac to programming language for data science. Its flexibility, power, sophistication, and expressiveness have ma ...
EDF2013: Invited Talk Julie Marguerite: Big data: a new world of opportunitie...European Data Forum
Invited Talk Julie Marguerite, THALES, at the European Data Forum 2013, 9 April 2013 in Dublin, Ireland: Big data: a new world of opportunities for software services
Big Data is Here for Financial Services White PaperExperian
Conquering Big Data Challenges
Financial institutions have invested in Big Data for many years, and new advances in technology infrastructure have opened the door for leveraging data in ways that can make an even greater impact on your business.
Learn how Big Data challenges are easier to overcome and how to find opportunities in your existing data and scale for the future.
2. i Big Data AnalyticsDeep Dive 2
Making sense of big data
New analysis tools and abundant processing power unlock critical insights from
unfathomable volumes of corporate and external data
i By David S. Linthicum analyzed over time, reduce the incidence of failure. Data
on the vital signs of infants in hospital nurseries could be
THE ABILITY TO DERIVE MEANING quickly from plumbed for patterns that reveal hazards or new oppor-
huge quantities of structured and unstructured data has tunities for progress. The use cases are limited only by
been an objective of enterprise IT since the inception of the imagination:
databases. In the past, this has been a distant dream — or
at least a cost-prohibitive one. • A bank visualizes patterns within data and docu-
Today we have a growing number of technologies that ments that determine the likelihood of fraud and
make that dream a reality. Cloud computing provides can take corrective action before the business is
per-drink access to thousands of processor cores and impacted.
massive amounts of on-demand data storage. Emerging • Doctors determine patterns of treatment of dis-
technologies apply a divide-and-conquer approach to eases that provide the most desirable outcomes
big data computing problems, using distributed process- using 20 years of historical data from more than
ing to return results almost instantaneously from huge 30 different data sources.
data sets. • Auto manufacturers see the core cause of
New analytics tools take advantage of all this horse- production delays, and perhaps attach these
power. Advanced data visualization technology makes analytics to business processes to automatically
large and complex data sets understandable and enables take corrective action, such as leveraging different
domain experts to spot underlying trends and patterns. logistical approaches.
Some tools even recognize patterns and alert users about • The utility industry creates predictive models
issues that need attention. of consumer markets by deploying technologies
Big data is riding a sharp growth curve. IDC predicts such as a smart grid.
big data technology and services will grow worldwide
from $3.2 billion in 2010 to $16.9 billion in 2015. This With the proper data visualization on top, big data can
represents a compound annual growth rate of 40 per- shortcut the usual process of business analytics, where
cent — about seven times that of the overall information stakeholders pass requirements to analytics profession-
and communications technology market. als who create static reports and hand them back over
the transom. Big data visualization — even a simple tag
cloud — enables those with domain expertise to develop
MAKING THE BUSINESS CASE a more direct relationship with the data and spot pat-
The business benefits are clear. On the one hand, we terns that an analytics professional might miss.
can derive meaning from data that once merely took up Despite all the promise, big data technology and
space — website clickstream data, system event logs, and applications are still very much at an early stage. Hadoop
so on — and use that information to improve a broad has become the preferred platform for processing large
range of systems. A whole new world of vertical appli- quantities of unstructured data, but it’s a distributed pro-
cations opens up. cessing framework and development environment that
What sort of applications? How about sensor data typically requires specialized application development
collected on jet engine performance that could, when skills to use effectively. And that’s just for unstructured
INFOWORLD.COM DEEP DIVE SERIES
3. i Big Data AnalyticsDeep Dive 3
or semi-structured data. Big data can also refer to quan- Big data analytics enables better analytical insights by
tities of structured data so large they can’t be processed integrating massive amounts of data of varying complex-
in a reasonable length of time. ity, formats, and timeliness into one structured output.
The larger question is how big data analytics fit into Combining text, voice, streaming data, and unstructured
companies that already have a business analytics infra- data analytics into one structure allows businesses to
structure. In many cases, exploring large unstructured harness the different views of related information into
data sets is a precursor to drilling deep with more con- dynamic analytical models. These models support mul-
ventional tools. tidimensional metrics that can be leveraged with tradi-
tional analytics.
BULKING UP BUSINESS INTELLIGENCE BI tools are still evolving to support this approach to
Gartner reports that 45 percent of sales management big data analytics. They provide better data visualization
teams identify sales analytics as a priority to help them capabilities that take into account the use of near-real-
understand sales performance, market conditions, and time information and the widening range of structured
opportunities. In short, the better that information is — and unstructured data. To put it simply, if it exists in any
and the more routinely it is put in the hands of those electronic format, chances are it can be analyzed.
who need it — the greater likelihood productivity and
revenue will increase. REACHING OUT TO THE CLOUD
A few key trends within BI relate to the emerging use One of the more exciting areas of big data involves data
of big data. They include: sources that are related to your business but were not
collected or stored by the business itself. On a simple
• The ability to leverage both structured and level, this might entail mashing up your existing sales
unstructured data, and visualize that data together trends with key economic data — or, as is in vogue now,
as a single, logical set of information. data about trending topics on social networking sites.
• The ability to imply structure at the time of analy- Indeed, social content is the fastest-growing category of
sis, and thus provide flexibility by decoupling the new content in the enterprise and will eventually attain 20
underlying structure from structured or unstruc- percent market penetration. Gartner defines social con-
tured physical data. tent as unstructured data created, edited, and published
• The ability to leverage current, or near-real-time on corporate blogs and communication and collaboration
data, allowing critical applications, business pro- platforms, along with such commercial platforms as Face-
cesses, and humans to view the up-to-the-minute book, LinkedIn, Twitter, YouTube, and more.
state of the data. Companies now specialize in providing this data on
• The ability to access outside data sources in the demand for use within enterprise BI, including the larger
cloud, thus allowing BI analysts to mash up data IaaS and PaaS cloud computing providers such as Google
from outside of the enterprise to enhance or and Amazon Web Services. Indeed, the growth of data
refine the data analysis process. providers offering big data analytics services should only
• The ability to bind data analytics to business pro- increase as BI professionals and their stakeholders under-
cesses and applications, and thus allow them to stand the value it offers.
automatically deal with issues and opportunities Finally, there’s the ability to close the loop. More
without human intervention. and more automated systems will be able to bind big
data analytics to business processes, allowing opera-
Traditional BI is based on structured data, but these tional systems to react to various thresholds in near-real
insights often fall short in predictive and indicative analyt- time. This is known as embedded analytics, and may be
ics, due to data sets that are too old or limited in scope. created programmatically, or configured and exposed
Structured data is only a small portion of stored business from within tools that support such services. Business
data. Indeed, many analysts estimate that structured data examples include analyzing real-time delivery metrics
accounts for only 5 percent of total enterprise data. and rerouting orders to suppliers that have better track
INFOWORLD.COM DEEP DIVE SERIES
4. i Big Data AnalyticsDeep Dive 4
records, or automatically adjusting production schedules • Legacy unstructured data, such as older
based upon predictive sales trends that leverage known text-based databases
correlations with key predictive data.
So how does this work? The unstructured and struc-
tured data is gathered into a file system (e.g., Hadoop
MORE DATA SOURCES, Distributed File System, or HDFS). The data is stored in
MORE POSSIBILITIES blocks on the various nodes in the Hadoop cluster (see
A key challenge for big data analytics is the sheer pro- Figure 1). The file system creates many replications of
liferation of data sources that may or may not have the data blocks, distributing them in the cluster in reliable
structure. We aggregate these data sources around an ways that can be retrieved faster. Block sizes may vary,
implied structure created for the purpose of the data but a typical HDFS block size is 128MB, and is replicated
query and then present this structure to either a data to multiple nodes across the cluster.
analytics API or service, or to a BI tool for the purposes We deal only with files, which means the content
of data visualization or other types of interactive analyt- does not adhere to a structure before it exists in the file
ics (see Figure 1). system. Data maps are then applied over the unstruc-
Remember that the prevailing trend is to study a mix tured content to define the core metadata for that con-
of structured and unstructured data. The unstructured tent. They may be mapped and remapped any number
data may come from a variety of sources, including: of times to support the changing metadata requirements
of the analytical tools or others who leverage the data.
• Web pages In some instances, Hadoop Hive is employed. Hive is
• Video and sound files a data warehouse system that provides data summariza-
• Documents tion, ad-hoc queries, and analysis of large datasets stored
• Social media APIs or services that provide in the Hadoop cluster. Hive provides a mechanism to
trending data project structure onto this data and to query the data
• External data sources, such as data services pro- using a SQL-like language called HiveQL. The interface
vided by IaaS and PaaS cloud computing players depends on your requirements and the data integration
FIG. 1. MAKING SENSE OF DATA
Big data analytics uses both structured and unstructured data and returns results to the BI tool in a matter of seconds. You can employ BI tools
to analyze the data visually or as embedded analytics in an enterprise application or business process using a data analytics API or service.
ENTERPRISE APPLICATIONS
HUMAN USER
BUSINESS PROCESSES
DATA
SECURITY BI TOOLS DATA ANALYTICS API GOVERN-
ANCE
AGGREGATED DATA
HADOOP CLUSTER
OPERATIONAL LEGACY
STRUCTURED DATA UNSTRUCTURED DATA
INFOWORLD.COM DEEP DIVE SERIES
5. i Big Data AnalyticsDeep Dive 5
capabilities of your BI tool. details, managing the processing load across
Another option is Apache Pig. Pig is a high-level available server resources.
platform for creating MapReduce programs used with 4. The requested result set is returned to the BI
Hadoop. It abstracts the programming from the MapRe- tool for visualization or other types of process-
duce engine. Like Hive, Pig uses its own language to ing, typically bound to specific data structures.
interact with the data. 5. The BI tool can layer this data into defined
Generally speaking, when you execute a query from models, including loading the data from the
a BI tool, the following occurs: result sets directly into a dimensional model
for complex analytical processing or into
1. The BI tool will reach out to the cluster to get graphic representations of the data.
the file metadata information. Typically, the 6. The data can be refreshed at any increment
BI tool will deal directly with a data structure by repeating this process.
that may exist specifically for the analytics
use case or model (see Figure 2). You should This is a very general scenario, and the BI tools you
consider this structure an abstract representa- select may have a different approach. Many BI tools use
tion of the underlying structured or unstruc- mappers that make the data appear as if it were stored in
tured physical data. a traditional relational database. Others take advantage
2. From there, the system will reach out to the of the native features of big data technology, including
data nodes to get the real data blocks and the ability to treat structured and unstructured data dif-
bring those back into the structure. There ferently within the analytical models.
may be any number of physical and logical Some BI tools load the summarized or aggregated data
nodes, depending upon the requirements of into a temporary, multidimensional “cube” structure (see
the system and how it’s architected. Figure 3). This allows the analyst to visualize the data com-
3. The MapReduce parallel programming ing from the big data systems in ways that are most useful.
model gathers the data from the Hadoop What’s different about this model is that both struc-
cluster. This system deals with the operational tured and unstructured data can now be visualized. Also,
FIG. 2. STRUCTURE ON-THE-FLY
The BI tools use a structure that can be created just for the purpose of data analytics. The information exists in the file system cluster and meta-
data is mapped onto the content as required to support the use case. This provides a more dynamic and flexible way to approach BI.
BI TOOL
TEMPORARY STRUCTURE
AGGREGATED DATA WITH METADATA
HADOOP CLUSTER
OPERATIONAL LEGACY
STRUCTURED DATA UNSTRUCTURED DATA
INFOWORLD.COM DEEP DIVE SERIES
6. i Big Data AnalyticsDeep Dive 6
new and expanded analysis may be creatively derived of their business with greater detail and accuracy, includ-
from the availability of this data, such as: ing the productivity of their business processes. Analytics
coupled with data visualization shine a bright light on
• Reporting or descriptive analytics areas where business processes fall short.
• Modeling or predictive analytics For example, using data visualization, a business can
• Clustering zoom in on the process of recording a sale and process-
• Affinity grouping ing it for shipping and explore the relationship between
that business process and customer satisfaction. Optimiz-
What’s most important about big data analytics is the ing that process seldom fails to increase repeat business.
new mindset that is emerging. We now consider most
data as something to be explored by anyone who needs USE CASE: BUSINESS-CRITICAL
to explore it. We’re moving away from a limited view of APPLICATION AUGMENTATION
our own business data. Moreover, our analytical mod- Embedded big data analytics coupled with operational enter-
els, such as predictive modeling, provide better results prise applications can deliver enormous business value. For
because the data is more complete. example, a company could augment a shipping application
with analytical information about on-time delivery records
culled from perhaps terabytes of PDF shipping records gath-
BIG DATA VISUALIZATION AND ered over the years. That data might also be mashed up
ANALYSIS USE CASES with information from outside sources such as complaints
Within vertical industries, interest in big data is high, but the recorded in social media or blogs.
degree of knowledge and investment varies widely (see Figure
4). Health care, transportation, and education lead the pack. USE CASE: IMPROVING HEALTH CARE
TREATMENT AND OUTCOMES
USE CASE: BUSINESS PROCESS IMPROVEMENT There is much low-hanging fruit when it comes to
Big data analytics enable companies to examine the state the business value of big data analytics in health care;
FIG. 3. DIMENSIONS
BI TOOL
OF DATA MULTI-
DATA VISUALIZATION
BI tools employ a range of analytical DIMENSIONAL
20s
DATA
models and structures to analyze 30s
big data. In this case the data is 40s
loaded into a multidimensional MINIVAN TWITTER
temporary model where it may be COUPE FACEBOOK
visualized in any number of ways. SEDAN YOUTUBE
PRODUCTS SOCIAL DATA CUSTOMER AGES
AGGREGATED DATA
HADOOP CLUSTER
OPERATIONAL LEGACY
STRUCTURED DATA UNSTRUCTURED DATA
INFOWORLD.COM DEEP DIVE SERIES
7. i Big Data AnalyticsDeep Dive 7
however, the best use case is in patient diagnosis and media systems, as compared to patterns around the
treatment. The health care system stores our informa- success of products sold in the past, as compared to
tion in different places using different formats, which has weather patterns that may affect the use of the product
made it difficult or impossible to analyze this data as a (say, a down coat in a very cold winter). The idea is to
single cluster of information. provide those who make critical decisions in the retail
With big data analytics, we now can gather all struc- space with the means to slice and dice all the relevant
tured and unstructured health care data and place this data to determine which products to advertise, discount,
content in a single cluster for analysis by a BI tool. This or display adjacent to other products.
improves health care professionals’ ability to determine
patterns of treatment success by analyzing holistic patient USE CASE: IMPROVING
data and treatments that lead to the desired outcome. TRANSPORTATION SYSTEMS
Transportation systems depend on efficiencies. For
USE CASE: IMPROVING example, airlines need to select the best and most prof-
RETAIL BUSINESS PERFORMANCE itable routes. Using big data analytics, they can predict
Retail businesses depend on an in-depth understand- the profitability of those routes by leveraging historical
ing of specific markets and customers to gain com- data visualized with key predictive metrics applied to
petitive advantage. Here, big data analytics has huge data gathered from external sources.
potential value, allowing those who drive the BI tools to Big data analytics allows airlines to gather years and
create models that determine the success of a product years of flight data from the government, including point
based upon predictive data points gathered from huge of origin, number of passengers, on-time records, etc..
amounts of unstructured data. They can then look at this data with known pricing
This data may include demographics information information from other carriers. Add in predictive data,
around the existing customer base, as compared to the the number of times the destination appeared in Web
number of times the product is mentioned within social searches over the past several years, and the number of
FIG. 4. Has your organization already invested in technology specifically designed
to address the big data challenge?
According to Gartner, almost all verticals are investing in big data analytics, with transportation, education, and health care leading the way.
Yes No, but plan to within a year No, but plan to within two years No plans Don’t know
Education 39% 17%
17% 39% 0%
Retail 29% 12% 29% 29% 12%
Transportation 36% 11% 21% 36% 4%
Health care 36% 15% 15% 36% 9%
Communications, Media, Services 25% 20% 15% 25% 10%
Insurance 21% 18% 21% 21% 5%
Energy, Utilities 31% 17%
11% 31% 14%
Banking 22% 12% 18% 22% 18%
Manufacturing 23% 18% 9% 23% 13%
Government 23% 8% 18% 23% 16%
INFOWORLD.COM DEEP DIVE SERIES
8. i Big Data AnalyticsDeep Dive 8
times it’s been mentioned on social networking sites as but ultimately are required for a successful
well. By modeling this data within a BI tool, the airline implementation.
would have a good idea as to the past use and profit- 6. Spend the time and money to evaluate BI technol-
ability of the route, as well as the future possibility that ogy in terms of features and functions. BI and data
tickets would sell, and at what price. visualization provide your window into the data,
and any limitations will limit the value of the data.
7. Define the metrics of success. Evaluate what’s
MAPPING A PATH FOR YOUR BUSINESS working and what’s not after a year of living
To fully capitalize on big data analytics, you need to free with this technology. Adjustments can be made
yourself from the limitations of traditional BI. Unfortu- with very little disruption.
nately, those who created BI often attempt to force tra- 8. Finally, make sure to create a road map for
ditional BI approaches (square peg) into the new world this technology. Include how it will be
of big data (round hole). As a result, they miss the full leveraged today, and into short- and long-term
potential of this technology or fail altogether. business planning.
Here’s a rough outline of how to implement big data
analytics in your own business: The value of this technology is very clear to those in
business. The ability to work with good information has
1. Understand your core business requirements always been the big challenge for IT. Now we have the tools
for this technology and create a business case. to address this issue, and it’s up to you to make it work. i
2. Define your data sources. Where are they?
What are they? What’s the best way to reach David S. Linthicum is the CTO and founder of Blue Mountain
and replicate them when required?. Labs and an internationally recognized industry expert and
3. Define known use cases, including the thought leader. Dave has authored 13 books on computing,
analytical models you will need to understand the latest of which is ”Cloud Computing and SOA Convergence
aspects of your data. in Your Enterprise, a Step-by-Step Approach.” Dave’s indus-
4. Create a proof-of-concept to both learn about the try experience includes positions as CTO and CEO of several
technology and better understand the complexities successful software companies, and upper-level management
of bringing the technology into the enterprise. positions in Fortune 100 companies. He keynotes leading tech-
5. Consider performance, security, and data nology conferences on cloud computing, SOA, enterprise appli-
governance. These issues are often overlooked, cation integration, and enterprise architecture.
INFOWORLD.COM DEEP DIVE SERIES