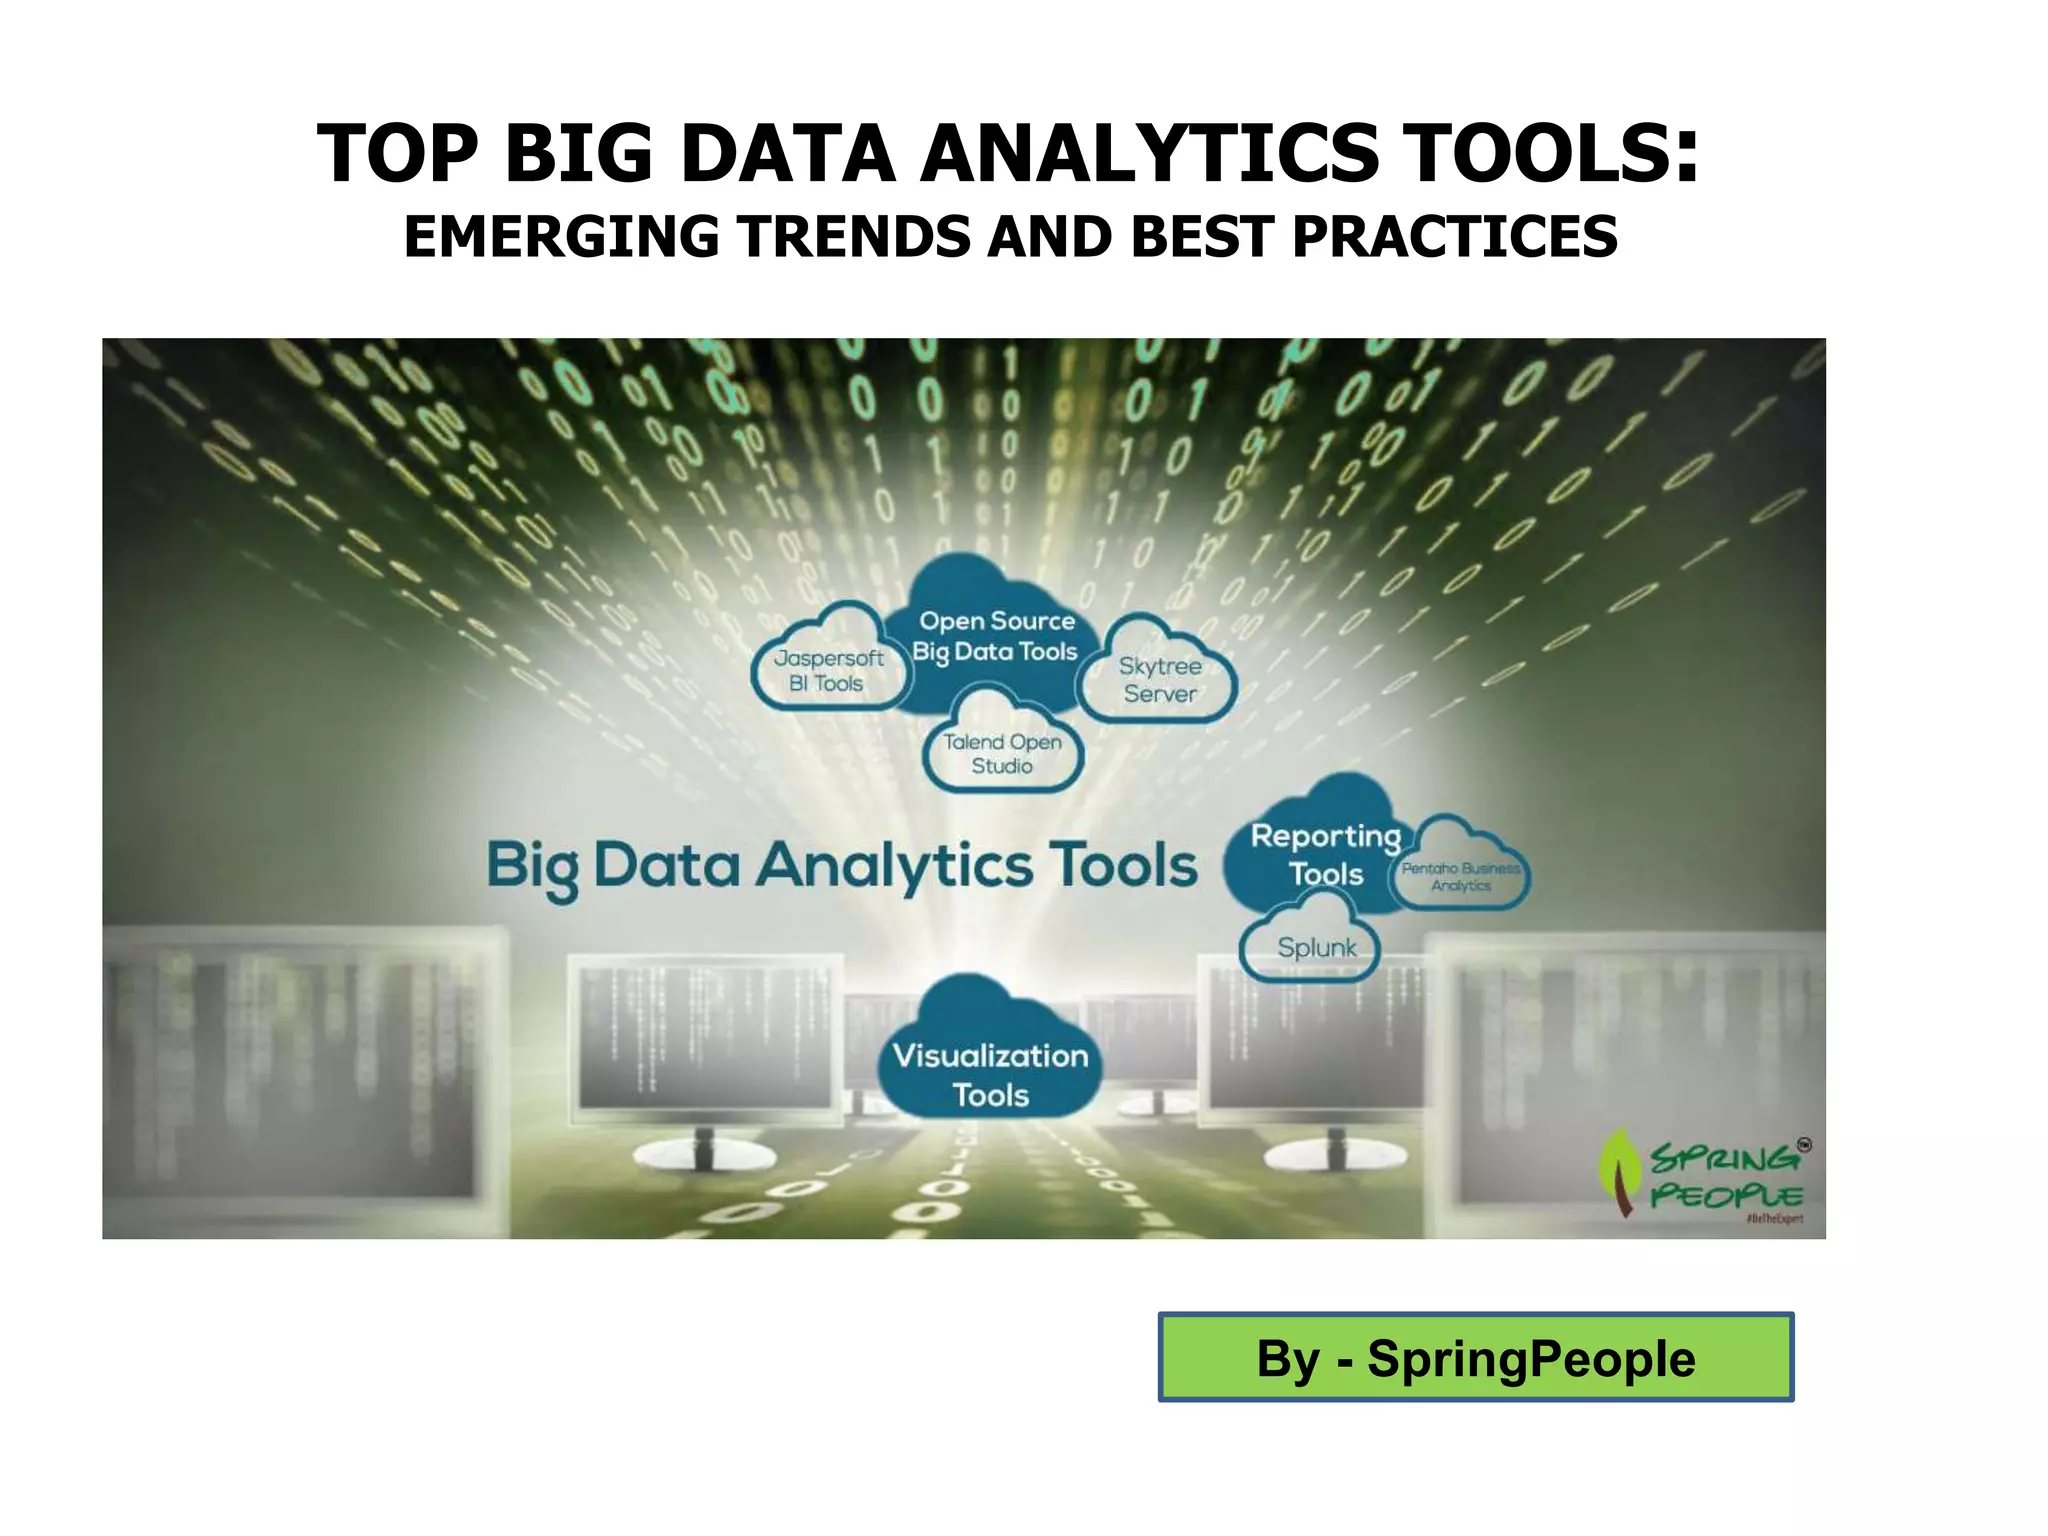
This document discusses top big data analytics tools and emerging trends in big data analytics. It defines big data analytics as examining large data sets to find patterns and business insights. The document then covers several open source and commercial big data analytics tools, including Jaspersoft and Talend for reporting, Skytree for machine learning, Tableau for visualization, and Pentaho and Splunk for reporting. It emphasizes that tool selection is just one part of a big data project and that evaluating business value is also important.
Big Data Ppt PowerPoint Presentation Slides SlideTeam
Big data has brought about a revolution in the field of information technology. Our content-ready big data PPT PowerPoint presentation slides shed light on the importance and relevance of large volumes of data. The data management presentation covers myriad of topics such as big data sources, market forecast, 3 Vs, technologies, workflow, data analytics process, impact, benefit, future, opportunity and challenges, and many additional slides containing graphs and charts. The biggest benefit that this big data analytics presentation template offers is that it enables you to unearth the information that can be used to shape the future of your business. Moreover, these designs can also be utilized to craft your own presentation on predictive analytics, data processing application, database, cloud computing, business intelligence, and user behavior analytics. Download big data PPT visuals which will help you make accurate business decisions. Enlighten folks on fraud with our Big Data PPt PowerPoint Presentation Slides. Convince them to be highly alert.
Big Data & Analytics (Conceptual and Practical Introduction)Yaman Hajja, Ph.D.
A 3-day interactive workshop for startups involve in Big Data & Analytics in Asia. Introduction to Big Data & Analytics concepts, and case studies in R Programming, Excel, Web APIs, and many more.
DOI: 10.13140/RG.2.2.10638.36162
3 pillars of big data : structured data, semi structured data and unstructure...PROWEBSCRAPER
There are 3 pillars of Big Data
1.Structured data
2.Unstructured data
3.Semi structured data
Businesses worldwide construct their empire on these three pillars and capitalize on their limitless potential.
Big Data Analytics | What Is Big Data Analytics? | Big Data Analytics For Beg...Simplilearn
The presentation about Big Data Analytics will help you know why Big Data analytics is required, what is Big Data analytics, the lifecycle of Big Data analytics, types of Big Data analytics, tools used in Big Data analytics and few Big Data application domains. Also, we'll see a use case on how Spotify uses Big Data analytics. Big Data analytics is a process to extract meaningful insights from Big Data such as hidden patterns, unknown correlations, market trends, and customer preferences. One of the essential benefits of Big Data analytics is used for product development and innovations. Now, let us get started and understand Big Data Analytics in detail.
Below are explained in this Big Data analytics tutorial:
1. Why Big Data analytics?
2. What is Big Data analytics?
3. Lifecycle of Big Data analytics
4. Types of Big Data analytics
5. Tools used in Big Data analytics
6. Big Data application domains
What is this Big Data Hadoop training course about?
The Big Data Hadoop and Spark developer course have been designed to impart an in-depth knowledge of Big Data processing using Hadoop and Spark. The course is packed with real-life projects and case studies to be executed in the CloudLab.
What are the course objectives?
This course will enable you to:
1. Understand the different components of the Hadoop ecosystem such as Hadoop 2.7, Yarn, MapReduce, Pig, Hive, Impala, HBase, Sqoop, Flume, and Apache Spark
2. Understand Hadoop Distributed File System (HDFS) and YARN as well as their architecture, and learn how to work with them for storage and resource management
3. Understand MapReduce and its characteristics, and assimilate some advanced MapReduce concepts
4. Get an overview of Sqoop and Flume and describe how to ingest data using them
5. Create database and tables in Hive and Impala, understand HBase, and use Hive and Impala for partitioning
6. Understand different types of file formats, Avro Schema, using Arvo with Hive, and Sqoop and Schema evolution
7. Understand Flume, Flume architecture, sources, flume sinks, channels, and flume configurations
8. Understand HBase, its architecture, data storage, and working with HBase. You will also understand the difference between HBase and RDBMS
9. Gain a working knowledge of Pig and its components
10. Do functional programming in Spark
11. Understand resilient distribution datasets (RDD) in detail
12. Implement and build Spark applications
13. Gain an in-depth understanding of parallel processing in Spark and Spark RDD optimization techniques
14. Understand the common use-cases of Spark and the various interactive algorithms
15. Learn Spark SQL, creating, transforming, and querying Data frames
Learn more at https://www.simplilearn.com/big-data-and-analytics/big-data-and-hadoop-training
Big Data Tools: A Deep Dive into Essential ToolsFredReynolds2
Today, practically every firm uses big data to gain a competitive advantage in the market. With this in mind, freely available big data tools for analysis and processing are a cost-effective and beneficial choice for enterprises. Hadoop is the sector’s leading open-source initiative and big data tidal roller. Moreover, this is not the final chapter! Numerous other businesses pursue Hadoop’s free and open-source path.
March Towards Big Data - Big Data Implementation, Migration, Ingestion, Manag...Experfy
Gartner, IBM, Accenture and many others have asserted that 80% or more of the world’s information is unstructured – and inherently hard to analyze. What does that mean? And what is required to extract insight from unstructured data?
Unstructured data is infinitely variable in quality and format, because it is produced by humans who can be fastidious, unpredictable, ill-informed, or even cynical, but always unique, not standard in any way. Recent advances in natural language processing provides the notion that unstructured content can be included in data analysis.
Serious growth and value companies are committed to data. The exponential growth of Big Data has posed major challenges in data governance and data analysis. Good data governance is pivotal for business growth.
Therefore, it is of paramount importance to slice and dice Big Data that addresses data governance and data analysis issues. In order to support high quality business decision making, it is important to fully harness the potential of Big Data by implementing proper Data Migration, Data Ingestion, Data Management, Data Analysis, Data Visualization and Data Virtualization tools.
Check it out: https://www.experfy.com/training/courses/march-towards-big-data-big-data-implementation-migration-ingestion-management-visualization
BUSINESS INTELLIGENCE
TECHNOLOGIES USED IN BUSINESS ANALYST:
Data Warehousing
Dashboards
Ad Hoc Reporting
Data Discovery
Cloud Data Services
BI TECHNOLOGIES USED:
SAP Business Intelligence
Tableau
TIBCO Spotfire
SAS Business Intelligence
MicroStrategy
Sisense
Yellowfin BI
Dundas BI
Systum
Microsoft Power BI
Looker
Clear Analytics
domo
Oracle BI
QlikView
There are many useful Data Mining tools available.
The following is a compiled collection of top handpicked Data Mining tools with their prominent features. The reference list includes both open source and commercial resources.
https://www.datatobiz.com/blog/data-mining-tools/
Now companies are in the middle of a renovation that forces them to be analytics-driven to
continue being competitive. Data analysis provides a complete insight about their business. It
also gives noteworthy advantages over their competitors. Analytics-driven insights compel
businesses to take action on service innovation, enhance client experience, detect irregularities in
process and provide extra time for product or service marketing. To work on analytics driven
activities, companies require to gather, analyse and store information from all possible sources.
Companies should bring appropriate tools and workflows in practice to analyse data rapidly and
unceasingly. They should obtain insight from data analysis result and make changes in their
business process and practice on the basis of gained result. It would help to be more agile than
their previous process and function.
Operational Analytics: Best Software For Sourcing Actionable Insights 2013Newton Day Uploads
Actionable Insights are those views of data that cause managers to ask new questions about how processes work and take action. They differ from traditional key performance measures and daily operating reports that focus on delivering a picture of progress against a strategic objective, operating budget or forecast. What software is best for your business to source these game-changing perspectives of your enterprise?
Should You Integrate DataOps in Your Business Process?Enov8
Data is the lifeblood of any business. It holds information about customers and their behaviors, products, and services. It's also the lifeblood of any enterprise — it's what keeps the lights on, keeps employees productive, and helps companies stay ahead of their competition.
And DataOps can make data management more efficient!
An overview of the different sets of functionality of Tableau solution suite, and how it can address the many facets of a comprehensive data mining solution.
For Impetus’ White Papers archive, visit- http://www.impetus.com/whitepaper
In this paper, Impetus focuses at why organizations need to design an Enterprise Data Warehouse (EDW) to support the business analytics derived from the Big Data.
Business intelligence- Components, Tools, Need and Applicationsraj
As part of the research project for the course Technical Foundations of Information Systems at the University of Illinois, our team worked on the topic, Business Intelligence. The presentation focuses on what is Business Intelligence, its various components, latest tools, the need of BI as well as applications of this technology. This project deals with the latest development of BI technologies (hardware or software) and includes comprehensive literature survey from Journals, and the Internet.
Data Visualization Trends - Next Steps for TableauArunima Gupta
Want answers to:
- What is data visualization?
- Why is it deemed disruptive in the field of analytics?
- What is Tableau?
Come view the slide deck!
Concludes with:
- Digital strategy recommendations for Tableau to become the winner in a winner-take-all-market
Similar to Top Big data Analytics tools: Emerging trends and Best practices (20)
Growth hacking tips and tricks that you can trySpringPeople
The term growth hacking has been gaining popularity in the tech space.In these slides, we will talk about tips and tricks that help a skilled growth hacker to grow their company.
Every day we roughly create 2.5 Quintillion bytes of data; 90% of the worlds collected data has been generated only in the last 2 years. In this slide, learn the all about big data
in a simple and easiest way.
In this slide, learn how selenium WebDriver tool supply a well-designed object-oriented API that provides improved support for modern, advanced web-app testing problems.
Introduction to Open stack - An Overview SpringPeople
OpenStack is a free & open-source software platform for cloud computing, mostly deployed as an IaaS. In this Slide, we will cover:
- Evolution of Openstack
- Cloud, its types and advantages
- Importance and overview of Openstack
- Openstack course syllabus
Mastering Test Automation: How To Use Selenium SuccessfullySpringPeople
In this slide, identify what to test and choose the best language for automation. Learn to write maintainable and reusable Selenium tests and add UI layout test as part of automation using Galen framework. This slide will also guide you in reporting structure by using external plugin's, an illustration covering cross browser testing (Running selenium grid with Docker) and explain Code repository (Git) and Jenkins CI tool.
An Introduction of Big data; Big data for beginners; Overview of Big Data; Bi...SpringPeople
Technologies such as Hadoop and Apache Spark have brought a dynamic change in the ways of analyzing big data. It is increasingly used by companies across the globe. Data Scientist has been regarded as the hottest job of 2016. In this Slide, you will be taken through the basics of Big data and its future. You will also be exposed to Hadoop and Apache Spark.
SpringPeople - Introduction to Cloud ComputingSpringPeople
Cloud computing is no longer a fad that is going around. It is for real and is perhaps the most talked about subject. Various players in the cloud eco-system have provided a definition that is closely aligned to their sweet spot –let it be infrastructure, platforms or applications.
This presentation will provide an exposure of a variety of cloud computing techniques, architecture, technology options to the participants and in general will familiarize cloud fundamentals in a holistic manner spanning all dimensions such as cost, operations, technology etc
SpringPeople - Devops skills - Do you have what it takes?SpringPeople
Whether you are a Developer, QA or a IT Operations personnel, with organizations adapting devops practices you need to skill up with the latest and the greatest of the devops tools, relevant to you. And its not the same basket of tools that dev and ops both opt for. This webinar is about the essential devops skills required to transform yourself to be a next gen devops professional. And this is based on real data, a devops skills report by Initcron.
ELK Stack workshop covers real-world use cases and works with the participants to - implement them. This includes Elastic overview, Logstash configuration, creation of dashboards in Kibana, guidelines and tips on processing custom log formats, designing a system to scale, choosing hardware, and managing the lifecycle of your logs.
To transform your organization and unlock the value of your data, you need a way to ingest, store and analyze every type of data in your organization.
This presentation covers the Data Access Layer of the Hadoop Ecosystem which enables you to achieve this.
We will use the HDP (Hortonworks Data Platform) reference architecture to walk through the Hadoop core and its ecosystem with focus on the data access layer.
We will cover some of the prominent tools of the ecosystem such as Pig, Hive, Sqoop, Flume and Oozie and how they are used for ingesting data into Hadoop from structured, unstructured and streaming sources.
Talk to us at +91 80 6567 9700 or send an email to training@springpeople.com for more information.
Introduction To Hadoop Administration - SpringPeopleSpringPeople
The Hadoop framework is used by major players including Google, Yahoo and IBM, largely for applications involving search engines and advertising. The popularity of Hadoop is juts increasing exponentially.
Introduction To Cloud Foundry - SpringPeopleSpringPeople
Cloud Foundry - Streamline application development, deployment and operations on a centrally-managed Platform as a Service for public and private cloud.
Introduction To Spring Enterprise Integration - SpringPeopleSpringPeople
Spring Integration's primary goal is to provide a simple model for building enterprise integration solutions while maintaining the separation of concerns that is essential for producing maintainable, testable code.
Introduction To Groovy And Grails - SpringPeopleSpringPeople
Groovy and Grails Tool Suite supports application targeting to local, virtual and cloud-based servers. It is freely available for development and internal business operations use with no time limits.
Introduction To Jenkins - SpringPeopleSpringPeople
Jenkins CI is the leading open-source continuous integration server. Built with Java, it provides 1057 plugins to support building and testing virtually any project.
Adjusting primitives for graph : SHORT REPORT / NOTESSubhajit Sahu
Graph algorithms, like PageRank Compressed Sparse Row (CSR) is an adjacency-list based graph representation that is
Multiply with different modes (map)
1. Performance of sequential execution based vs OpenMP based vector multiply.
2. Comparing various launch configs for CUDA based vector multiply.
Sum with different storage types (reduce)
1. Performance of vector element sum using float vs bfloat16 as the storage type.
Sum with different modes (reduce)
1. Performance of sequential execution based vs OpenMP based vector element sum.
2. Performance of memcpy vs in-place based CUDA based vector element sum.
3. Comparing various launch configs for CUDA based vector element sum (memcpy).
4. Comparing various launch configs for CUDA based vector element sum (in-place).
Sum with in-place strategies of CUDA mode (reduce)
1. Comparing various launch configs for CUDA based vector element sum (in-place).
Explore our comprehensive data analysis project presentation on predicting product ad campaign performance. Learn how data-driven insights can optimize your marketing strategies and enhance campaign effectiveness. Perfect for professionals and students looking to understand the power of data analysis in advertising. for more details visit: https://bostoninstituteofanalytics.org/data-science-and-artificial-intelligence/
Levelwise PageRank with Loop-Based Dead End Handling Strategy : SHORT REPORT ...Subhajit Sahu
Abstract — Levelwise PageRank is an alternative method of PageRank computation which decomposes the input graph into a directed acyclic block-graph of strongly connected components, and processes them in topological order, one level at a time. This enables calculation for ranks in a distributed fashion without per-iteration communication, unlike the standard method where all vertices are processed in each iteration. It however comes with a precondition of the absence of dead ends in the input graph. Here, the native non-distributed performance of Levelwise PageRank was compared against Monolithic PageRank on a CPU as well as a GPU. To ensure a fair comparison, Monolithic PageRank was also performed on a graph where vertices were split by components. Results indicate that Levelwise PageRank is about as fast as Monolithic PageRank on the CPU, but quite a bit slower on the GPU. Slowdown on the GPU is likely caused by a large submission of small workloads, and expected to be non-issue when the computation is performed on massive graphs.
Opendatabay - Open Data Marketplace.pptxOpendatabay
Opendatabay.com unlocks the power of data for everyone. Open Data Marketplace fosters a collaborative hub for data enthusiasts to explore, share, and contribute to a vast collection of datasets.
First ever open hub for data enthusiasts to collaborate and innovate. A platform to explore, share, and contribute to a vast collection of datasets. Through robust quality control and innovative technologies like blockchain verification, opendatabay ensures the authenticity and reliability of datasets, empowering users to make data-driven decisions with confidence. Leverage cutting-edge AI technologies to enhance the data exploration, analysis, and discovery experience.
From intelligent search and recommendations to automated data productisation and quotation, Opendatabay AI-driven features streamline the data workflow. Finding the data you need shouldn't be a complex. Opendatabay simplifies the data acquisition process with an intuitive interface and robust search tools. Effortlessly explore, discover, and access the data you need, allowing you to focus on extracting valuable insights. Opendatabay breaks new ground with a dedicated, AI-generated, synthetic datasets.
Leverage these privacy-preserving datasets for training and testing AI models without compromising sensitive information. Opendatabay prioritizes transparency by providing detailed metadata, provenance information, and usage guidelines for each dataset, ensuring users have a comprehensive understanding of the data they're working with. By leveraging a powerful combination of distributed ledger technology and rigorous third-party audits Opendatabay ensures the authenticity and reliability of every dataset. Security is at the core of Opendatabay. Marketplace implements stringent security measures, including encryption, access controls, and regular vulnerability assessments, to safeguard your data and protect your privacy.
Best best suvichar in gujarati english meaning of this sentence as Silk road ...
Top Big data Analytics tools: Emerging trends and Best practices
1. TOP BIG DATA ANALYTICS TOOLS:
EMERGING TRENDS AND BEST PRACTICES
By - SpringPeople
2. In the current market scenario, large scale and small scale companies have
already realized the importance of Big Data. It is not a mere buzzword anymore,
but the new facet of business today - which requires management of large
volumes of structured, semi-structured and unstructured data.
But that is not the end. Analysing the data in a way that brings real business value
is what the corporate industry seeks for. Hence, in order to identify trends and
patterns, and churn out the valuable things from a massive amount of data, the
role of Big Data analytics comes into play.
3. What is Big Data analytics?
In order to understand how to analyse data, let us understand what Big Data exactly
is. Big Data analytics is the process of a data analysis that involves
examination of large data sets to find hidden patterns, customer preferences,
market trends, unknown correlations and many other business information.
Those analytical findings can generate more effective marketing, enhanced
operational efficiency, new revenue opportunities, better customer service,
competitive advantages over the rival organizations and many other business
opportunities. Business and IT heads who used to report the Big Data management
issues on a regular basis are now slowly migrating to big data analytics to solve
those problems.
4. Big Data Analysis
• Analysing big data is much beyond just buying a data analytics software because
handling only the data analytic technologies is not just the challenge. Well-planned
strategies, big data analysis techniques and people with the right set of skills and
talent who could leverage the technologies according to the given parameters are
also essential for a big data analytics initiative.
• On the other hand, buying additional tools for business intelligence beyond an
organization's analytics applications and business intelligence may not even be
necessary depending upon the business goals set for a particular project.
• The potential pitfalls that can boost up organizations taking initiatives on big data
analytics contain many loopholes like, the lack of expertise in internal data analytics
and expensiveness of hiring experienced analytics professionals.
• Data management, quality and consistency issues are also caused by the amount of
information that is involved and its variety. In addition to that, integrating Hadoop
systems and data warehouses could be a bit messy, although many vendors now
offer software connectors that join big data tools Hadoop with relational databases
and other data integration tools (having big data capabilities).
5. Big Data Analytics Tools
The modern day technologies allow big data analysis using many software tools
commonly taken as a part of advanced analytics processes such as predictive analysis,
text analysis, data mining and statistical analysis.
The software is available in the open source platform and can be used as big data
reporting tools as well. On the other hand, mainstream business intelligence tools and
big data visualization tools play an important role in the advanced stage.
Let us discuss different categories of data analysis and reporting tools, and how they
can be deployed to initialize and advance the process of big data analysis.
1. OPEN SOURCE BIG DATA TOOLS
JASPERSOFT BI TOOLS
Jaspersoft was originally created for report generation andnow it is gaining popularity
as one of the best open source tools for business intelligence, that generates reports
by extracting information from database columns.
6. • This software is one of the highly advanced reporting tools for big data deployed
already in the business market for creating PDFs out of SQL tables for everyone to
scrutinize at business meetings. It forms a bridge between report generating software
and big data storage houses.
• Jaspersoft now offers software to extract data from most of the major storage
platforms such as Cassandra, MongoDB, Riak, Redis, Neo4J, and CouchDB. Once
the data is sucked up, Jaspersoft's server converts that into interactive tables and
graphs.
• The reports thus generated are highly sophisticated interactive tools which help the
user drill down as much as possible and fetch as many details as required. This
stands at the top of the list of business intelligence tools and Jaspersoft is attempting
to make it even easier to use the sophisticated reports.
• Basically, it doesn't offer particularly a new vision to look at data, all it offers is a
highly sophisticated form of accessing data located in new storage houses.
7. TALEND OPEN STUDIO
• Talend studio is an open-source software that offers an eclipse-based IDE to string
data processing jobs with Hadoop. It is mainly used for data integration, data quality,
and data management, with subroutines involved in these jobs.
• It allows the user to drag and drop little icons onto a canvas. Its components also
allow the user to fetch RSS feeds and proxy them as and when needed. There are
numerous components to gather information and others to do things like a "fuzzy
match" prior to the output of results.
• Stringing the data processing jobs together visually with this tool could be easier
once you get to know what the components can do and what not.
8. SKYTREE SERVER
• Skytree is one of the best open source big data tools that bringyou a bundle,which
performs like the highly advanced forms of machine-learning algorithms. However,
the user needs to take special care about typing the right command on the command
line.
•
• Skytree is specially designed to run a number of complex machine-learning
algorithms on the data using an implementation, about 10,000 times faster than other
packages. Its intelligence system searches 'system data' by looking for clusters
formed by mathematically similar items. Then it inverts the data to identify outliners
which could possibly be problems, opportunities or both.
•
• It comes in both paid and free versions. Even the free version of this tool offers the
same algorithms as that of the proprietary version. The only limitation is, data sets
limited to 100,000 rows.
9. 2. BIG DATA VISUALIZATION TOOLS
• Data visualization today has gone far more than just charts and graphs used in
Excel Sheets. Now it has gone to more advanced levels such as info graphics,
geographic maps, dials and gauges, heat maps, spark lines, detailed bars, pie and
fever charts. Sometimes the images might include interactive capabilities that
enable the users to manipulate or drill into the data for querying or analysing.
• Most of the business intelligence software vendors nowadays embed big data
visualization tools into their products, either by developing the visualization
technologies on their own or sourcing it from the companies dealing with
visualization.
• Let's discuss one of the most preferred data visualization tools - Tableau Desktop
and Server. It is a visualization software that eases the way you look at your data in
a variety of new ways, then slices it and makes it look different once again!
• You can also intermix the data and check it in yet another light. This tool is perfectly
optimized to give the user all the columns for the data and enables him/her to mix
them before integrating them with one of the hundreds of default graphical
templates.
10. 3. BIG DATA REPORTING TOOLS
PENTAHO BUSINESS ANALYTICS
• Pentaho emerged as a report generating engine. Just like Jaspersoft, it extracts
information from the new sources and makes analyzing big data easy.
• Pentaho's tools can be easily linked to the most popular NoSQL databases such
as MongoDB and Cassandra. It features a very user-friendly sorting and sifting
table which comes in handy when the user wants to know who is spending the
most amount of time on a website. Thus, it is gaining much popularity among the
web analysts as one of the best big data analytics reporting tools.
11. SPLUNK
• Splunk has unique features as compared to other big data analytics tools. It is
something more than the mainstream big data reporting tools or a mere
collection of AI routines, although it covers most of that.
• It creates an index of data as if it were a block of text or an entire book. Despite the
fact that databases also build indices, Splunk's approach is almost like a text
search process and the best part is, this sort of indexing is amazingly flexible.
• Splunk is sold in multiple packages:
• i.) For monitoring Microsoft exchange server;
• ii.) Detecting web attacks.
• The index created by Splunk helps in establishing a correlation between data in
these and several other server-side scenarios.
• The selection of technology/tool is just a part of the big data project. Experts say
that evaluation of the potential business value, which a big data software can offer,
keeping long-term objectives in mind, is a very crucial step.
12. • We have INSTRUCTOR -LED - both Online LIVE & Classroom Session
Present for classroom sessions in Bangalore & Delhi (NCR)
We are the ONLY Education delivery partners for Mulesoft, Elastic, Pivotal & Lightbend
in India
We have delivered more than 5000 trainings and have over 400 courses and a vast pool
of over 200 experts to make YOU the EXPERT!
Connect us
What is SpringPeople all about?