Downloaded 348 times

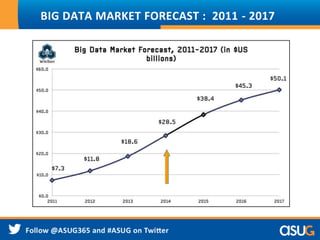
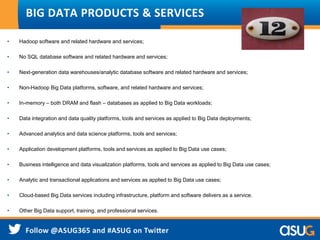
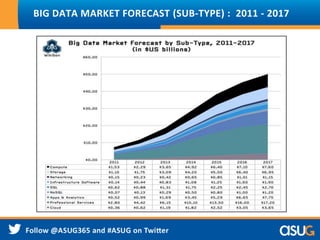
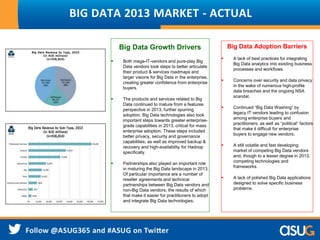


The document outlines the key trends and forecasts for the big data market from 2011 to 2017, emphasizing the growth of analytics and the technological advancements in big data infrastructure. It discusses the barriers to big data adoption and highlights crucial areas of focus for enterprises, such as security, integration, and real-time data processing. The presentation also covers various types of analytics and provides guidance on building effective analytics strategies in organizations.