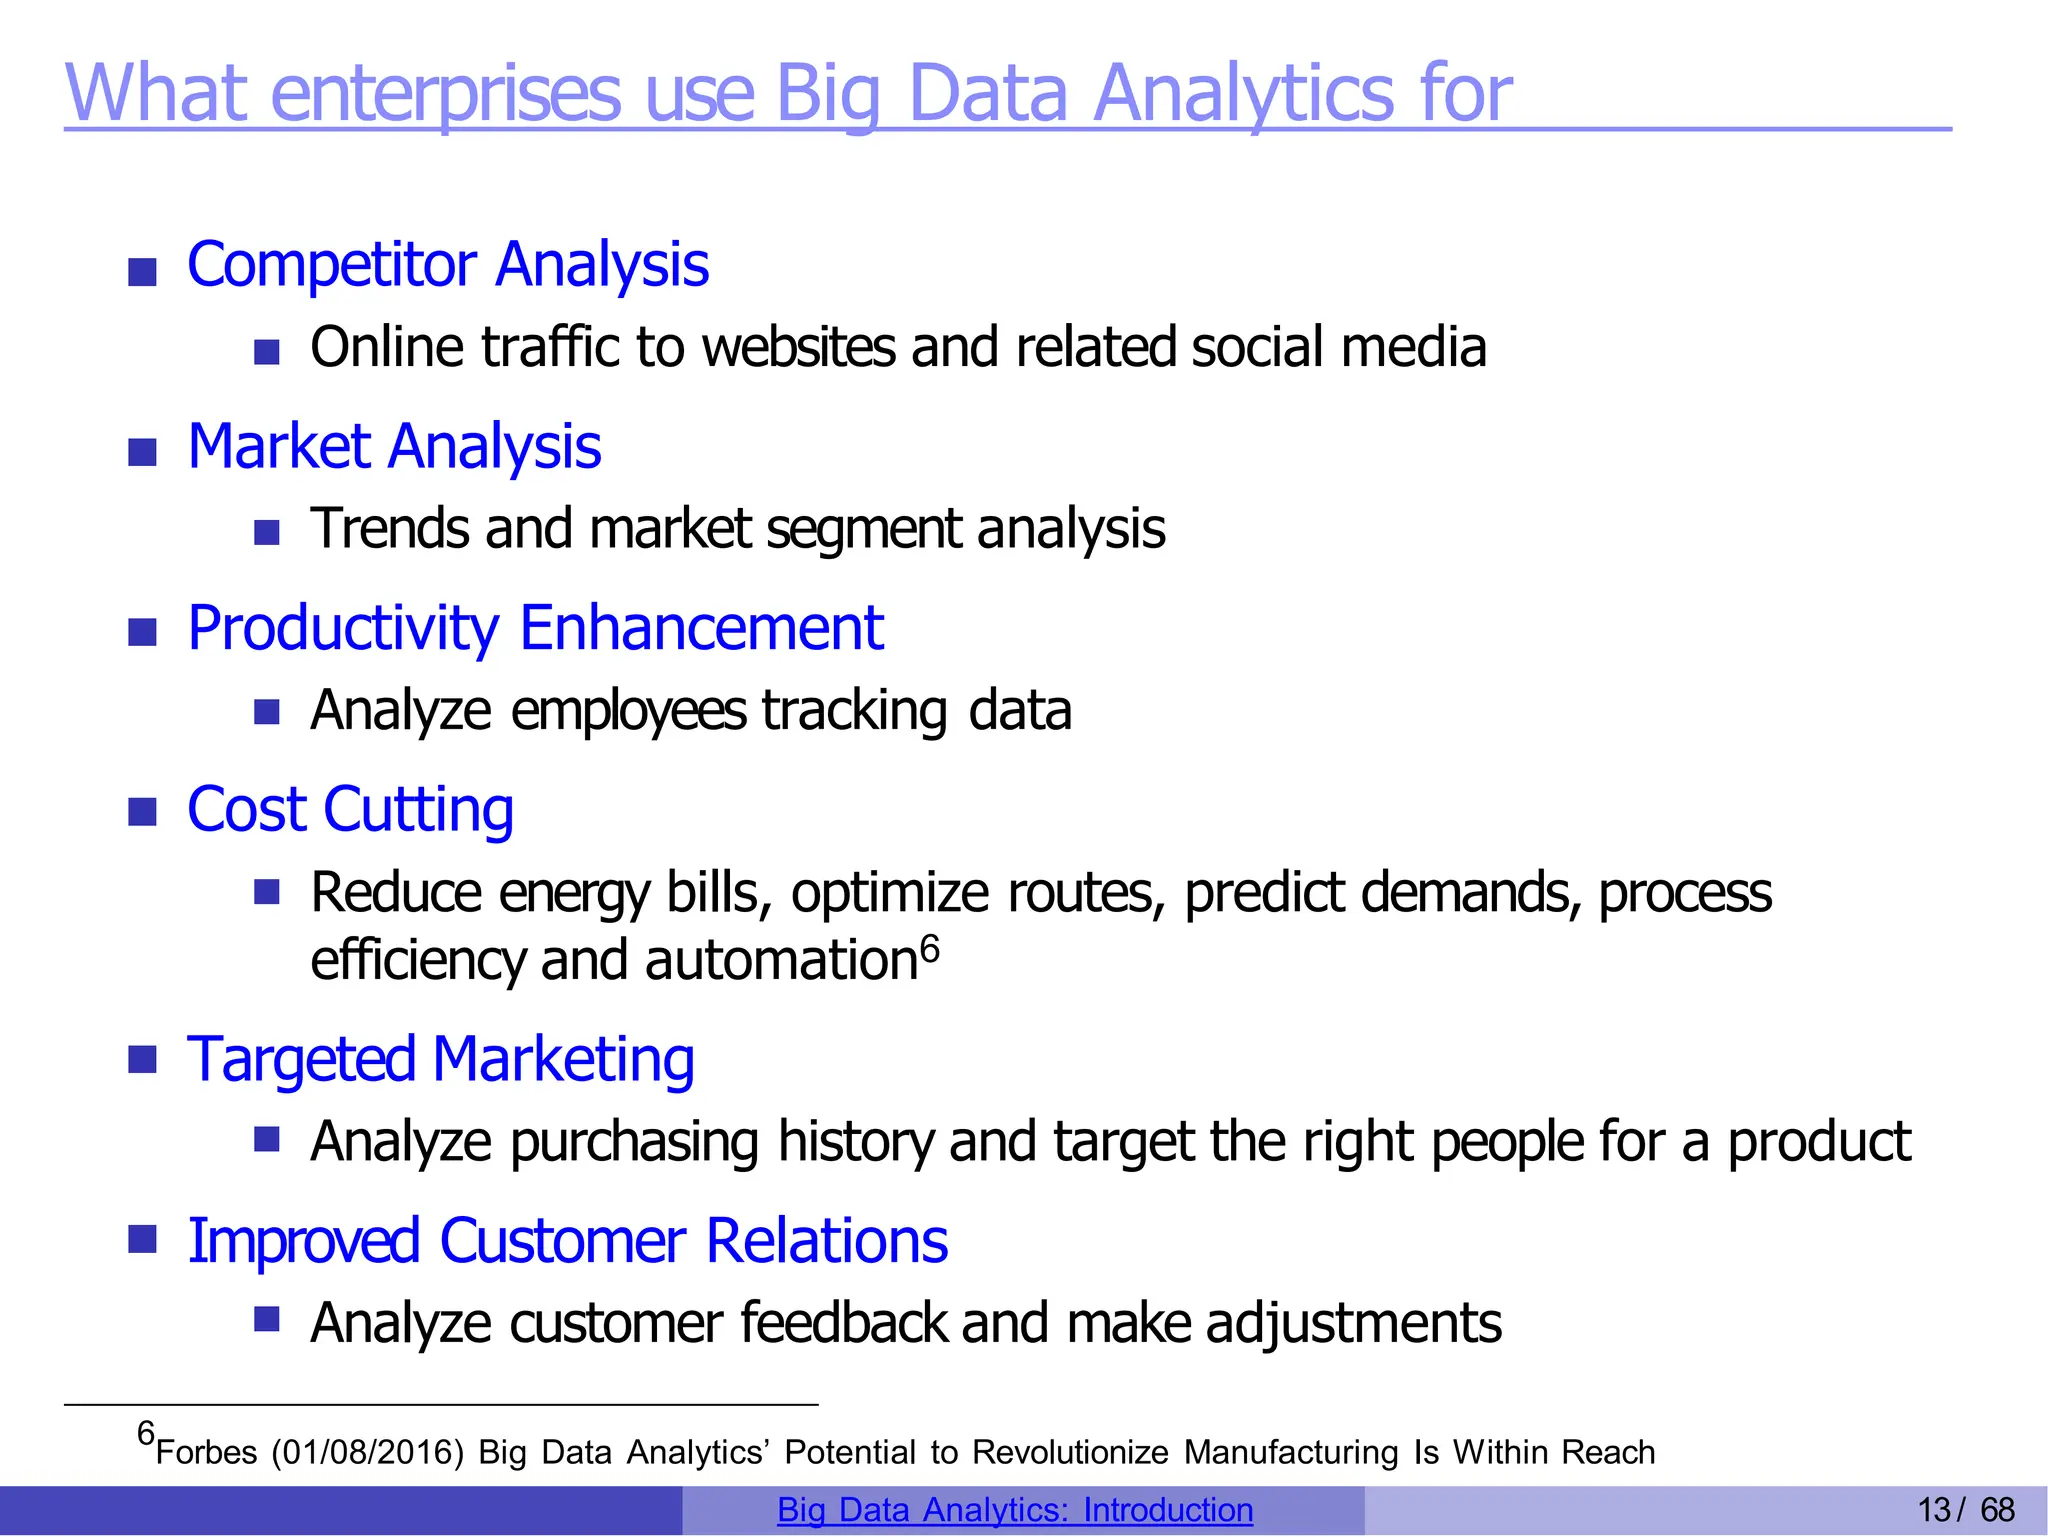
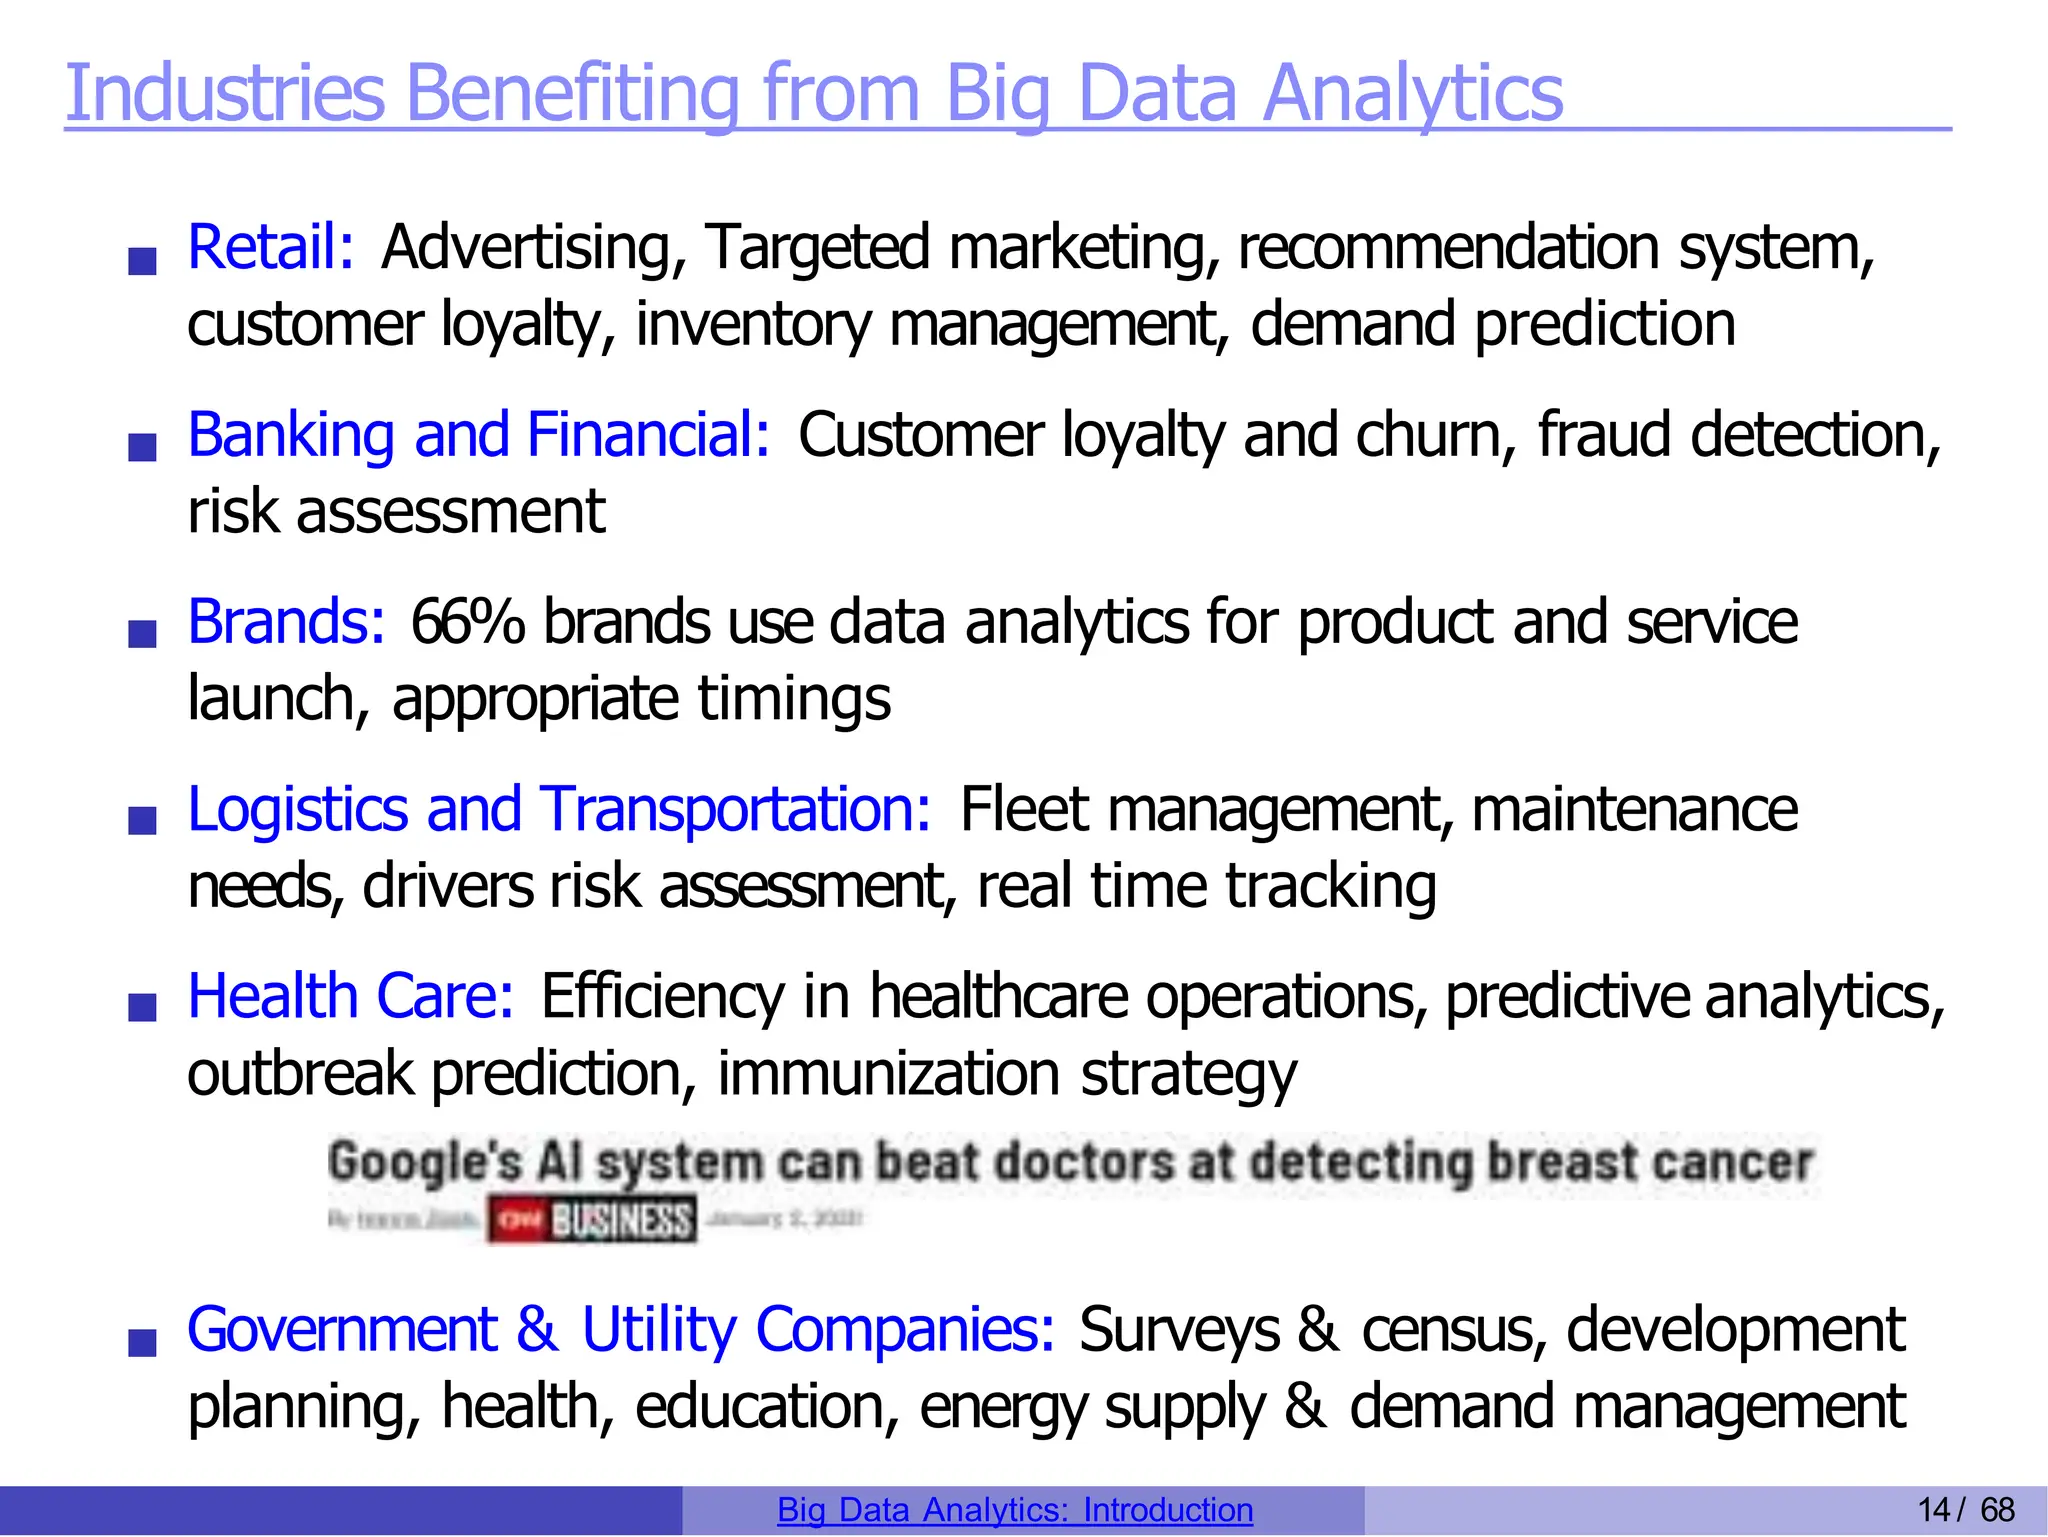
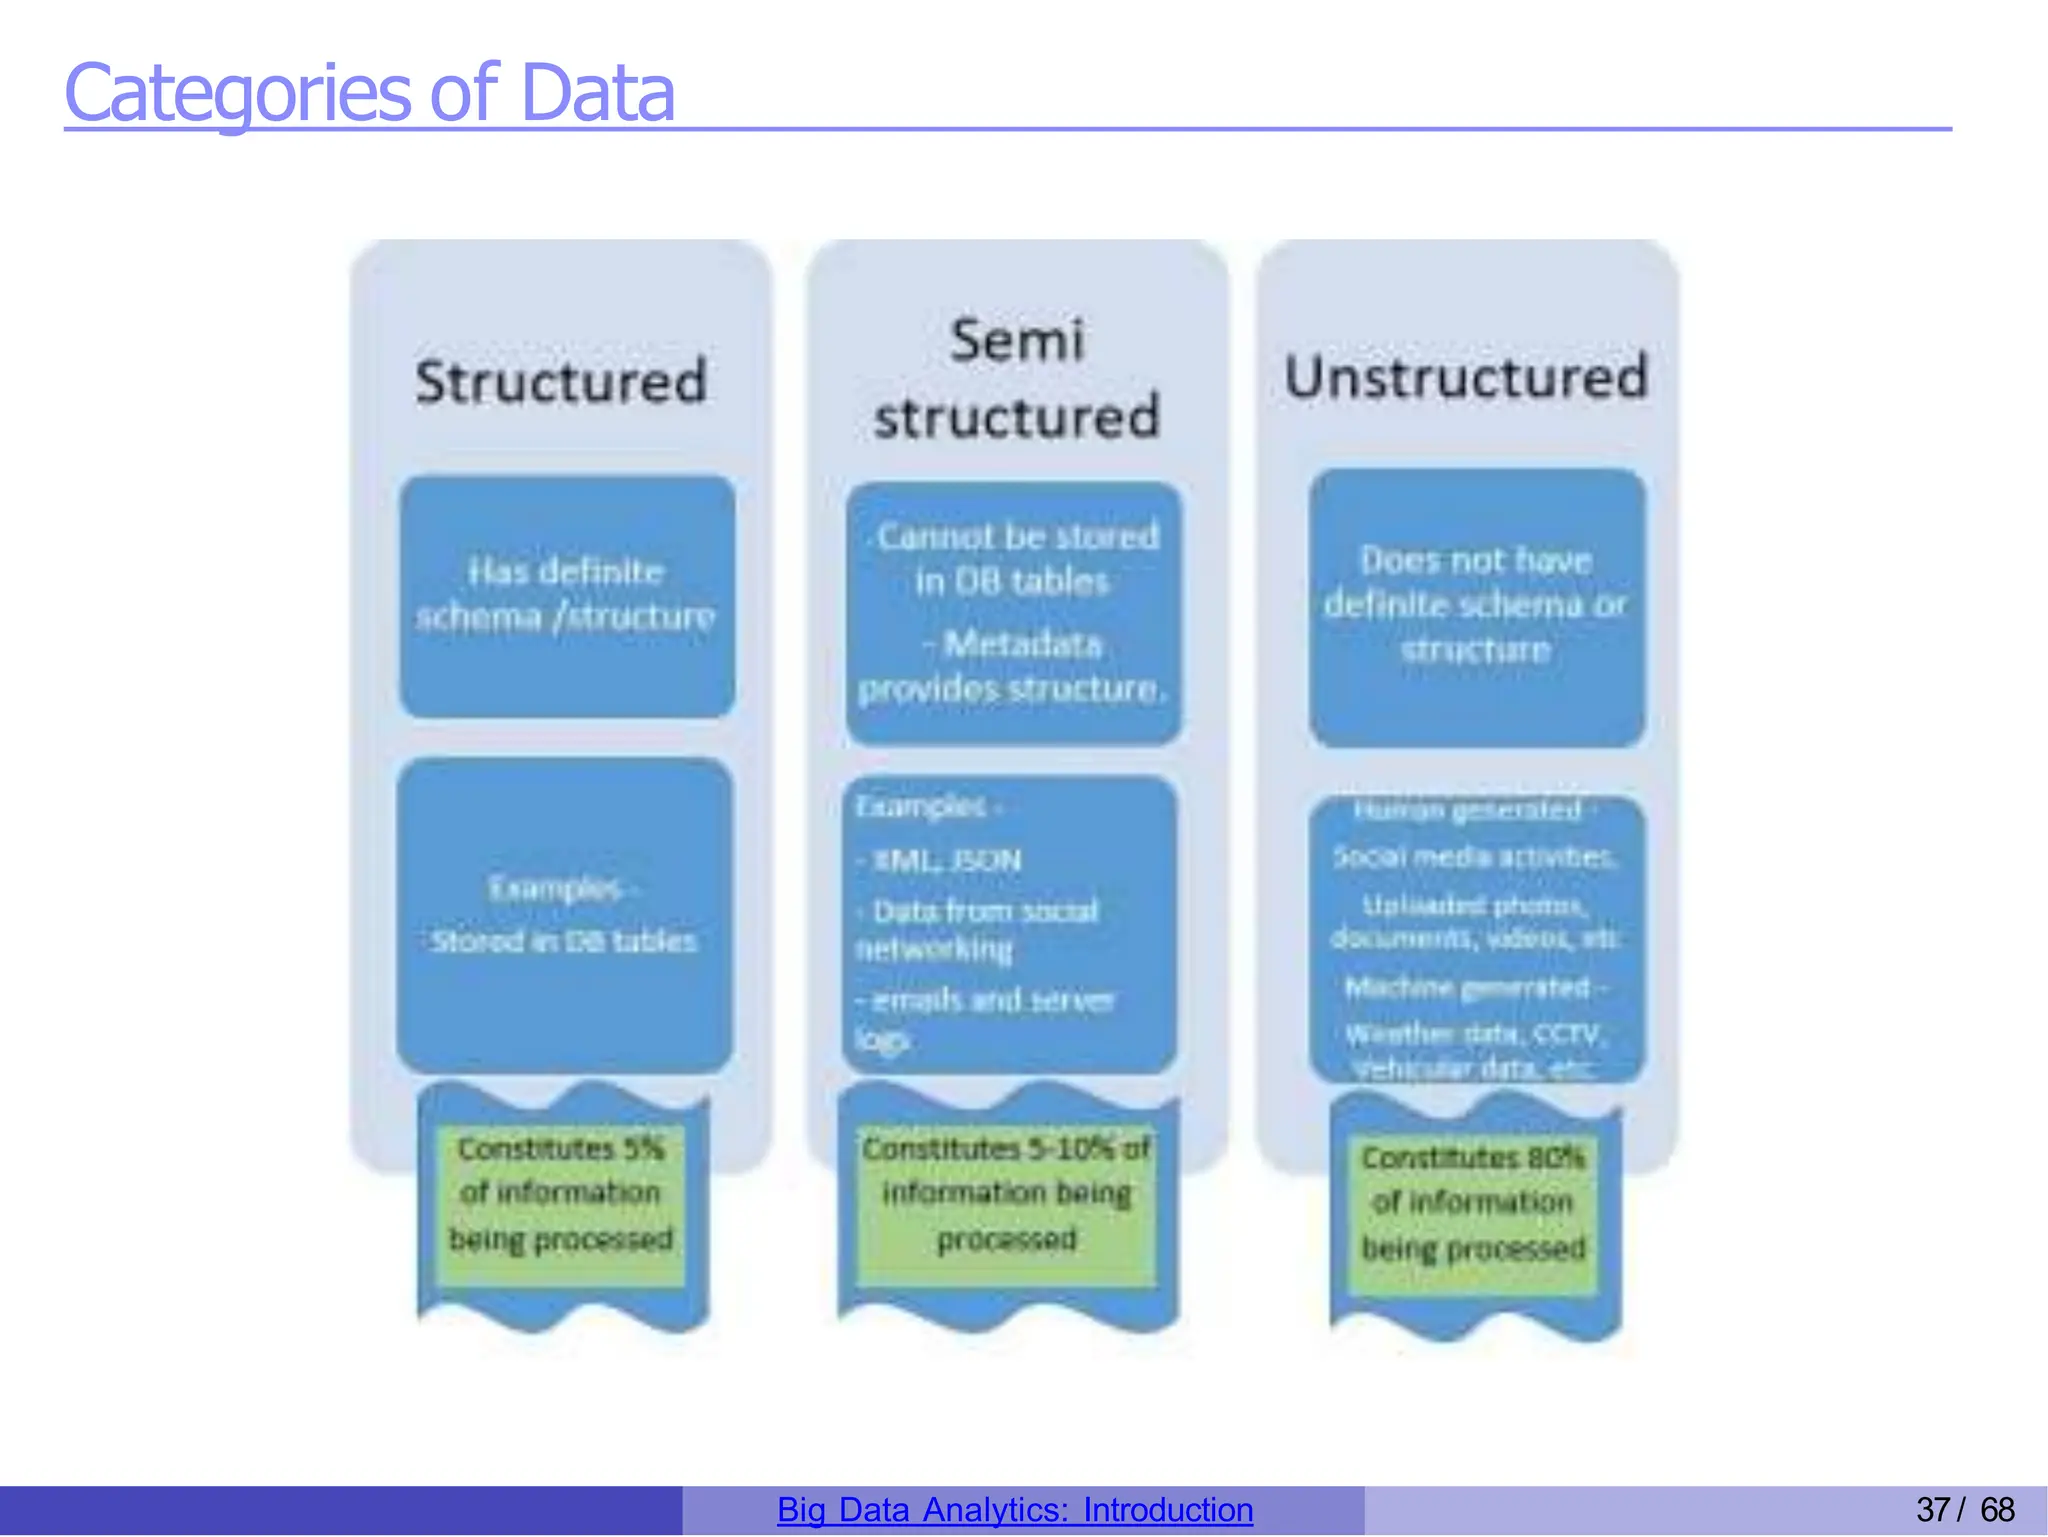
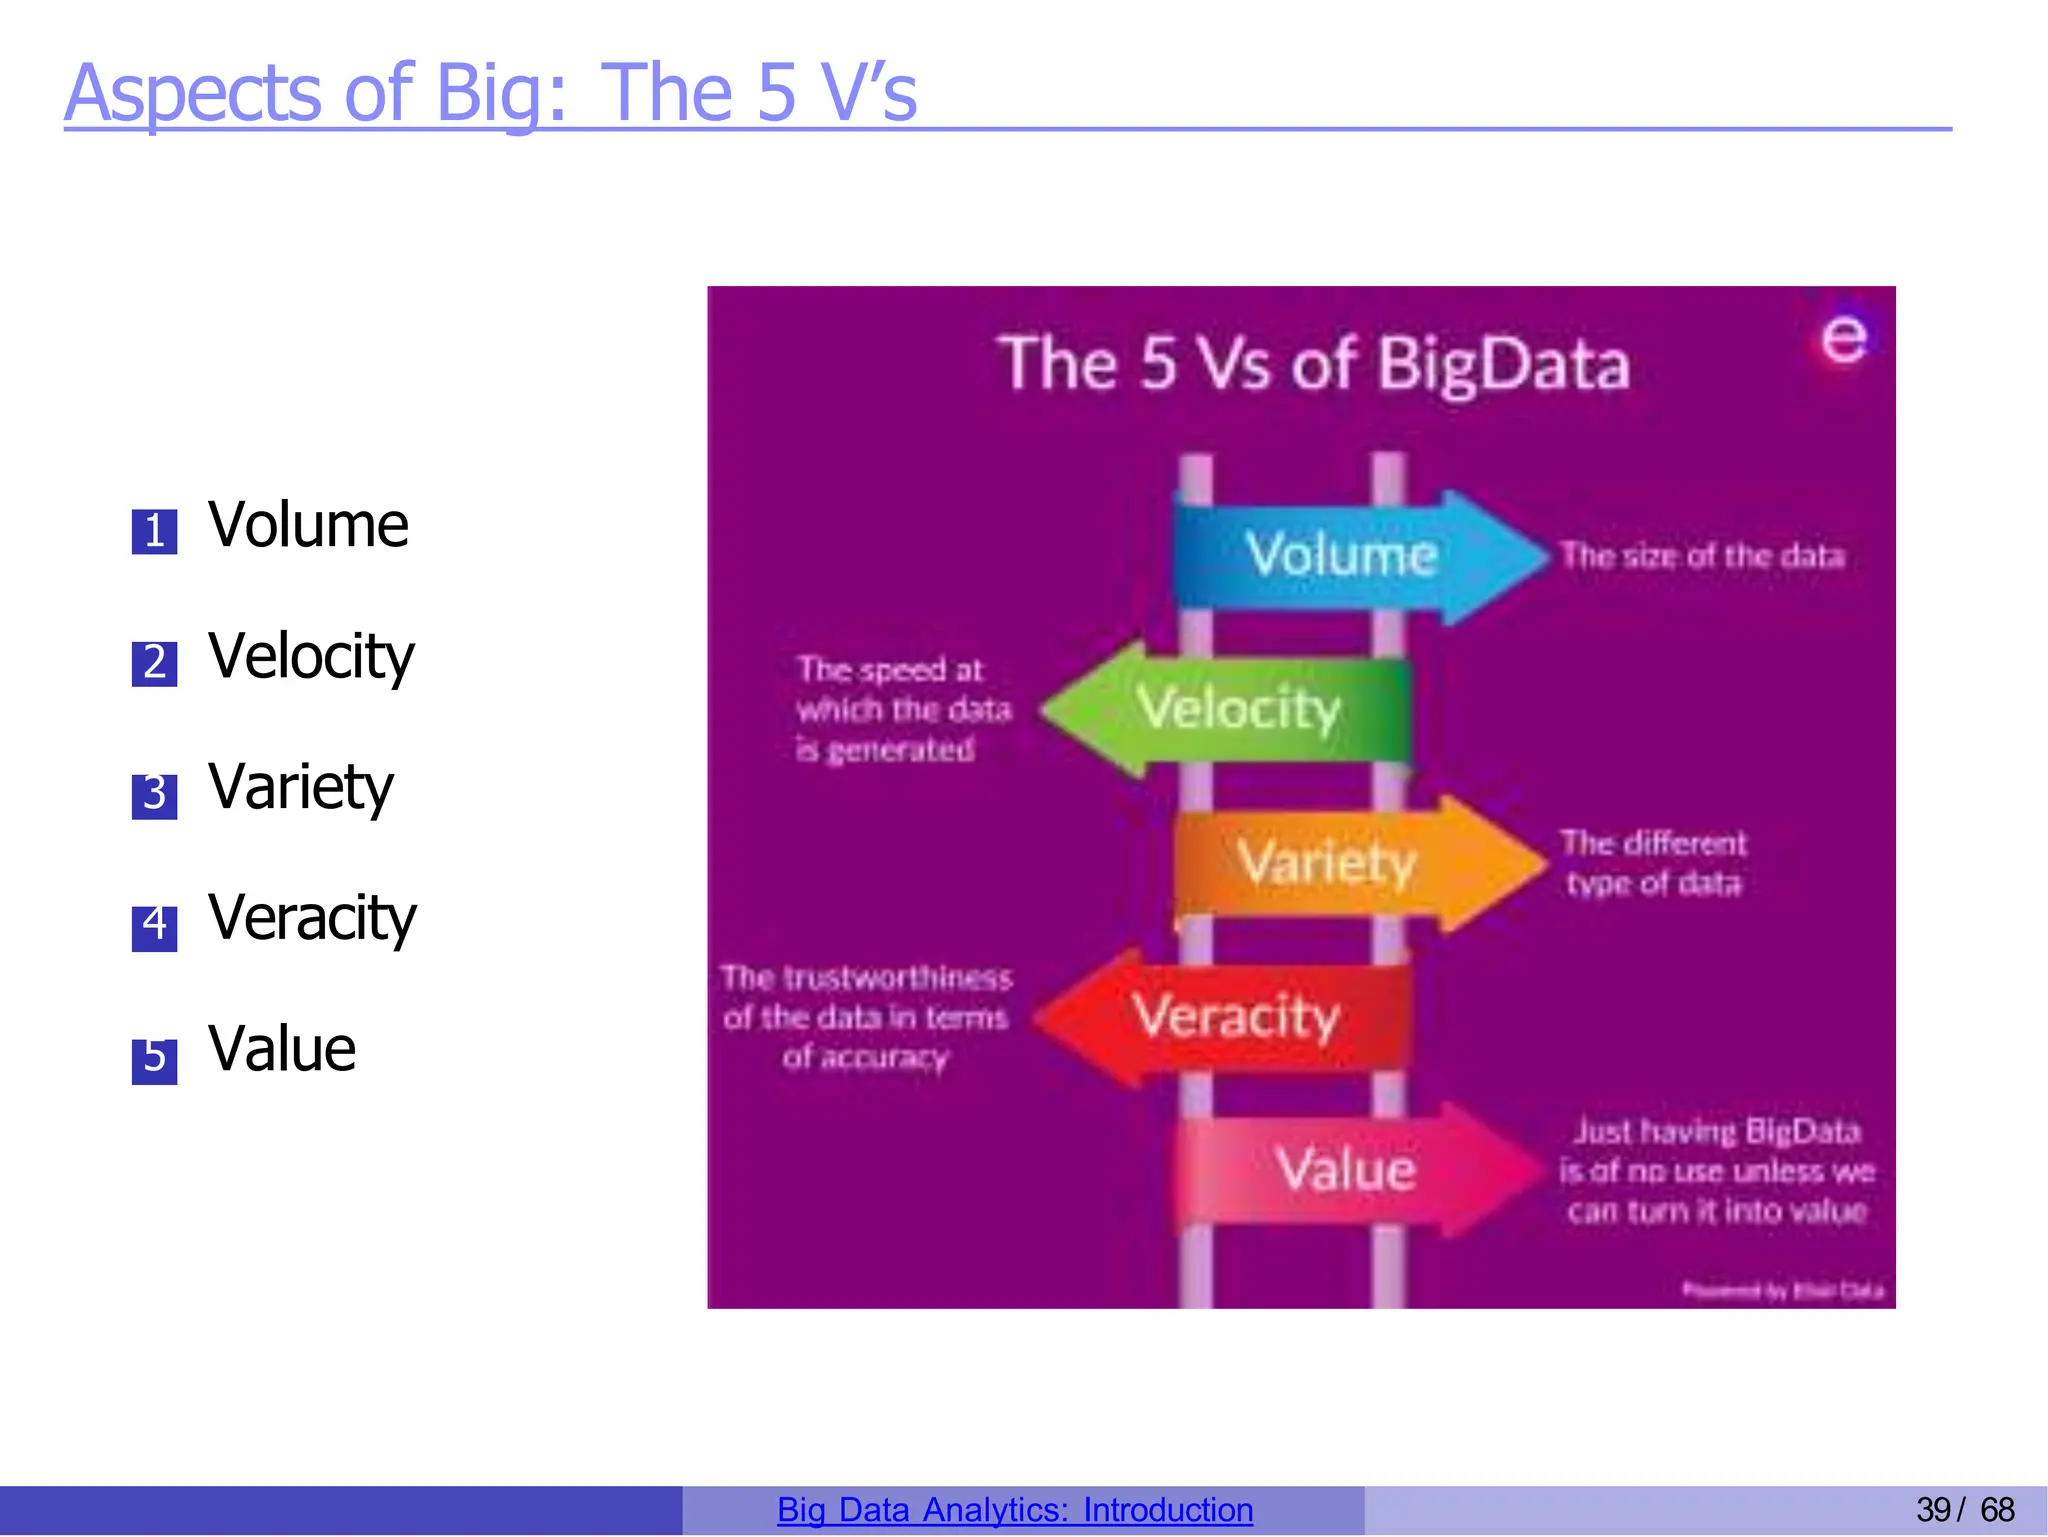
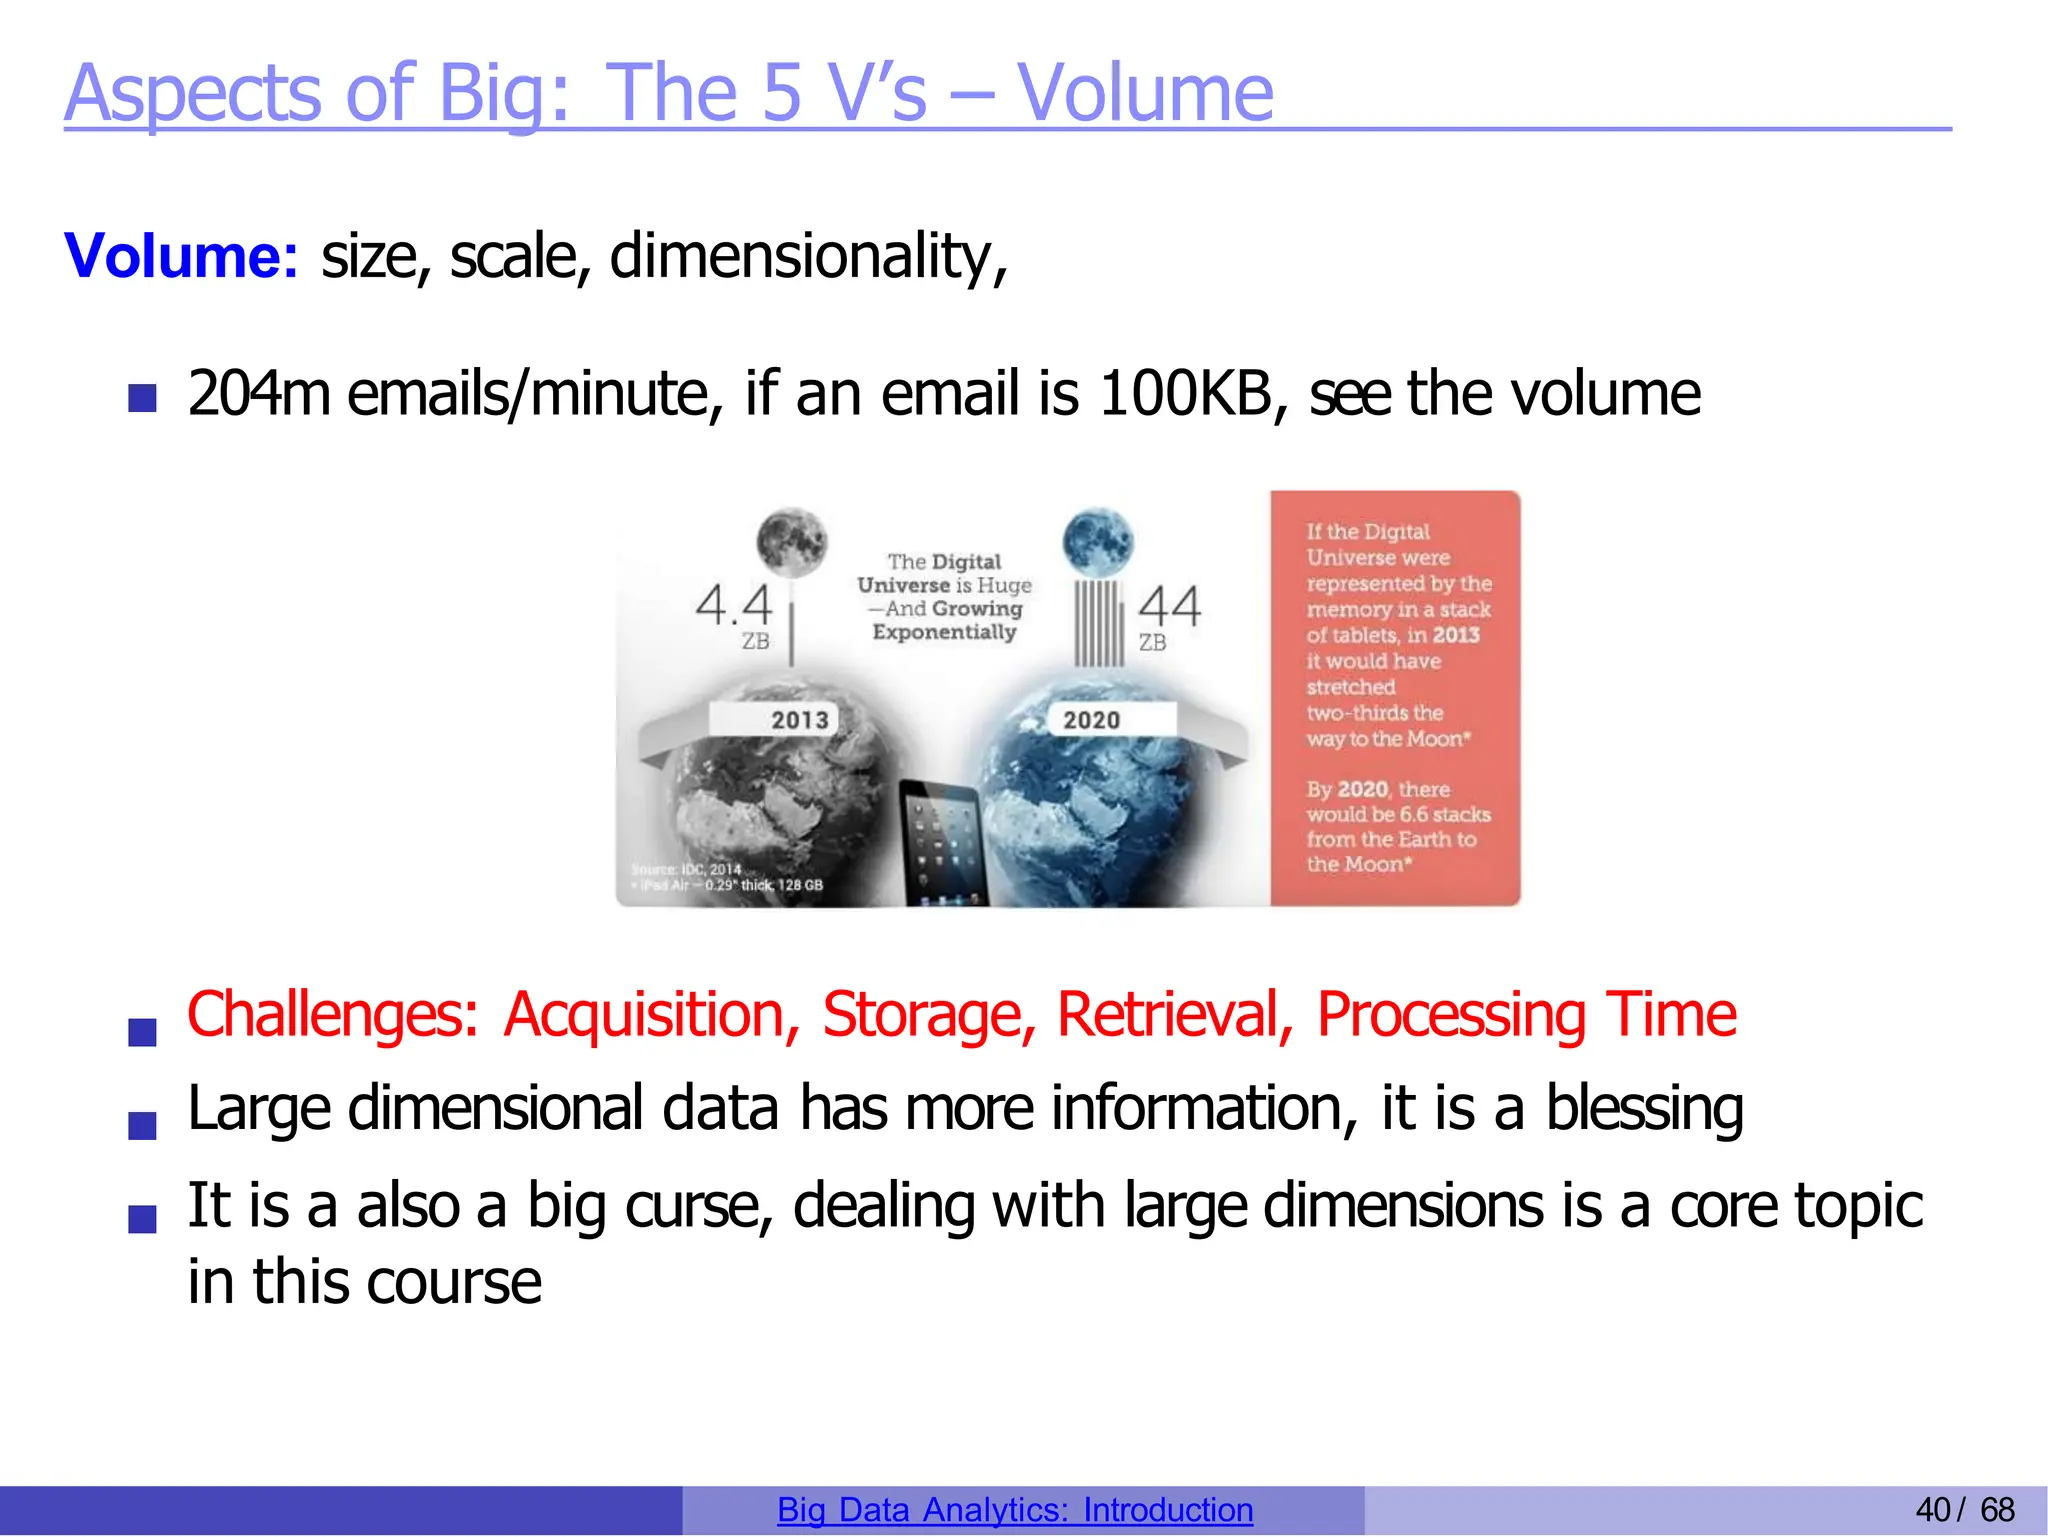
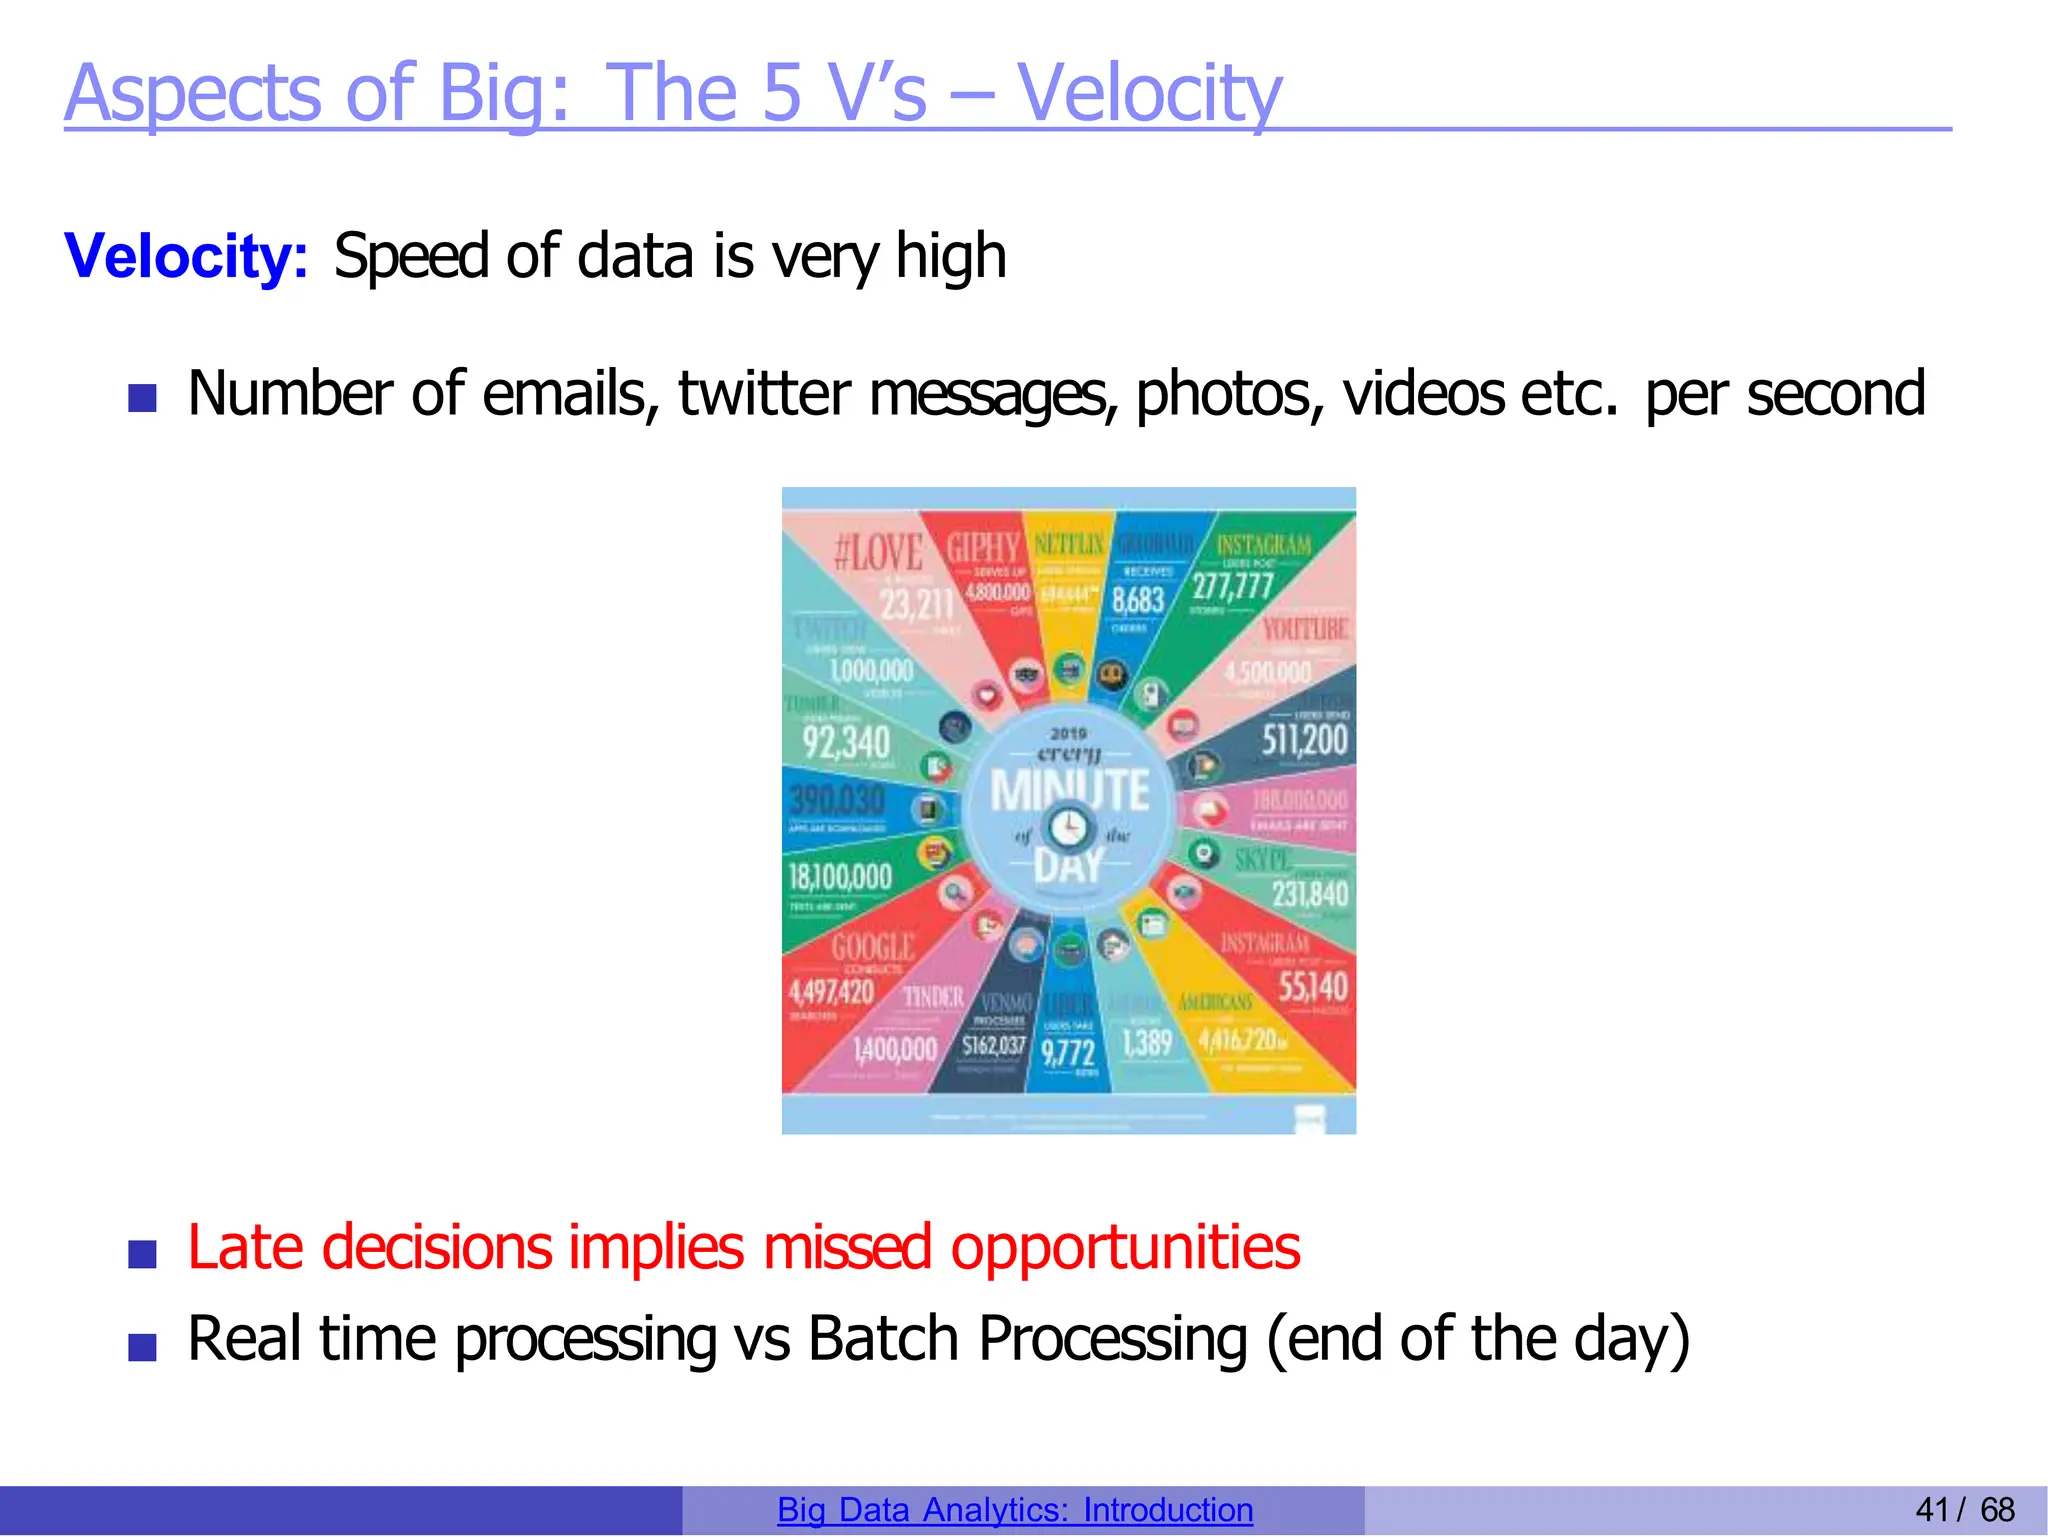
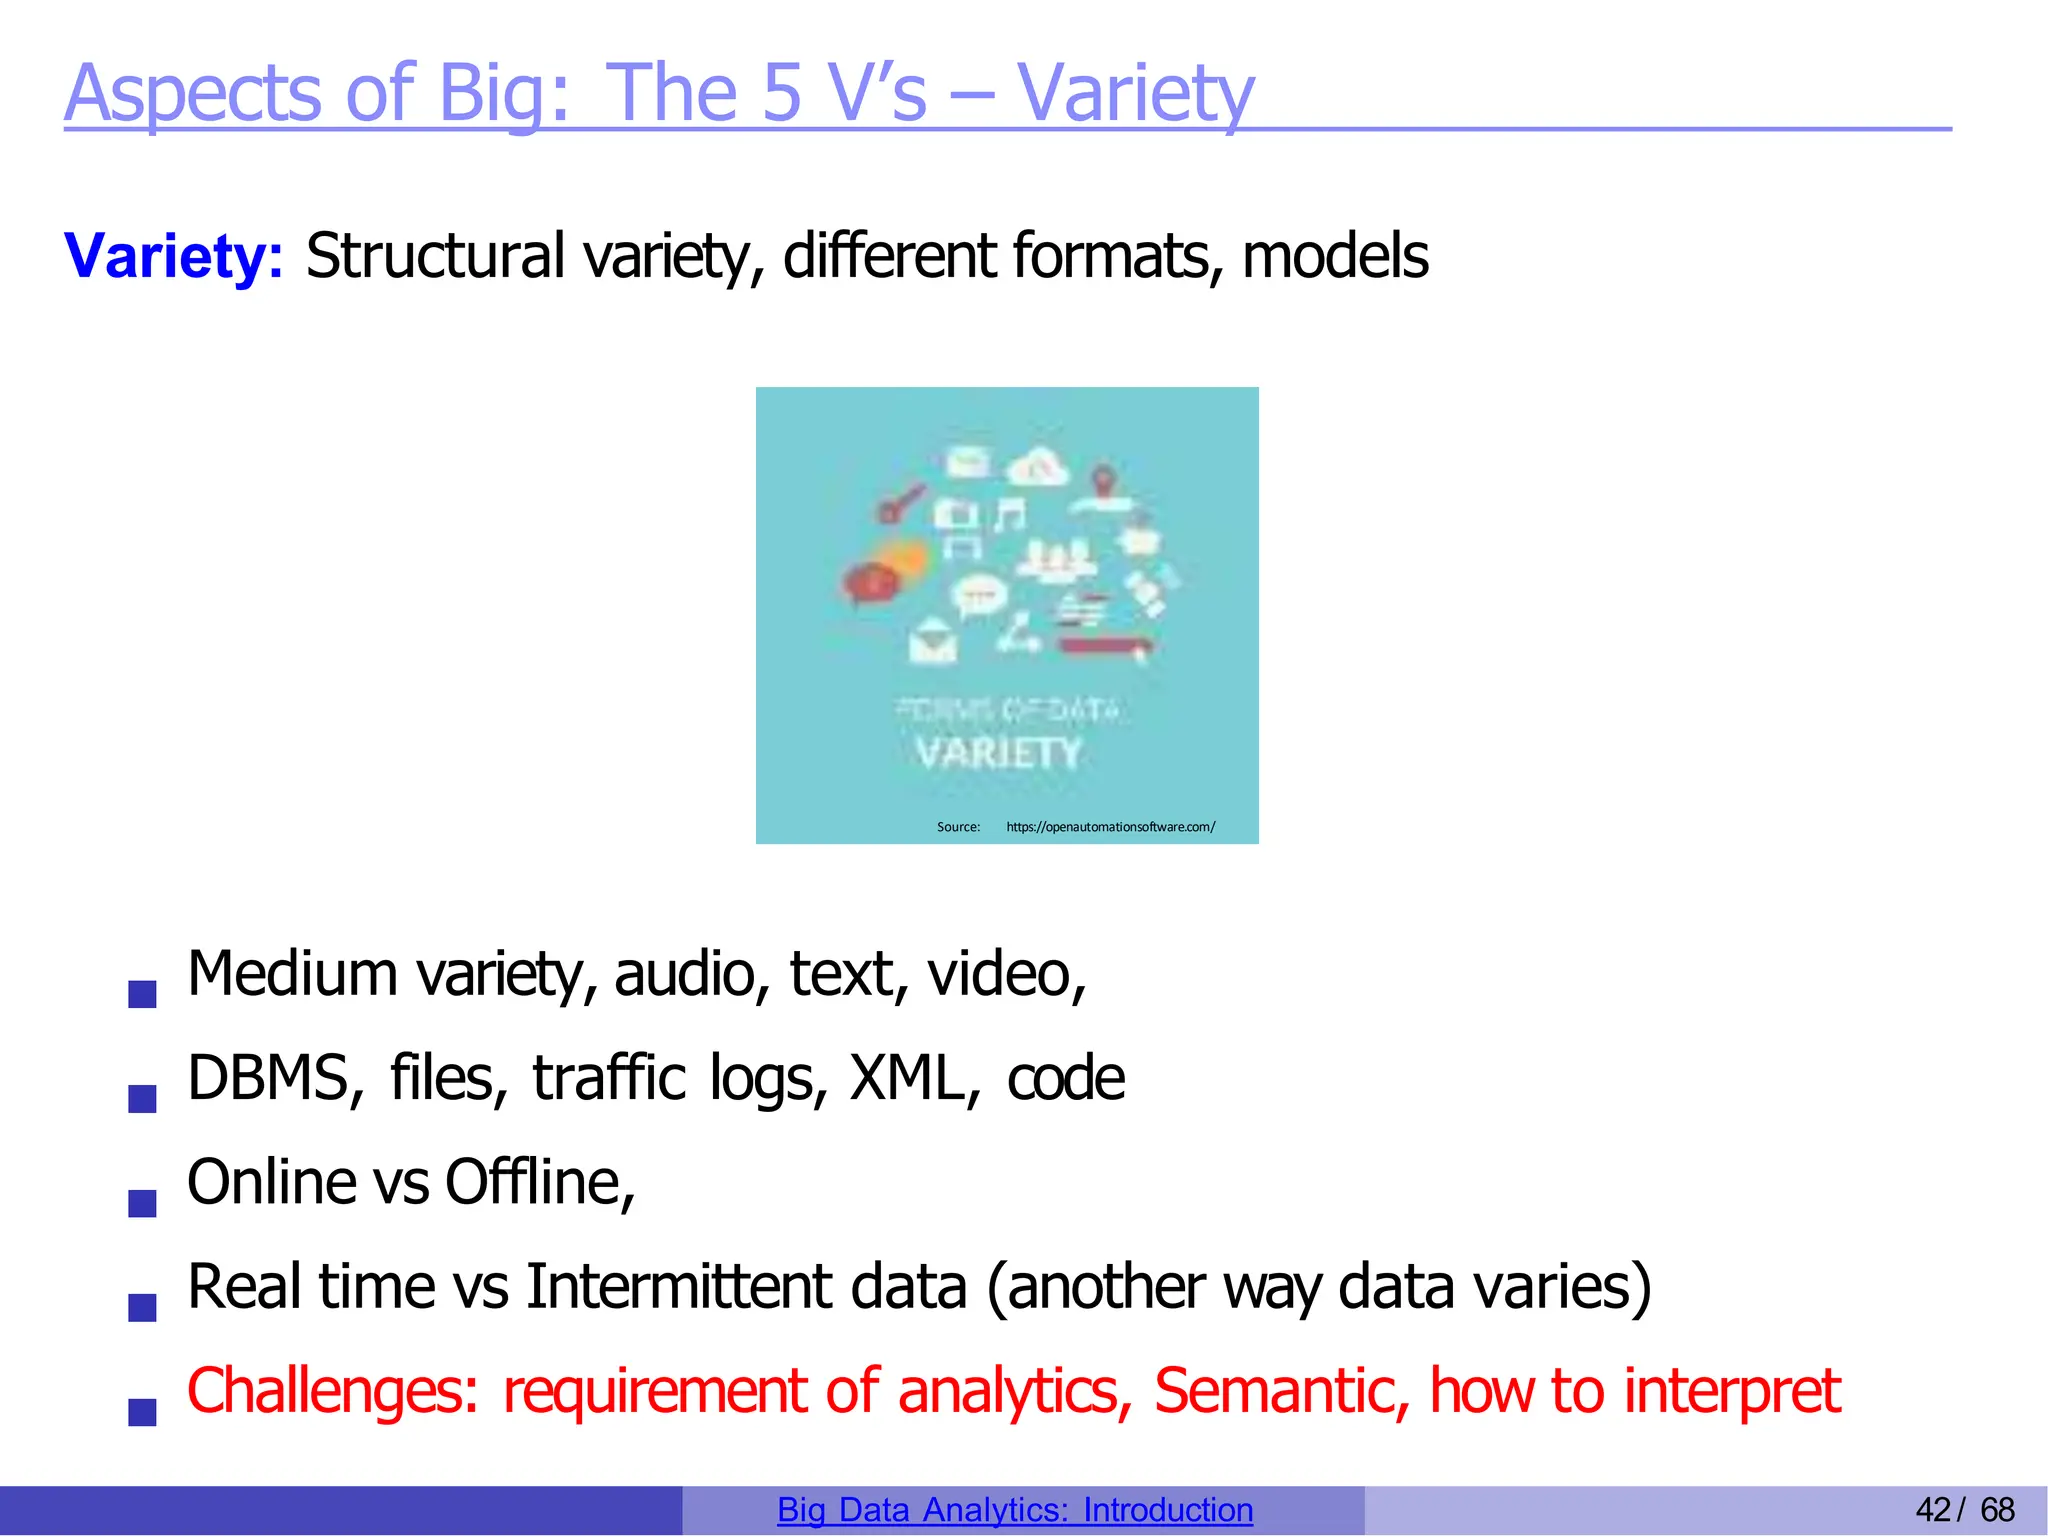
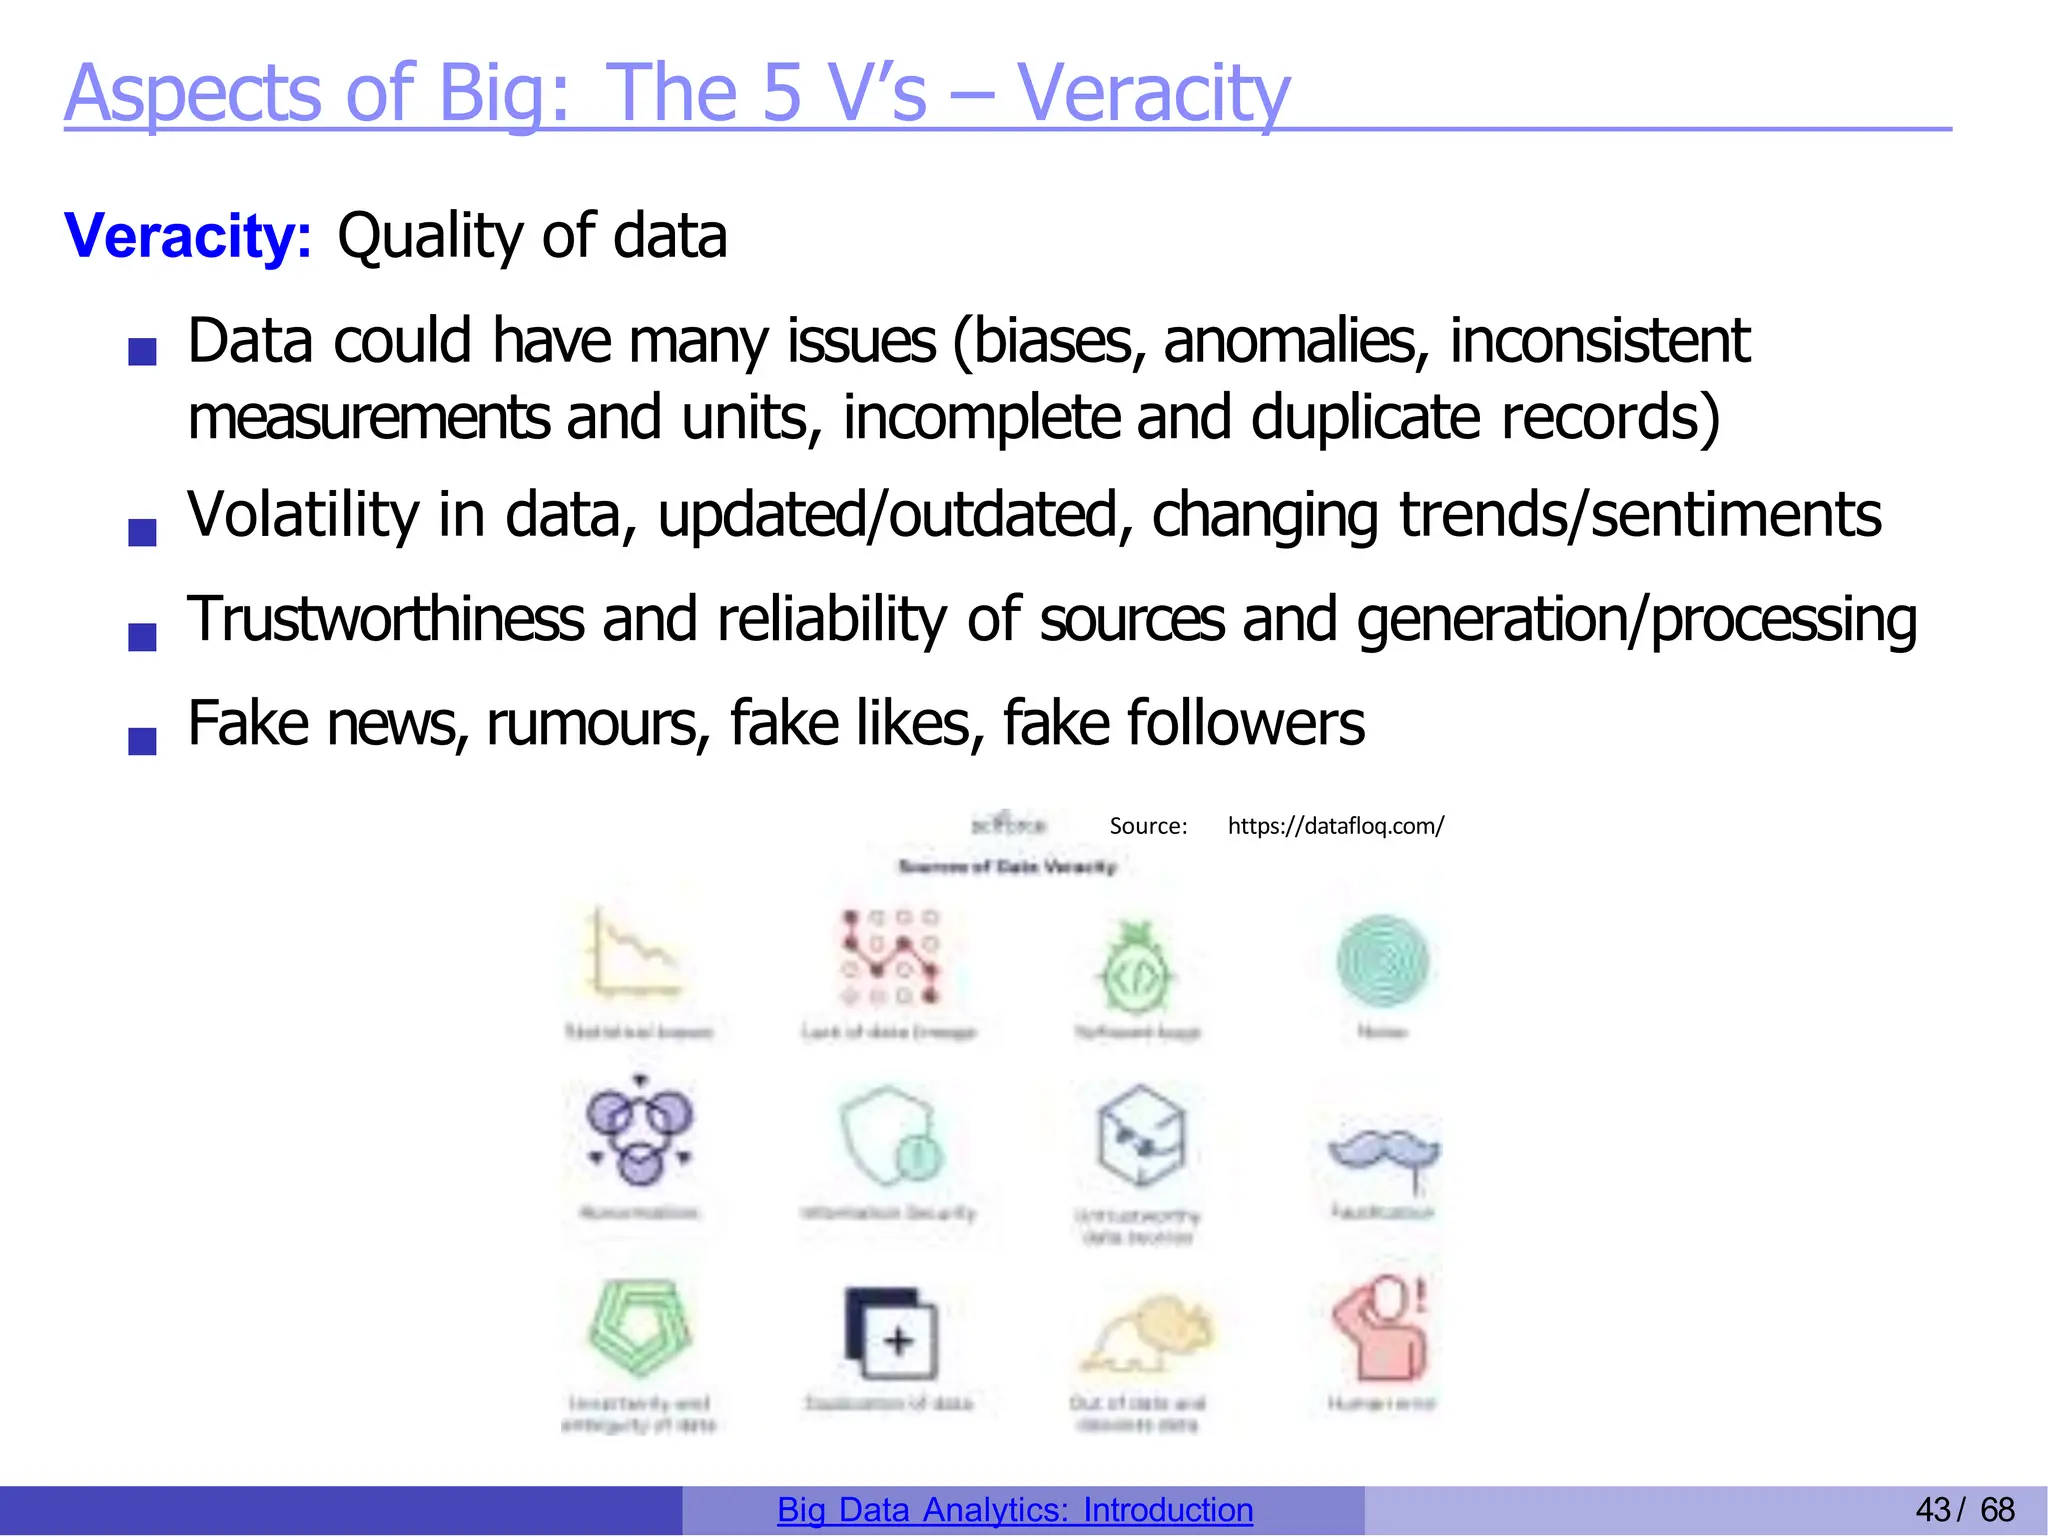
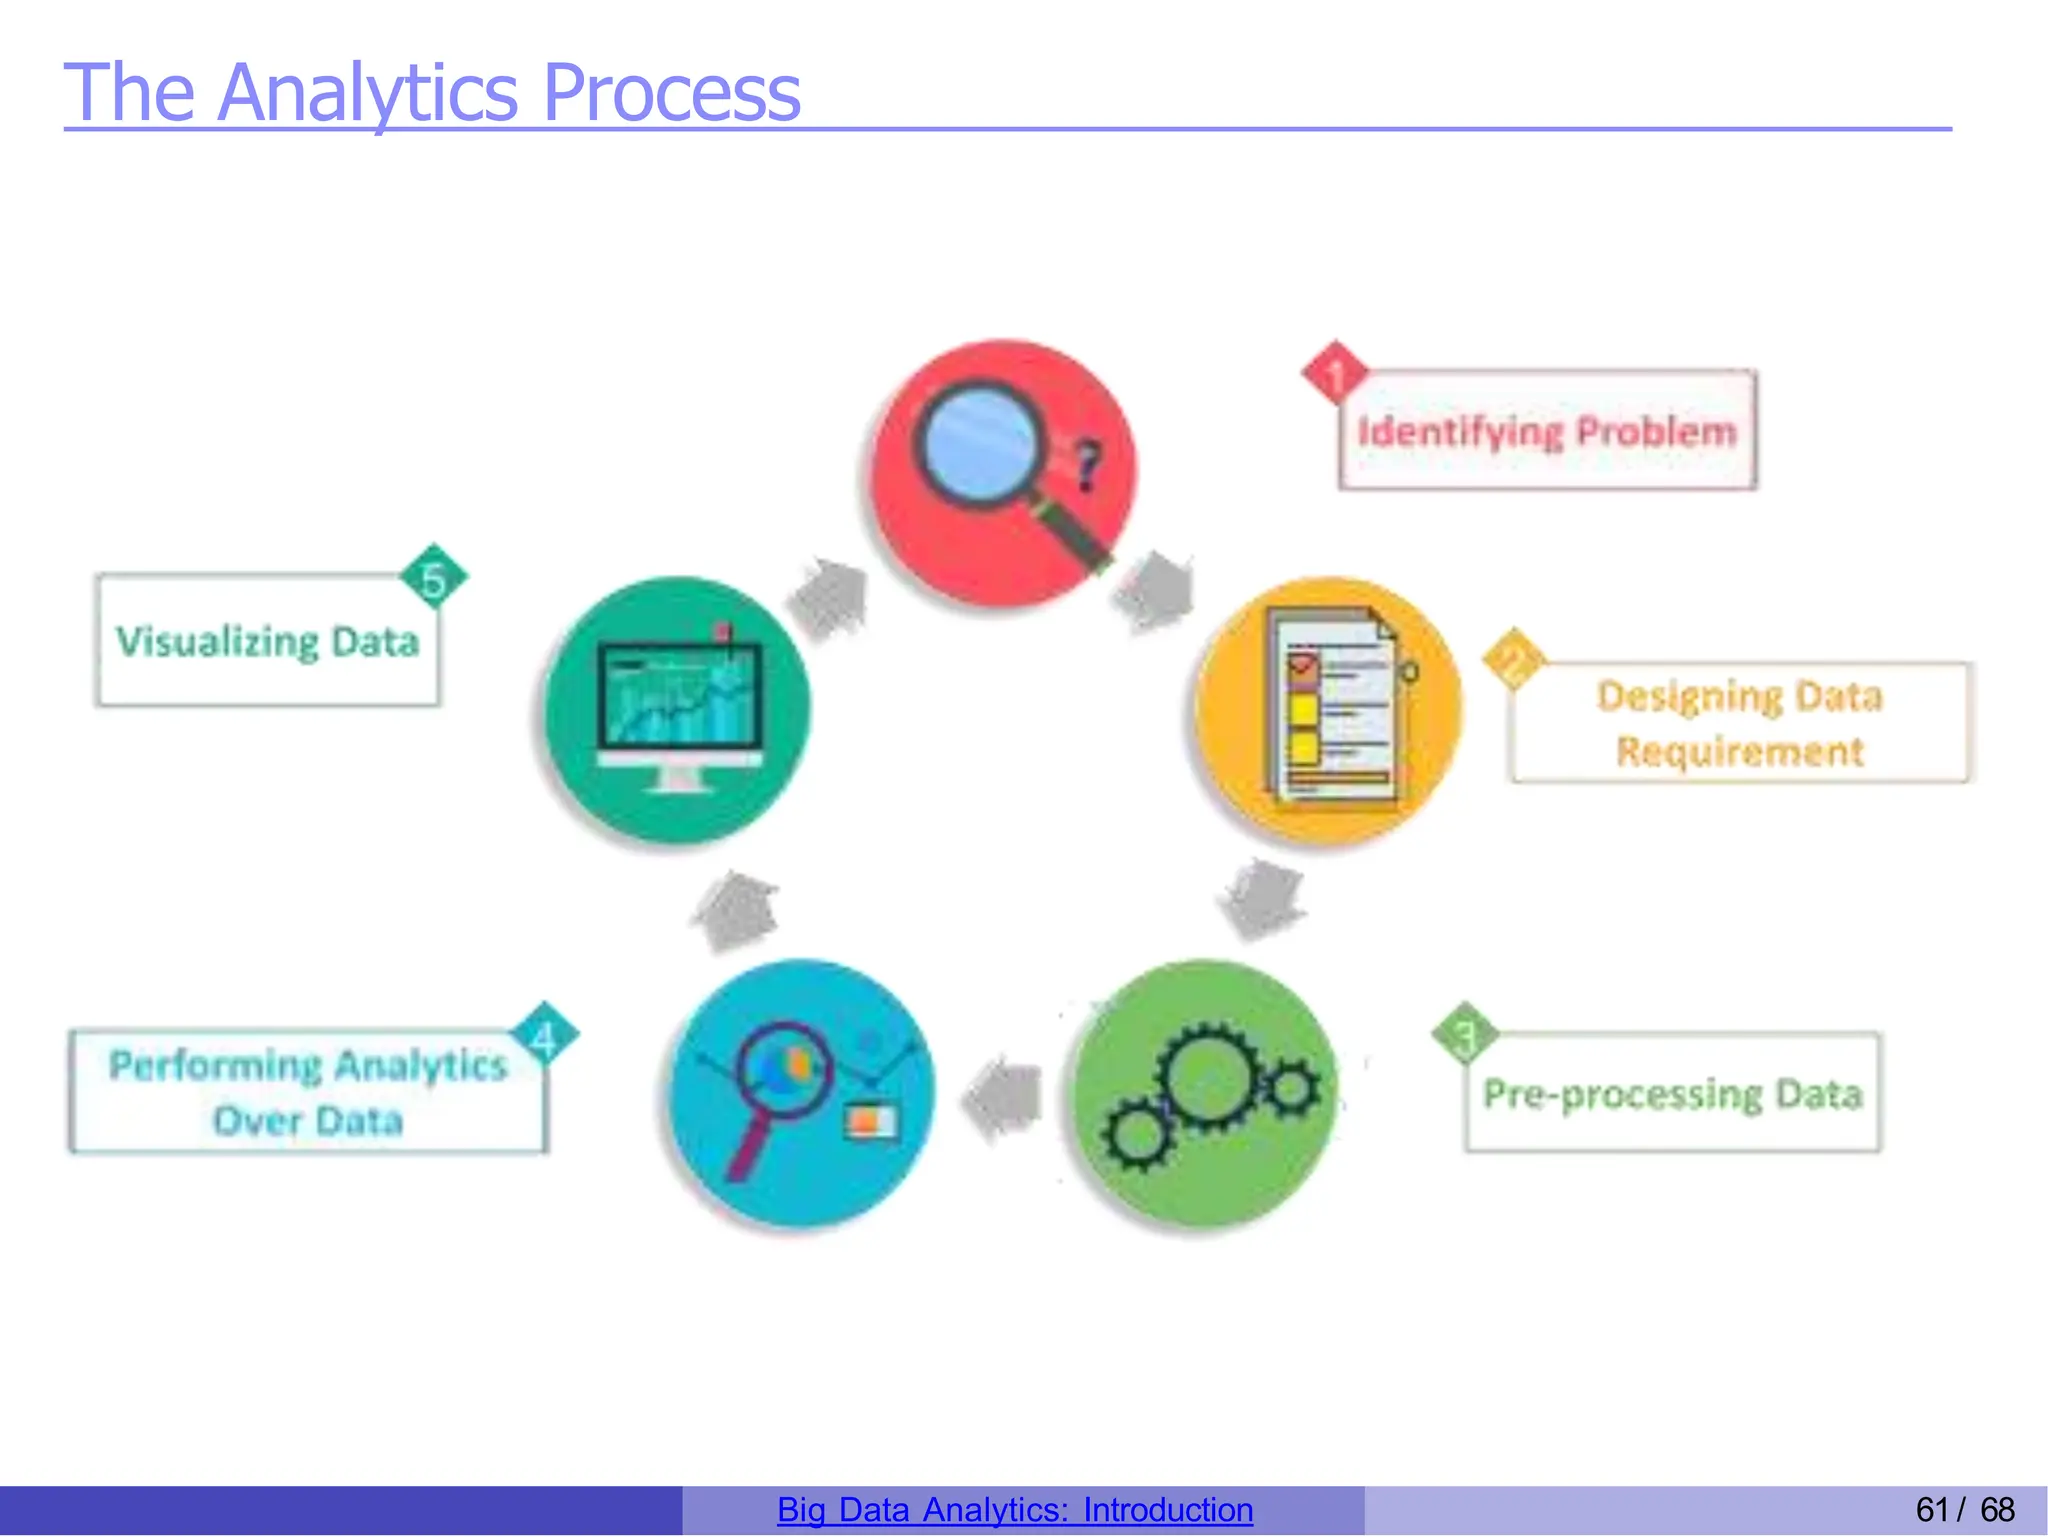
B I G D A TA ANALYTICS
B I G D ATA A N A L Y T I C S
Big Data Generation and Growth
What is Big Data
Importance of Big Data Analytics
Industries benefiting from Data Analytics
Sources of Data (people, machines, organizations)
Aspects of Bigness (The 5 V’s of big data)
Types of Data (table, text, multimedia, stream, sequence, graphs)
The Analytics Process (preprocessing, analytics, visualization)
Big Data Analytics: Introduction 1/ 68
Big Data Generation and Growth
Data has been generated at an exploding rate in recent years
Organizations collect trillions of bytes of information about their
customers, suppliers, and operations every day
Large pools of data is being captured, communicated, aggregated,
stored, and analyzed by businesses, academia, and governments
Individuals with smartphones on social network sites are
continuously fueling the exponential growth of multimedia data
Big Data Analytics: Introduction 2/ 68
Big Data Generation and Growth
expandedramblings.com
Big Data Analytics: Introduction 3/ 68
Big Data Generation and Growth
Where data comes from?
Internet users generate about 2.5 quintillion bytes of data each day1
In 2018, internet users spent 2.8 million years online2
Social media accounts for 33% of the total time spent online 2
In 2019, there were 2.3 billion active Facebook users
Twitter users send nearly half a million tweets every minute1
By 2020, every person will generate 1.7 megabytes in just a second1
By 2020, there will be 40 trillion gigabytes of data (40 zettabytes)3
90% of all data has been created in the last two years 4
1 Domo report (a company with data analytic platform for businesses)
2 Global Web Index report (a company with big data analytic platform)
3
EMC (Dell EMC provides big data solutions)
4
IBM
Big Data Analytics: Introduction 4/ 68
Big Data Generation and Growth
Big Data Analytics: Introduction 5/ 68
Big Data Generation and Growth
90% of all data has been created in the last two years 5
5
IBM
Big Data Analytics: Introduction 6/ 68
What is Big Data
“Big data”: datasets whose size is beyond the ability of typical
database software tools to capture, store, manage, and analyze
As technology advances over time, the size of datasets that qualify
as big data will also increase
The definition varies by sector, depending on the kinds of available
software tools and sizes of datasets in a particular industry
With those caveats, big data in many sectors today will range from
a few dozen terabytes to multiple petabytes (thousands of terabytes)
Big Data Analytics: Introduction 7/ 68
Data Analytics
Data: Set of values of qualitative or quantitative variables
Information: Meaningful or organized data
Data Analytics: The process of examining data in order to draw and
communicate useful conclusions about the information it contains
Source: https://enablecomp.com/
Big Data Analytics: Introduction 8/ 68
Big Data Analytics: Market
Big Data Analytics: Introduction 9/ 68
Data Analytics: Then and Now
Data Analytics has been around for years
Even in 1950’s, businesses were using basic analytics (manual
examination) on data (essentially numbers in a spreadsheet) to
uncover insights and trends
New tools and technologies bring speed and efficiency in techniques
Today, businesses analyze data and can identify insights for
immediate decisions
The ability to work faster and stay agile gives organizations a
competitive edge they did not have before
Big Data Analytics: Introduction 10/ 68
Why is Big Data Analytics Important
Organizations analyze data
to identify new opportunities
to gain insights that lead to smarter business decisions
to identify methods for more efficient operations
to maximize larger revenues and higher profits
to keeps customers satisfied
Top three factors businesses got
the most value in
Cost reduction
Faster, better decision making
New products and services
Big Data Analytics: Introduction 11/ 68
Why enterprises use Big Data Analytics
Companies are using big data analytics for all types of decisions
Big Data Analytics: Introduction 12/ 68
What enterprises use Big Data Analytics for
Competitor Analysis
Online traffic to websites and related social media
Market Analysis
Trends and market segment analysis
Productivity Enhancement
Analyze employees tracking data
Cost Cutting
Reduce energy bills, optimize routes, predict demands, process
efficiency and automation6
Targeted Marketing
Analyze purchasing history and target the right people for a product
Improved Customer Relations
Analyze customer feedback and make adjustments
6
Forbes (01/08/2016) Big Data Analytics’ Potential to Revolutionize Manufacturing Is Within Reach
Big Data Analytics: Introduction 13/ 68
Industries Benefiting from Big Data Analytics
Retail: Advertising, Targeted marketing, recommendation system,
customer loyalty, inventory management, demand prediction
Banking and Financial: Customer loyalty and churn, fraud detection,
risk assessment
Brands: 66% brands use data analytics for product and service
launch, appropriate timings
Logistics and Transportation: Fleet management, maintenance
needs, drivers risk assessment, real time tracking
Health Care: Efficiency in healthcare operations, predictive analytics,
outbreak prediction, immunization strategy
Government & Utility Companies: Surveys & census, development
planning, health, education, energy supply & demand management
Big Data Analytics: Introduction 14/ 68
Industries Benefiting from Big Data Analytics
Big Data Analytics: Introduction 15/ 68
Industries Benefiting from Big Data Analytics
Big Data Analytics: Introduction 16/ 68
Industries Benefiting from Big Data Analytics
Big Data Analytics: Introduction 17/ 68
Industries Benefiting from Big Data Analytics
Big Data Analytics: Introduction 18/ 68
Industries Benefiting from Big Data Analytics
Big Data Analytics: Introduction 19/ 68
Industries Benefiting from Big Data Analytics
Big Data Analytics: Introduction 20/ 68
Industries Benefiting from Big Data Analytics
Big Data Analytics: Introduction 21/ 68
Industries Benefiting from Big Data Analytics
Big Data Analytics: Introduction 22/ 68
Industries Benefiting from Big Data Analytics
Big Data Analytics: Introduction 23/ 68
Industries Benefiting from Big Data Analytics
Big Data Analytics: Introduction 24/ 68
Industries Benefiting from Big Data Analytics
Big Data Analytics: Introduction 25/ 68
Industries Benefiting from Big Data Analytics
Big Data Analytics: Introduction 26/ 68
Industries Benefiting from Big Data Analytics
Big Data Analytics: Introduction 27/ 68
Industries Benefiting from Big Data Analytics
Big Data Analytics: Introduction 28/ 68
Industries Benefiting from Big Data Analytics
Big Data Analytics: Introduction 29/ 68
Big Data Analytics - Market
12% - the rate of increase for big data and business analytics use
from 2018 to 2019 7
$189.1 billion – projected worldwide revenues for big data and
business analytics solutions for 2019 7
$274.3 billion – projected worldwide revenues for big data and
business analytics solutions by 2022 7
13.2% - projected compound annual growth rate (CAGR) of big
data and business analytics within the five-year period, 2018-2022 7
7
International Data Corporation (IDC) - Big data analytics company
Big Data Analytics: Introduction 30/ 68
Big Data Analytics - Market
Big Data Analytics: Introduction 31/ 68
Sources of Big Data
Big Data Analytics: Introduction 32/ 68
Sources of Big Data
Big Data Analytics: Introduction 33/ 68
Sources: Machine Generated Data
Biggest source of big data
Temperature sensors, GPS navigator, Satellite imagery, Apps,
Increasing number of smart devices, IoT
A 12 hours flight produces 84TB of data, sensors, temperature,
pressure, accelerometer, turbulence
Smart City, Smart Transportation
Think about the volume of video data collected at Lahore Safe City
Authority Control Room
Generally, such data is unstructured
Big Data Analytics: Introduction 34/ 68
Sources: People Generated Data
Blogs, social network posts, keywords search, photo sharing,
pictures, emails, ratings and reviews
Daily facebook data 30+ PB > All US Academic libraries (2 PB)
Companies use 12PB/day Twitter data for sentiment analysis
around their products
Could be used for disaster management, e.g. to identify and
measure affected areas and channel resources
Typically unstructured, or at best semi-structured such as emails,
where the header has somewhat of a structure, except in few cases
such as filling up a survey form
Generally more text: 500 million tweets per day
Big Data Analytics: Introduction 35/ 68
Sources: Organization Generated Data
CUI Students Data, ESPN Cricinfo, TCS shipment tracking data
Governments open data, Stock Records, Banks, e-Commerce
Medical Records
Optimize routs and optimal scheduling can save 50m by reducing
each drivers route by one mile
Combine Walmart sales data with Twitter sentiment analyses or
events to launch a new product
Estimate demands
Fraud Detection
Highly Structured Data
Big Data Analytics: Introduction 36/ 68
Categories of Data
Big Data Analytics: Introduction 37/ 68
The 5 V’s of Data
Big Data Analytics: Introduction 38/ 68
Aspects of Big: The 5 V’s
1 Volume
2 Velocity
3 Variety
4 Veracity
5 Value
Big Data Analytics: Introduction 39/ 68
Aspects of Big: The 5 V’s – Volume
Volume: size, scale, dimensionality,
204m emails/minute, if an email is 100KB, see the volume
Challenges: Acquisition, Storage, Retrieval, Processing Time
Large dimensional data has more information, it is a blessing
It is a also a big curse, dealing with large dimensions is a core topic
in this course
Big Data Analytics: Introduction 40/ 68
Aspects of Big: The 5 V’s – Velocity
Velocity: Speed of data is very high
Number of emails, twitter messages, photos, videos etc. per second
Late decisions implies missed opportunities
Real time processing vs Batch Processing (end of the day)
Big Data Analytics: Introduction 41/ 68
Aspects of Big: The 5 V’s – Variety
Variety: Structural variety, different formats, models
Source: https://openautomationsoftware.com/
Medium variety, audio, text, video,
DBMS, files, traffic logs, XML, code
Online vs Offline,
Real time vs Intermittent data (another way data varies)
Challenges: requirement of analytics, Semantic, how to interpret
Big Data Analytics: Introduction 42/ 68
Aspects of Big: The 5 V’s – Veracity
Veracity: Quality of data
Data could have many issues (biases, anomalies, inconsistent
measurements and units, incomplete and duplicate records)
Volatility in data, updated/outdated, changing trends/sentiments
Trustworthiness and reliability of sources and generation/processing
Fake news, rumours, fake likes, fake followers
Source: https://datafloq.com/
Big Data Analytics: Introduction 43/ 68
Aspects of Big: The 5 V’s – Value
Value: Data can be turned into big value
Data having no value is of no good to the company
Should be able to meet strategic objectives
Should amplify other technology innovations
Big Data Analytics: Introduction 44/ 68
5 Vs of Big Data: Value
The Economist Intelligence Unit report on surveying 476 executives
60% feel that data is generating revenue within their organizations
83% say it is making existing services and products more profitable
63% executives based in Asia said they are routinely generating
value from data
In the US, the figure was 58% and in Europe, 56%
Big Data Analytics: Introduction 45/ 68
5 Vs of Big Data: Value
McKinsey Global Institute (May 2011)
Big Data - The Next Frontier of Innovation,
Competition and Productivity
Big Data Analytics: Introduction 46/ 68
5 Vs of Big Data: Value
Big Data Analytics: Introduction 47/ 68
5 Vs of Big Data: Value
Big Data Analytics: Introduction 48/ 68
Types of Data
Big Data Analytics: Introduction 49/ 68
Types of Data
Relational Data
Text Data
Multimedia Data
Time Series Data
Sequential Data
Streams
Graphs and Homogeneous Networks
Graphs and Heterogeneous Networks
Big Data Analytics: Introduction 50/ 68
Types of Data: Text
blogs, webpages, tweets, documents, emails
High dimensionality, vocabulary, information retrieval, natural
language processing
Latest search engine for Walmart.com uses text analysis, machine
learning and even synonym mining to produce relevant search
results. Wal-Mart says adding semantic search has improved online
shoppers completing a purchase by 10% to 15%. ”In Wal-Mart
terms, that is billions of dollars,”
Big Data Analytics: Introduction 51/ 68
Types of Data: Multimedia
image, audio, video
‘Fast food and video’ company is training cameras on drive-through
lanes to determine what to display on its digital menu board. When
the lines are longer, the menu features products that can be served
up quickly; when the lines are shorter, the menu features
higher-margin items that take longer to prepare
Big Data Analytics: Introduction 52/ 68
Types of Data: Time Series
Sequence of data points at equally spaced time intervals
Sensor data, Stock market data, Forex rates, Temporal tracking
(GPS), Smart Meters Data (AMI)
Understanding the underlying forces and structure of observed data
and fit a model to forecast, monitor or control
Economic Forecasting, Sales Forecasting, Stock Market Analysis,
Yield Projections, Process and Quality Control, Inventory Studies,
Workload Projections, Census Analysis
market momentum
Application of Time Series Analysis in Financial Economics by @Statswork https://link.medium.com/n3FJPzhIadb
Big Data Analytics: Introduction 53/ 68
Types of Data: Sequential Data
Bio-sequences
Discretized music and audio data
Text
Source: Sijo Asokan (slideshare.net)
Big Data Analytics: Introduction 54/ 68
Types of Data: Streams
Real time data
Single pass algorithms/online algorithms
Irreversible decisions
Small memory algorithms
Big Data Analytics: Introduction 55/ 68
Types of Data: Graphs/Homogeneous Networks
G = (V ,E ), data items represented as graphs
Could have similarity on edges
Could have weights on vertices, edges or both
Facebook, webgraph, twitter, co-authorship graphs (bibliometric),
citation networks
Big Data Analytics: Introduction 56/ 68
Types of Data: Heterogeneous Networks
Nodes represent different entities
Authors and conferences
Big Data Analytics: Introduction 57/ 68
Data Analytics: Process and Tasks
Big Data Analytics: Introduction 58/ 68
The Analytics Process
Business Objective
Why we are seeking data analytics in the first place?
How can we reduce production costs without sacrificing quality?
What are some ways to increase sales with our current resources?
Do customers view our brand in a favorable way?
Data Collection
What data is needed and available?
Identify sources of data and relevance of data
Are there enough instances, are all relevant features there?
Identify datasets, acquire and retrieve
Sources RDBMS, .txt, webservices (soup), RSS, tweets
Experiments, synthetic data generation, Survey
Big Data Analytics: Introduction 59/ 68
The Analytics Process
Data Preparation
Make the data ready for analytics
Exploratory Data Analysis Describe, Summarize, Visualize
Pre-process: Improve data quality, clean data, transformation,
standardization, normalization
Data Analysis
Apply analytical techniques
Supervised and unsupervised learning, Graph analytics
Report and Deployment
Communicate results and findings, and apply conclusions to gain
benefit
Big Data Analytics: Introduction 60/ 68
The Analytics Process
Big Data Analytics: Introduction 61/ 68
Data Analytics Tasks and Methods
Data Analytics is the process
to discover patterns in data
to find relationships in data
to (automatically) extract knowledge from data
to summarize data in ways that are understandable and useful
Discovering knowledge form data often requires learning
Big Data Analytics: Introduction 62/ 68
Data Analytics Tasks and Methods
Descriptive Analytics
Uncover patterns, correlations, trends & trajectories describing data
Explanatory in nature
Require post-processing to validate and explain the results
Clustering/grouping the data or Detecting outliers (anomalies) in data
Predictive Analytics
Predict value of a attribute based on values of other attributes
Predicted attribute: Target/dependent/response variable
Attributes used to predict: Predictor/explanatory/independent variables
Classification: nominal target attribute (class labels)
Regression: numeric target attribute
Big Data Analytics: Introduction 63/ 68
Data Analytics Taks
Clustering: Partition data into meaningful groups
Outlier Detection: Detect points that are unusual (unlike others)
Classification: Assign (predefined) class labels to each object
Regression: Find a function that models (continuous) target variable
Association Analysis: Find patterns in data that describe
relationships
Recommendation: Predict an unknown rating based on known
ratings
Community Detection: Find (overlapping) communities of nodes in
networks
Centrality and Important nodes: Find important (or evaluate
importance of) nodes in networks
Big Data Analytics: Introduction 64/ 68
Machine Learning for Data Analytics
Supervised Learning
For some data items the correct results (values of the target
variable) are given (ground truth)
We want to learn a model that generalizes i.e. the model is able to
perform accurately on new/unseen/unlabeled data items
Classification, where the target is a categorical attribute
Regression, where the target is a continuous attribute
Training Data
Known Labels
Model
Test Data
Predict Target Variable Values
Big Data Analytics: Introduction 65/ 68
Machine Learning for Data Analytics
Regression
x1
x2
Binary Classification Multi-Class Classification
x1
x2
Big Data Analytics: Introduction 66/ 68
Machine Learning for Data Analytics
Unsupervised Learning
No correct output is provided
Learning and analytics is done using statistical properties of data
Clustering
Outlier detection
Modeling the density of data
Dimensionality reduction
Big Data Analytics: Introduction 67/ 68
Data Analytics Tasks and Methods
Big Data Analytics: Introduction 68/ 68

Lec_1_Introduction_to_Big_Data_Analytics.pptx

  • 1.
    B I GD A TA ANALYTICS B I G D ATA A N A L Y T I C S Big Data Generation and Growth What is Big Data Importance of Big Data Analytics Industries benefiting from Data Analytics Sources of Data (people, machines, organizations) Aspects of Bigness (The 5 V’s of big data) Types of Data (table, text, multimedia, stream, sequence, graphs) The Analytics Process (preprocessing, analytics, visualization) Big Data Analytics: Introduction 1/ 68
  • 2.
    Big Data Generationand Growth Data has been generated at an exploding rate in recent years Organizations collect trillions of bytes of information about their customers, suppliers, and operations every day Large pools of data is being captured, communicated, aggregated, stored, and analyzed by businesses, academia, and governments Individuals with smartphones on social network sites are continuously fueling the exponential growth of multimedia data Big Data Analytics: Introduction 2/ 68
  • 3.
    Big Data Generationand Growth expandedramblings.com Big Data Analytics: Introduction 3/ 68
  • 4.
    Big Data Generationand Growth Where data comes from? Internet users generate about 2.5 quintillion bytes of data each day1 In 2018, internet users spent 2.8 million years online2 Social media accounts for 33% of the total time spent online 2 In 2019, there were 2.3 billion active Facebook users Twitter users send nearly half a million tweets every minute1 By 2020, every person will generate 1.7 megabytes in just a second1 By 2020, there will be 40 trillion gigabytes of data (40 zettabytes)3 90% of all data has been created in the last two years 4 1 Domo report (a company with data analytic platform for businesses) 2 Global Web Index report (a company with big data analytic platform) 3 EMC (Dell EMC provides big data solutions) 4 IBM Big Data Analytics: Introduction 4/ 68
  • 5.
    Big Data Generationand Growth Big Data Analytics: Introduction 5/ 68
  • 6.
    Big Data Generationand Growth 90% of all data has been created in the last two years 5 5 IBM Big Data Analytics: Introduction 6/ 68
  • 7.
    What is BigData “Big data”: datasets whose size is beyond the ability of typical database software tools to capture, store, manage, and analyze As technology advances over time, the size of datasets that qualify as big data will also increase The definition varies by sector, depending on the kinds of available software tools and sizes of datasets in a particular industry With those caveats, big data in many sectors today will range from a few dozen terabytes to multiple petabytes (thousands of terabytes) Big Data Analytics: Introduction 7/ 68
  • 8.
    Data Analytics Data: Setof values of qualitative or quantitative variables Information: Meaningful or organized data Data Analytics: The process of examining data in order to draw and communicate useful conclusions about the information it contains Source: https://enablecomp.com/ Big Data Analytics: Introduction 8/ 68
  • 9.
    Big Data Analytics:Market Big Data Analytics: Introduction 9/ 68
  • 10.
    Data Analytics: Thenand Now Data Analytics has been around for years Even in 1950’s, businesses were using basic analytics (manual examination) on data (essentially numbers in a spreadsheet) to uncover insights and trends New tools and technologies bring speed and efficiency in techniques Today, businesses analyze data and can identify insights for immediate decisions The ability to work faster and stay agile gives organizations a competitive edge they did not have before Big Data Analytics: Introduction 10/ 68
  • 11.
    Why is BigData Analytics Important Organizations analyze data to identify new opportunities to gain insights that lead to smarter business decisions to identify methods for more efficient operations to maximize larger revenues and higher profits to keeps customers satisfied Top three factors businesses got the most value in Cost reduction Faster, better decision making New products and services Big Data Analytics: Introduction 11/ 68
  • 12.
    Why enterprises useBig Data Analytics Companies are using big data analytics for all types of decisions Big Data Analytics: Introduction 12/ 68
  • 13.
    What enterprises useBig Data Analytics for Competitor Analysis Online traffic to websites and related social media Market Analysis Trends and market segment analysis Productivity Enhancement Analyze employees tracking data Cost Cutting Reduce energy bills, optimize routes, predict demands, process efficiency and automation6 Targeted Marketing Analyze purchasing history and target the right people for a product Improved Customer Relations Analyze customer feedback and make adjustments 6 Forbes (01/08/2016) Big Data Analytics’ Potential to Revolutionize Manufacturing Is Within Reach Big Data Analytics: Introduction 13/ 68
  • 14.
    Industries Benefiting fromBig Data Analytics Retail: Advertising, Targeted marketing, recommendation system, customer loyalty, inventory management, demand prediction Banking and Financial: Customer loyalty and churn, fraud detection, risk assessment Brands: 66% brands use data analytics for product and service launch, appropriate timings Logistics and Transportation: Fleet management, maintenance needs, drivers risk assessment, real time tracking Health Care: Efficiency in healthcare operations, predictive analytics, outbreak prediction, immunization strategy Government & Utility Companies: Surveys & census, development planning, health, education, energy supply & demand management Big Data Analytics: Introduction 14/ 68
  • 15.
    Industries Benefiting fromBig Data Analytics Big Data Analytics: Introduction 15/ 68
  • 16.
    Industries Benefiting fromBig Data Analytics Big Data Analytics: Introduction 16/ 68
  • 17.
    Industries Benefiting fromBig Data Analytics Big Data Analytics: Introduction 17/ 68
  • 18.
    Industries Benefiting fromBig Data Analytics Big Data Analytics: Introduction 18/ 68
  • 19.
    Industries Benefiting fromBig Data Analytics Big Data Analytics: Introduction 19/ 68
  • 20.
    Industries Benefiting fromBig Data Analytics Big Data Analytics: Introduction 20/ 68
  • 21.
    Industries Benefiting fromBig Data Analytics Big Data Analytics: Introduction 21/ 68
  • 22.
    Industries Benefiting fromBig Data Analytics Big Data Analytics: Introduction 22/ 68
  • 23.
    Industries Benefiting fromBig Data Analytics Big Data Analytics: Introduction 23/ 68
  • 24.
    Industries Benefiting fromBig Data Analytics Big Data Analytics: Introduction 24/ 68
  • 25.
    Industries Benefiting fromBig Data Analytics Big Data Analytics: Introduction 25/ 68
  • 26.
    Industries Benefiting fromBig Data Analytics Big Data Analytics: Introduction 26/ 68
  • 27.
    Industries Benefiting fromBig Data Analytics Big Data Analytics: Introduction 27/ 68
  • 28.
    Industries Benefiting fromBig Data Analytics Big Data Analytics: Introduction 28/ 68
  • 29.
    Industries Benefiting fromBig Data Analytics Big Data Analytics: Introduction 29/ 68
  • 30.
    Big Data Analytics- Market 12% - the rate of increase for big data and business analytics use from 2018 to 2019 7 $189.1 billion – projected worldwide revenues for big data and business analytics solutions for 2019 7 $274.3 billion – projected worldwide revenues for big data and business analytics solutions by 2022 7 13.2% - projected compound annual growth rate (CAGR) of big data and business analytics within the five-year period, 2018-2022 7 7 International Data Corporation (IDC) - Big data analytics company Big Data Analytics: Introduction 30/ 68
  • 31.
    Big Data Analytics- Market Big Data Analytics: Introduction 31/ 68
  • 32.
    Sources of BigData Big Data Analytics: Introduction 32/ 68
  • 33.
    Sources of BigData Big Data Analytics: Introduction 33/ 68
  • 34.
    Sources: Machine GeneratedData Biggest source of big data Temperature sensors, GPS navigator, Satellite imagery, Apps, Increasing number of smart devices, IoT A 12 hours flight produces 84TB of data, sensors, temperature, pressure, accelerometer, turbulence Smart City, Smart Transportation Think about the volume of video data collected at Lahore Safe City Authority Control Room Generally, such data is unstructured Big Data Analytics: Introduction 34/ 68
  • 35.
    Sources: People GeneratedData Blogs, social network posts, keywords search, photo sharing, pictures, emails, ratings and reviews Daily facebook data 30+ PB > All US Academic libraries (2 PB) Companies use 12PB/day Twitter data for sentiment analysis around their products Could be used for disaster management, e.g. to identify and measure affected areas and channel resources Typically unstructured, or at best semi-structured such as emails, where the header has somewhat of a structure, except in few cases such as filling up a survey form Generally more text: 500 million tweets per day Big Data Analytics: Introduction 35/ 68
  • 36.
    Sources: Organization GeneratedData CUI Students Data, ESPN Cricinfo, TCS shipment tracking data Governments open data, Stock Records, Banks, e-Commerce Medical Records Optimize routs and optimal scheduling can save 50m by reducing each drivers route by one mile Combine Walmart sales data with Twitter sentiment analyses or events to launch a new product Estimate demands Fraud Detection Highly Structured Data Big Data Analytics: Introduction 36/ 68
  • 37.
    Categories of Data BigData Analytics: Introduction 37/ 68
  • 38.
    The 5 V’sof Data Big Data Analytics: Introduction 38/ 68
  • 39.
    Aspects of Big:The 5 V’s 1 Volume 2 Velocity 3 Variety 4 Veracity 5 Value Big Data Analytics: Introduction 39/ 68
  • 40.
    Aspects of Big:The 5 V’s – Volume Volume: size, scale, dimensionality, 204m emails/minute, if an email is 100KB, see the volume Challenges: Acquisition, Storage, Retrieval, Processing Time Large dimensional data has more information, it is a blessing It is a also a big curse, dealing with large dimensions is a core topic in this course Big Data Analytics: Introduction 40/ 68
  • 41.
    Aspects of Big:The 5 V’s – Velocity Velocity: Speed of data is very high Number of emails, twitter messages, photos, videos etc. per second Late decisions implies missed opportunities Real time processing vs Batch Processing (end of the day) Big Data Analytics: Introduction 41/ 68
  • 42.
    Aspects of Big:The 5 V’s – Variety Variety: Structural variety, different formats, models Source: https://openautomationsoftware.com/ Medium variety, audio, text, video, DBMS, files, traffic logs, XML, code Online vs Offline, Real time vs Intermittent data (another way data varies) Challenges: requirement of analytics, Semantic, how to interpret Big Data Analytics: Introduction 42/ 68
  • 43.
    Aspects of Big:The 5 V’s – Veracity Veracity: Quality of data Data could have many issues (biases, anomalies, inconsistent measurements and units, incomplete and duplicate records) Volatility in data, updated/outdated, changing trends/sentiments Trustworthiness and reliability of sources and generation/processing Fake news, rumours, fake likes, fake followers Source: https://datafloq.com/ Big Data Analytics: Introduction 43/ 68
  • 44.
    Aspects of Big:The 5 V’s – Value Value: Data can be turned into big value Data having no value is of no good to the company Should be able to meet strategic objectives Should amplify other technology innovations Big Data Analytics: Introduction 44/ 68
  • 45.
    5 Vs ofBig Data: Value The Economist Intelligence Unit report on surveying 476 executives 60% feel that data is generating revenue within their organizations 83% say it is making existing services and products more profitable 63% executives based in Asia said they are routinely generating value from data In the US, the figure was 58% and in Europe, 56% Big Data Analytics: Introduction 45/ 68
  • 46.
    5 Vs ofBig Data: Value McKinsey Global Institute (May 2011) Big Data - The Next Frontier of Innovation, Competition and Productivity Big Data Analytics: Introduction 46/ 68
  • 47.
    5 Vs ofBig Data: Value Big Data Analytics: Introduction 47/ 68
  • 48.
    5 Vs ofBig Data: Value Big Data Analytics: Introduction 48/ 68
  • 49.
    Types of Data BigData Analytics: Introduction 49/ 68
  • 50.
    Types of Data RelationalData Text Data Multimedia Data Time Series Data Sequential Data Streams Graphs and Homogeneous Networks Graphs and Heterogeneous Networks Big Data Analytics: Introduction 50/ 68
  • 51.
    Types of Data:Text blogs, webpages, tweets, documents, emails High dimensionality, vocabulary, information retrieval, natural language processing Latest search engine for Walmart.com uses text analysis, machine learning and even synonym mining to produce relevant search results. Wal-Mart says adding semantic search has improved online shoppers completing a purchase by 10% to 15%. ”In Wal-Mart terms, that is billions of dollars,” Big Data Analytics: Introduction 51/ 68
  • 52.
    Types of Data:Multimedia image, audio, video ‘Fast food and video’ company is training cameras on drive-through lanes to determine what to display on its digital menu board. When the lines are longer, the menu features products that can be served up quickly; when the lines are shorter, the menu features higher-margin items that take longer to prepare Big Data Analytics: Introduction 52/ 68
  • 53.
    Types of Data:Time Series Sequence of data points at equally spaced time intervals Sensor data, Stock market data, Forex rates, Temporal tracking (GPS), Smart Meters Data (AMI) Understanding the underlying forces and structure of observed data and fit a model to forecast, monitor or control Economic Forecasting, Sales Forecasting, Stock Market Analysis, Yield Projections, Process and Quality Control, Inventory Studies, Workload Projections, Census Analysis market momentum Application of Time Series Analysis in Financial Economics by @Statswork https://link.medium.com/n3FJPzhIadb Big Data Analytics: Introduction 53/ 68
  • 54.
    Types of Data:Sequential Data Bio-sequences Discretized music and audio data Text Source: Sijo Asokan (slideshare.net) Big Data Analytics: Introduction 54/ 68
  • 55.
    Types of Data:Streams Real time data Single pass algorithms/online algorithms Irreversible decisions Small memory algorithms Big Data Analytics: Introduction 55/ 68
  • 56.
    Types of Data:Graphs/Homogeneous Networks G = (V ,E ), data items represented as graphs Could have similarity on edges Could have weights on vertices, edges or both Facebook, webgraph, twitter, co-authorship graphs (bibliometric), citation networks Big Data Analytics: Introduction 56/ 68
  • 57.
    Types of Data:Heterogeneous Networks Nodes represent different entities Authors and conferences Big Data Analytics: Introduction 57/ 68
  • 58.
    Data Analytics: Processand Tasks Big Data Analytics: Introduction 58/ 68
  • 59.
    The Analytics Process BusinessObjective Why we are seeking data analytics in the first place? How can we reduce production costs without sacrificing quality? What are some ways to increase sales with our current resources? Do customers view our brand in a favorable way? Data Collection What data is needed and available? Identify sources of data and relevance of data Are there enough instances, are all relevant features there? Identify datasets, acquire and retrieve Sources RDBMS, .txt, webservices (soup), RSS, tweets Experiments, synthetic data generation, Survey Big Data Analytics: Introduction 59/ 68
  • 60.
    The Analytics Process DataPreparation Make the data ready for analytics Exploratory Data Analysis Describe, Summarize, Visualize Pre-process: Improve data quality, clean data, transformation, standardization, normalization Data Analysis Apply analytical techniques Supervised and unsupervised learning, Graph analytics Report and Deployment Communicate results and findings, and apply conclusions to gain benefit Big Data Analytics: Introduction 60/ 68
  • 61.
    The Analytics Process BigData Analytics: Introduction 61/ 68
  • 62.
    Data Analytics Tasksand Methods Data Analytics is the process to discover patterns in data to find relationships in data to (automatically) extract knowledge from data to summarize data in ways that are understandable and useful Discovering knowledge form data often requires learning Big Data Analytics: Introduction 62/ 68
  • 63.
    Data Analytics Tasksand Methods Descriptive Analytics Uncover patterns, correlations, trends & trajectories describing data Explanatory in nature Require post-processing to validate and explain the results Clustering/grouping the data or Detecting outliers (anomalies) in data Predictive Analytics Predict value of a attribute based on values of other attributes Predicted attribute: Target/dependent/response variable Attributes used to predict: Predictor/explanatory/independent variables Classification: nominal target attribute (class labels) Regression: numeric target attribute Big Data Analytics: Introduction 63/ 68
  • 64.
    Data Analytics Taks Clustering:Partition data into meaningful groups Outlier Detection: Detect points that are unusual (unlike others) Classification: Assign (predefined) class labels to each object Regression: Find a function that models (continuous) target variable Association Analysis: Find patterns in data that describe relationships Recommendation: Predict an unknown rating based on known ratings Community Detection: Find (overlapping) communities of nodes in networks Centrality and Important nodes: Find important (or evaluate importance of) nodes in networks Big Data Analytics: Introduction 64/ 68
  • 65.
    Machine Learning forData Analytics Supervised Learning For some data items the correct results (values of the target variable) are given (ground truth) We want to learn a model that generalizes i.e. the model is able to perform accurately on new/unseen/unlabeled data items Classification, where the target is a categorical attribute Regression, where the target is a continuous attribute Training Data Known Labels Model Test Data Predict Target Variable Values Big Data Analytics: Introduction 65/ 68
  • 66.
    Machine Learning forData Analytics Regression x1 x2 Binary Classification Multi-Class Classification x1 x2 Big Data Analytics: Introduction 66/ 68
  • 67.
    Machine Learning forData Analytics Unsupervised Learning No correct output is provided Learning and analytics is done using statistical properties of data Clustering Outlier detection Modeling the density of data Dimensionality reduction Big Data Analytics: Introduction 67/ 68
  • 68.
    Data Analytics Tasksand Methods Big Data Analytics: Introduction 68/ 68