Download as PDF, PPTX


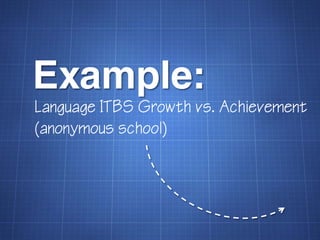


Growth modeling uses assessment data schools already have to compare student growth percentiles between teachers and identify best practices. It allows schools to focus support on struggling learners and replicate effective teachers without additional testing or costs. The approach identifies outliers, inquires into factors driving performance, and supports sharing best practices.


