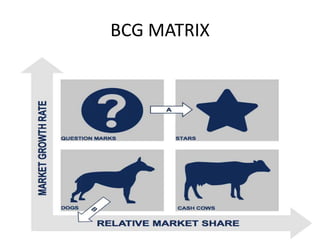
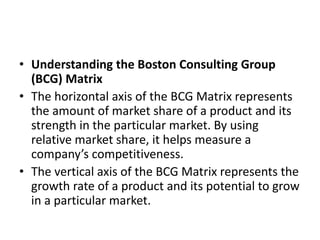
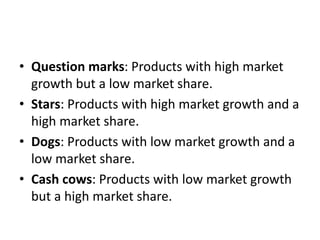
• External marketing: describes the normal work of preparing, pricing, distributing,
and promoting the service to customers.
Boston Consulting Group (BCG)
Matrix
• What is the Boston Consulting Group (BCG) Matrix?
• The Boston Consulting Group Matrix (BCG Matrix), also
referred to as the product portfolio matrix, is a
business planning tool used to evaluate the strategic
position of a firm’s brand portfolio. The BCG Matrix is
one of the most popular portfolio analysis methods. It
classifies a firm’s product and/or services into a two-
by-two matrix. Each quadrant is classified as low or
high performance, depending on the relative market
share and market growth rate. Learn more about
strategy in CFI’s Business Strategy Course.
BCG MATRIX
• Understanding the Boston Consulting Group
(BCG) Matrix
• The horizontal axis of the BCG Matrix represents
the amount of market share of a product and its
strength in the particular market. By using
relative market share, it helps measure a
company’s competitiveness.
• The vertical axis of the BCG Matrix represents the
growth rate of a product and its potential to grow
in a particular market.
• Question marks: Products with high market
growth but a low market share.
• Stars: Products with high market growth and a
high market share.
• Dogs: Products with low market growth and a
low market share.
• Cash cows: Products with low market growth
but a high market share.

services marketing plus bcg matrix .pptx

  • 1.
    • External marketing:describes the normal work of preparing, pricing, distributing, and promoting the service to customers.
  • 3.
    Boston Consulting Group(BCG) Matrix • What is the Boston Consulting Group (BCG) Matrix? • The Boston Consulting Group Matrix (BCG Matrix), also referred to as the product portfolio matrix, is a business planning tool used to evaluate the strategic position of a firm’s brand portfolio. The BCG Matrix is one of the most popular portfolio analysis methods. It classifies a firm’s product and/or services into a two- by-two matrix. Each quadrant is classified as low or high performance, depending on the relative market share and market growth rate. Learn more about strategy in CFI’s Business Strategy Course.
  • 4.
  • 5.
    • Understanding theBoston Consulting Group (BCG) Matrix • The horizontal axis of the BCG Matrix represents the amount of market share of a product and its strength in the particular market. By using relative market share, it helps measure a company’s competitiveness. • The vertical axis of the BCG Matrix represents the growth rate of a product and its potential to grow in a particular market.
  • 6.
    • Question marks:Products with high market growth but a low market share. • Stars: Products with high market growth and a high market share. • Dogs: Products with low market growth and a low market share. • Cash cows: Products with low market growth but a high market share.