CHAPTER ONE
SAMPLING ANDSAMPLING DISTRIBUTION
1.1 Sampling Theory
Sampling theory is a study of relationships existing between a population and
samples drawn from the population. Sampling theory is applicable only to random
samples. For this purpose the population or a universe may be defined as an aggregate
of items possessing a common trait or traits.
In other words, a universe is the complete group of items about which knowledge is
sought. The universe may be finite or infinite. Finite universe is one which has a
definite and certain number of items, but when the number of items is uncertain and
infinite, the universe is said to be an infinite universe.
Similarly, the universe may be hypothetical or existent. In the former case the
universe in fact does not exist and we can only imagine the items constituting it.
Tossing of a coin or throwing a dice are examples of hypothetical universe. Existent
universe is a universe of concrete objects i.e., the universe where the items
constituting it really exist.
On the other hand, the term sample refers to that part of the universe which is
selected for the purpose of investigation. The theory of sampling studies the
relationships that exist between the universe and the sample or samples drawn from it
(Kothari, 2004).
Thursday, October 2, 2025
1
BY: Teferi Mengesha(MBA) UW,CBE, Dep't of Management
2.
The mainproblem of sampling theory is the problem of relationship between a
parameter and a statistic. The theory of sampling is concerned with estimating the
properties of the population from those of the sample and also with gauging the
precision of the estimate.
This sort of movement from particular (sample) towards general (universe) is what
is known as statistical induction or statistical inference. In more clear terms “from the
sample we attempt to draw inference concerning the universe.
In order to be able to follow this inductive method, we first follow a deductive
argument which is that we imagine a population or universe (finite or infinite) and
investigate the behavior of the samples drawn from this universe applying the laws of
probability.” The methodology dealing with all this is known as sampling theory.
Sampling theory is designed to attain one or more of the following objectives:
(i) Statistical estimation: Sampling theory helps in estimating unknown population
parameters from a knowledge of statistical measures based on sample studies. In other
words, to obtain an estimate of parameter from statistic is the main objective of the
sampling theory. The estimate can either be a point estimate or it may be an interval
estimate
Thursday, October 2, 2025
2
BY: Teferi Mengesha(MBA) UW,CBE, Dep't of Management
3.
Point estimateis a single estimate expressed in the form of a single figure, but
interval estimate has two limits viz., the upper limit and the lower limit within which
the parameter value may lie. Interval estimates are often used in statistical induction.
(ii) Testing of hypotheses: The second objective of sampling theory is to enable us
to decide whether to accept or reject hypothesis; the sampling theory helps in
determining whether observed differences are actually due to chance or whether they
are really significant.
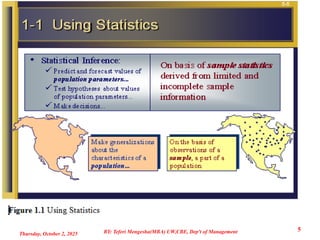
(iii) Statistical inference: Sampling theory helps in making generalization about the
population/ universe from the studies based on samples drawn from it. It also helps in
determining the accuracy of such generalizations.
The need for adequate and reliable data is ever increasing for making wise decisions
in different areas of specialization of human activity and business is no exception to it.
1.1.1 Basic Definitions
Statistics is a science of inference. It is the science of generalization from a part
(the randomly chosen sample) to the whole (the population). Actually not all of
statistics concerns inferences about populations.
One branch of statistics, called descriptive statistics, deals with describing data sets-
possibly with no interest in an underlying population. The descriptive statistics of when
not used for inference, fall in this category.
Thursday, October 2, 2025
3
BY: Teferi Mengesha(MBA) UW,CBE, Dep't of Management
4.
There aretwo broad ways in which required information may be obtained. These
are:
Complete enumeration or census method, and
Sampling method.
A population is the complete collection of all elements (scores, people,
measurements, and so on) to be studied. The collection is complete in the sense that it
includes all subjects to be studied. A population parameter as a numerical descriptive
measure of a population.
A sample is a sub-collection of members selected from a population and statistic is
a numerical measure of a sample.
The sampled population is the population from which the sample is drawn, and a
frame is a list of the elements that the sample will be selected from.
Thursday, October 2, 2025
4
BY: Teferi Mengesha(MBA) UW,CBE, Dep't of Management
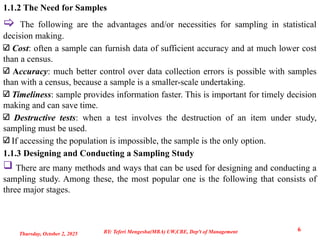
1.1.2 The Needfor Samples
The following are the advantages and/or necessities for sampling in statistical
decision making.
Cost: often a sample can furnish data of sufficient accuracy and at much lower cost
than a census.
Accuracy: much better control over data collection errors is possible with samples
than with a census, because a sample is a smaller-scale undertaking.
Timeliness: sample provides information faster. This is important for timely decision
making and can save time.
Destructive tests: when a test involves the destruction of an item under study,
sampling must be used.
If accessing the population is impossible, the sample is the only option.
1.1.3 Designing and Conducting a Sampling Study
There are many methods and ways that can be used for designing and conducting a
sampling study. Among these, the most popular one is the following that consists of
three major stages.
Thursday, October 2, 2025
6
BY: Teferi Mengesha(MBA) UW,CBE, Dep't of Management
7.
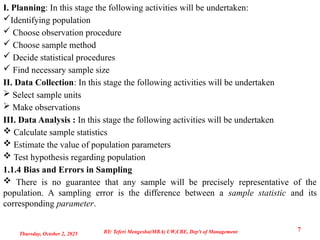
I. Planning: Inthis stage the following activities will be undertaken:
Identifying population
Choose observation procedure
Choose sample method
Decide statistical procedures
Find necessary sample size
II. Data Collection: In this stage the following activities will be undertaken
Select sample units
Make observations
III. Data Analysis : In this stage the following activities will be undertaken
Calculate sample statistics
Estimate the value of population parameters
Test hypothesis regarding population
1.1.4 Bias and Errors in Sampling
There is no guarantee that any sample will be precisely representative of the
population. A sampling error is the difference between a sample statistic and its
corresponding parameter.
Thursday, October 2, 2025
7
BY: Teferi Mengesha(MBA) UW,CBE, Dep't of Management
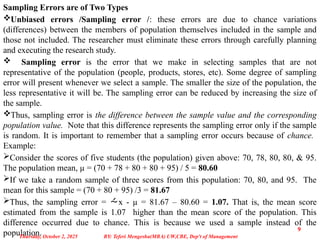
Sampling Errors areof Two Types
Unbiased errors /Sampling error /: these errors are due to chance variations
(differences) between the members of population themselves included in the sample and
those not included. The researcher must eliminate these errors through carefully planning
and executing the research study.
Sampling error is the error that we make in selecting samples that are not
representative of the population (people, products, stores, etc). Some degree of sampling
error will present whenever we select a sample. The smaller the size of the population, the
less representative it will be. The sampling error can be reduced by increasing the size of
the sample.
Thus, sampling error is the difference between the sample value and the corresponding
population value. Note that this difference represents the sampling error only if the sample
is random. It is important to remember that a sampling error occurs because of chance.
Example:
Consider the scores of five students (the population) given above: 70, 78, 80, 80, & 95.
The population mean, µ = (70 + 78 + 80 + 80 + 95) / 5 = 80.60
If we take a random sample of three scores from this population: 70, 80, and 95. The
mean for this sample = (70 + 80 + 95) /3 = 81.67
Thus, the sampling error = x - µ = 81.67 – 80.60 = 1.07. That is, the mean score
estimated from the sample is 1.07 higher than the mean score of the population. This
difference occurred due to chance. This is because we used a sample instead of the
population.
Thursday, October 2, 2025
9
BY: Teferi Mengesha(MBA) UW,CBE, Dep't of Management
10.
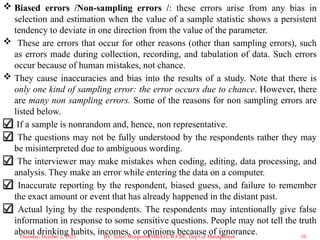
Biased errors/Non-sampling errors /: these errors arise from any bias in
selection and estimation when the value of a sample statistic shows a persistent
tendency to deviate in one direction from the value of the parameter.
These are errors that occur for other reasons (other than sampling errors), such
as errors made during collection, recording, and tabulation of data. Such errors
occur because of human mistakes, not chance.
They cause inaccuracies and bias into the results of a study. Note that there is
only one kind of sampling error: the error occurs due to chance. However, there
are many non sampling errors. Some of the reasons for non sampling errors are
listed below.
If a sample is nonrandom and, hence, non representative.
The questions may not be fully understood by the respondents rather they may
be misinterpreted due to ambiguous wording.
The interviewer may make mistakes when coding, editing, data processing, and
analysis. They make an error while entering the data on a computer.
Inaccurate reporting by the respondent, biased guess, and failure to remember
the exact amount or event that has already happened in the distant past.
Actual lying by the respondents. The respondents may intentionally give false
information in response to some sensitive questions. People may not tell the truth
about drinking habits, incomes, or opinions because of ignorance.
Thursday, October 2, 2025 10
BY: Teferi Mengesha(MBA) UW,CBE, Dep't of Management
11.
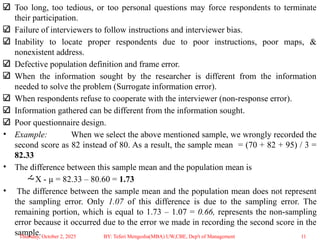
Too long, tootedious, or too personal questions may force respondents to terminate
their participation.
Failure of interviewers to follow instructions and interviewer bias.
Inability to locate proper respondents due to poor instructions, poor maps, &
nonexistent address.
Defective population definition and frame error.
When the information sought by the researcher is different from the information
needed to solve the problem (Surrogate information error).
When respondents refuse to cooperate with the interviewer (non-response error).
Information gathered can be different from the information sought.
Poor questionnaire design.
• Example: When we select the above mentioned sample, we wrongly recorded the
second score as 82 instead of 80. As a result, the sample mean = (70 + 82 + 95) / 3 =
82.33
• The difference between this sample mean and the population mean is
X - µ = 82.33 – 80.60 = 1.73
• The difference between the sample mean and the population mean does not represent
the sampling error. Only 1.07 of this difference is due to the sampling error. The
remaining portion, which is equal to 1.73 – 1.07 = 0.66, represents the non-sampling
error because it occurred due to the error we made in recording the second score in the
sample.
Thursday, October 2, 2025 11
BY: Teferi Mengesha(MBA) UW,CBE, Dep't of Management
12.
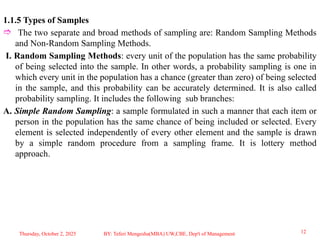
1.1.5 Types ofSamples
The two separate and broad methods of sampling are: Random Sampling Methods
and Non-Random Sampling Methods.
I. Random Sampling Methods: every unit of the population has the same probability
of being selected into the sample. In other words, a probability sampling is one in
which every unit in the population has a chance (greater than zero) of being selected
in the sample, and this probability can be accurately determined. It is also called
probability sampling. It includes the following sub branches:
A. Simple Random Sampling: a sample formulated in such a manner that each item or
person in the population has the same chance of being included or selected. Every
element is selected independently of every other element and the sample is drawn
by a simple random procedure from a sampling frame. It is lottery method
approach.
Thursday, October 2, 2025 12
BY: Teferi Mengesha(MBA) UW,CBE, Dep't of Management
13.
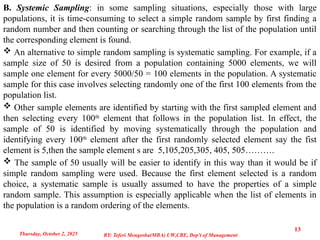
B. Systemic Sampling:in some sampling situations, especially those with large
populations, it is time-consuming to select a simple random sample by first finding a
random number and then counting or searching through the list of the population until
the corresponding element is found.
An alternative to simple random sampling is systematic sampling. For example, if a
sample size of 50 is desired from a population containing 5000 elements, we will
sample one element for every 5000/50 = 100 elements in the population. A systematic
sample for this case involves selecting randomly one of the first 100 elements from the
population list.
Other sample elements are identified by starting with the first sampled element and
then selecting every 100th
element that follows in the population list. In effect, the
sample of 50 is identified by moving systematically through the population and
identifying every 100th
element after the first randomly selected element say the fist
element is 5,then the sample element s are 5,105,205,305, 405, 505……….
The sample of 50 usually will be easier to identify in this way than it would be if
simple random sampling were used. Because the first element selected is a random
choice, a systematic sample is usually assumed to have the properties of a simple
random sample. This assumption is especially applicable when the list of elements in
the population is a random ordering of the elements.
Thursday, October 2, 2025
13
BY: Teferi Mengesha(MBA) UW,CBE, Dep't of Management
14.
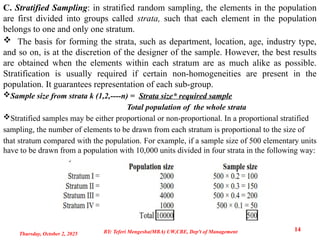
C. Stratified Sampling:in stratified random sampling, the elements in the population
are first divided into groups called strata, such that each element in the population
belongs to one and only one stratum.
The basis for forming the strata, such as department, location, age, industry type,
and so on, is at the discretion of the designer of the sample. However, the best results
are obtained when the elements within each stratum are as much alike as possible.
Stratification is usually required if certain non-homogeneities are present in the
population. It guarantees representation of each sub-group.
Sample size from strata k (1,2,----n) = Strata size* required sample
Total population of the whole strata
Stratified samples may be either proportional or non-proportional. In a proportional stratified
sampling, the number of elements to be drawn from each stratum is proportional to the size of
that stratum compared with the population. For example, if a sample size of 500 elementary units
have to be drawn from a population with 10,000 units divided in four strata in the following way:
Thursday, October 2, 2025
14
BY: Teferi Mengesha(MBA) UW,CBE, Dep't of Management
15.
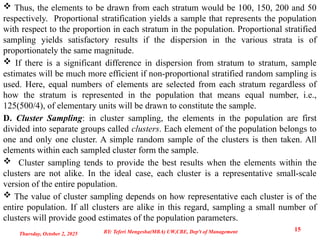
Thus, theelements to be drawn from each stratum would be 100, 150, 200 and 50
respectively. Proportional stratification yields a sample that represents the population
with respect to the proportion in each stratum in the population. Proportional stratified
sampling yields satisfactory results if the dispersion in the various strata is of
proportionately the same magnitude.
If there is a significant difference in dispersion from stratum to stratum, sample
estimates will be much more efficient if non-proportional stratified random sampling is
used. Here, equal numbers of elements are selected from each stratum regardless of
how the stratum is represented in the population that means equal number, i.e.,
125(500/4), of elementary units will be drawn to constitute the sample.
D. Cluster Sampling: in cluster sampling, the elements in the population are first
divided into separate groups called clusters. Each element of the population belongs to
one and only one cluster. A simple random sample of the clusters is then taken. All
elements within each sampled cluster form the sample.
Cluster sampling tends to provide the best results when the elements within the
clusters are not alike. In the ideal case, each cluster is a representative small-scale
version of the entire population.
The value of cluster sampling depends on how representative each cluster is of the
entire population. If all clusters are alike in this regard, sampling a small number of
clusters will provide good estimates of the population parameters.
Thursday, October 2, 2025
15
BY: Teferi Mengesha(MBA) UW,CBE, Dep't of Management
16.
One ofthe primary applications of cluster sampling is area sampling, where
clusters are city blocks or other well-defined areas. Cluster sampling generally requires
a larger total sample size than either simple random sampling or stratified random
sampling.
However, it can result in cost savings because of the fact that when an interviewer is
sent to a sampled cluster (example, a city-block location), many sample observations
can be obtained in a relatively short time. Hence, a larger sample size may be
obtainable with a significantly lower total cost.
II. Non-Random Sampling Methods: every unit of the population do not have the
same probability of being selected to the sample. Members of non-random samples are
not selected by chance. It is also called non-probability sampling. It includes the
following subranches:
A. Convenience Sampling: elements are selected for the sample for the convenience
of the researcher. The researcher tends to choose items that are readily available,
nearby, and/or willing to participate.
B. Snowball sampling: Initial sampling units are selected using probability methods
but additional units or subsequent referrals are included in the sample. This
technique is used to locate sampling units that have desired characteristics but are
difficult to find. It may reduce costs but may introduce bias.
Thursday, October 2, 2025
16
BY: Teferi Mengesha(MBA) UW,CBE, Dep't of Management
17.
C. Judgment Sampling:elements are selected for the sample by the judgment of the
researcher. Researchers often believe that they can obtain a representative sample by
using sound judgment, which will result in saving time and money. The elementary
units are selected judgmentally when the population is highly heterogeneous, when the
sample is to be quite small, or when special skill is required to ensure a representative
collection of observations.
D. Quota Sampling: a non-probability sampling technique that is a two-stage
restricted judgmental sampling. The size of the quotas is determined by the researcher’s
belief for the relative size of each class of respondent.
The first stage consists of developing control categories or quotas of population
elements.
In the second stage, sample elements are selected based on convenience sampling.
To develop these quotas, the researcher lists relevant control characteristics which
may include sex, age, etc are identified on the basis of judgment.
A field worker is provided with screening criteria that will classify the potential
respondent into a particular quota cell. For example, a large bank, might stipulate that
the final sample be one-half adult males and one-half adult females because in their
understanding of their market, the customer profile is about 50-50, male and female.
Thursday, October 2, 2025
17
BY: Teferi Mengesha(MBA) UW,CBE, Dep't of Management
18.
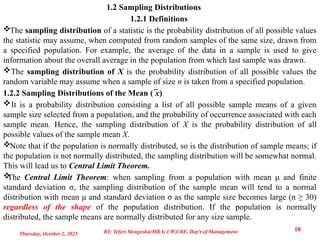
1.2 Sampling Distributions
1.2.1Definitions
The sampling distribution of a statistic is the probability distribution of all possible values
the statistic may assume, when computed from random samples of the same size, drawn from
a specified population. For example, the average of the data in a sample is used to give
information about the overall average in the population from which last sample was drawn.
The sampling distribution of X is the probability distribution of all possible values the
random variable may assume when a sample of size n is taken from a specified population.
1.2.2 Sampling Distributions of the Mean ( x
̅ )
It is a probability distribution consisting a list of all possible sample means of a given
sample size selected from a population, and the probability of occurrence associated with each
sample mean. Hence, the sampling distribution of X is the probability distribution of all
possible values of the sample mean X.
Note that if the population is normally distributed, so is the distribution of sample means; if
the population is not normally distributed, the sampling distribution will be somewhat normal.
This will lead us to Central Limit Theorem.
The Central Limit Theorem: when sampling from a population with mean μ and finite
standard deviation σ, the sampling distribution of the sample mean will tend to a normal
distribution with mean μ and standard deviation σ as the sample size becomes large (n ≥ 30)
regardless of the shape of the population distribution. If the population is normally
distributed, the sample means are normally distributed for any size sample.
Thursday, October 2, 2025
18
BY: Teferi Mengesha(MBA) UW,CBE, Dep't of Management
19.
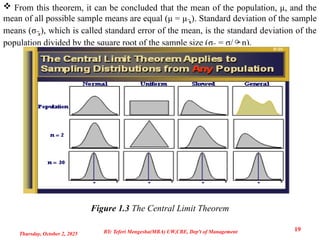
From thistheorem, it can be concluded that the mean of the population, μ, and the
mean of all possible sample means are equal (μ = μ x
̅ ). Standard deviation of the sample
means (σ ̅x), which is called standard error of the mean, is the standard deviation of the
population divided by the square root of the sample size (σ ̅x = σ/n).
Figure 1.3 The Central Limit Theorem
Thursday, October 2, 2025
19
BY: Teferi Mengesha(MBA) UW,CBE, Dep't of Management
20.
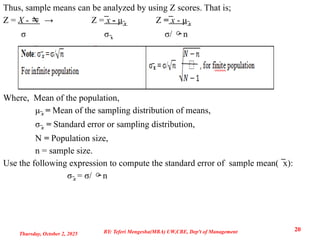
Thus, sample meanscan be analyzed by using Z scores. That is;
Z = X - → Z = ̅x - μ̅x Z = ̅x - μ̅x
σ σ x
̅ σ/ n
Where, Mean of the population,
μ̅x = Mean of the sampling distribution of means,
σ̅x = Standard error or sampling distribution,
N = Population size,
n = sample size.
Use the following expression to compute the standard error of sample mean( x):
̅
σ̅x = σ/ n
Thursday, October 2, 2025
20
BY: Teferi Mengesha(MBA) UW,CBE, Dep't of Management
21.
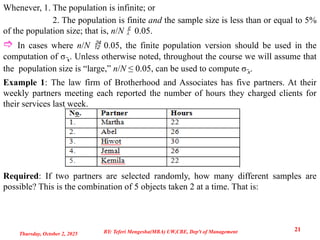
Whenever, 1. Thepopulation is infinite; or
2. The population is finite and the sample size is less than or equal to 5%
of the population size; that is, n/N 0.05.
In cases where n/N 0.05, the finite population version should be used in the
computation of σ x
̅ . Unless otherwise noted, throughout the course we will assume that
the population size is “large,” n/N ≤ 0.05, can be used to compute σ ̅x.
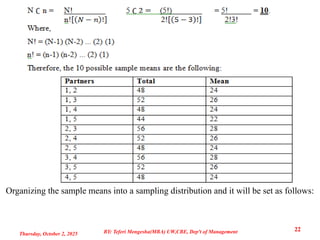
Example 1: The law firm of Brotherhood and Associates has five partners. At their
weekly partners meeting each reported the number of hours they charged clients for
their services last week.
Required: If two partners are selected randomly, how many different samples are
possible? This is the combination of 5 objects taken 2 at a time. That is:
Thursday, October 2, 2025
21
BY: Teferi Mengesha(MBA) UW,CBE, Dep't of Management
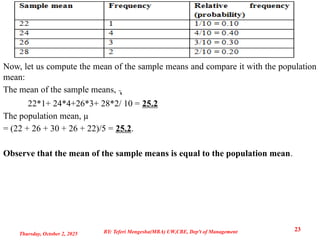
22.
Organizing the samplemeans into a sampling distribution and it will be set as follows:
Thursday, October 2, 2025
22
BY: Teferi Mengesha(MBA) UW,CBE, Dep't of Management
23.
Now, let uscompute the mean of the sample means and compare it with the population
mean:
The mean of the sample means, x
̅
22*1+ 24*4+26*3+ 28*2/ 10 = 25.2
The population mean, µ
= (22 + 26 + 30 + 26 + 22)/5 = 25.2.
Observe that the mean of the sample means is equal to the population mean.
Thursday, October 2, 2025
23
BY: Teferi Mengesha(MBA) UW,CBE, Dep't of Management
24.
Thursday, October 2,2025
24
BY: Teferi Mengesha(MBA) UW,CBE, Dep't of Management
25.
Thursday, October 2,2025
25
BY: Teferi Mengesha(MBA) UW,CBE, Dep't of Management
26.
Thursday, October 2,2025
26
BY: Teferi Mengesha(MBA) UW,CBE, Dep't of Management
27.
Thursday, October 2,2025
27
BY: Teferi Mengesha(MBA) UW,CBE, Dep't of Management
28.
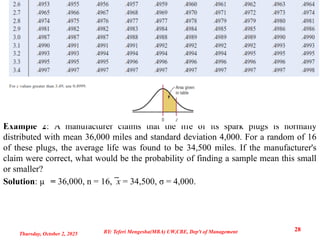
Example 2: Amanufacturer claims that the life of its spark plugs is normally
distributed with mean 36,000 miles and standard deviation 4,000. For a random of 16
of these plugs, the average life was found to be 34,500 miles. If the manufacturer's
claim were correct, what would be the probability of finding a sample mean this small
or smaller?
Solution: µ = 36,000, n = 16, ̅x = 34,500, σ = 4,000.
Thursday, October 2, 2025
28
BY: Teferi Mengesha(MBA) UW,CBE, Dep't of Management
29.
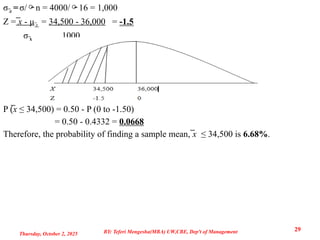
σ̅x =σ/n =4000/16 = 1,000
Z = ̅x - μ̅x = 34,500 - 36,000 = -1.5
σx
̅ 1000
P (̅x ≤ 34,500) = 0.50 - P (0 to -1.50)
= 0.50 - 0.4332 = 0.0668
Therefore, the probability of finding a sample mean, ̅x ≤ 34,500 is 6.68%.
Thursday, October 2, 2025
29
BY: Teferi Mengesha(MBA) UW,CBE, Dep't of Management
30.
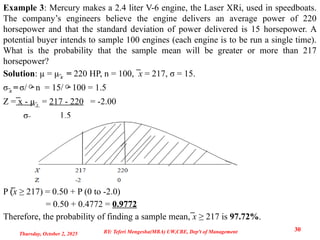
Example 3: Mercurymakes a 2.4 liter V-6 engine, the Laser XRi, used in speedboats.
The company’s engineers believe the engine delivers an average power of 220
horsepower and that the standard deviation of power delivered is 15 horsepower. A
potential buyer intends to sample 100 engines (each engine is to be run a single time).
What is the probability that the sample mean will be greater or more than 217
horsepower?
Solution: µ = μ̅x = 220 HP, n = 100, ̅x = 217, σ = 15.
σ̅x =σ/n = 15/100 = 1.5
Z = x -
̅ μ̅x = 217 - 220 = -2.00
σ̅x 1.5
P (̅x ≥ 217) = 0.50 + P (0 to -2.0)
= 0.50 + 0.4772 = 0.9772
Therefore, the probability of finding a sample mean, ̅x ≥ 217 is 97.72%.
Thursday, October 2, 2025
30
BY: Teferi Mengesha(MBA) UW,CBE, Dep't of Management
31.
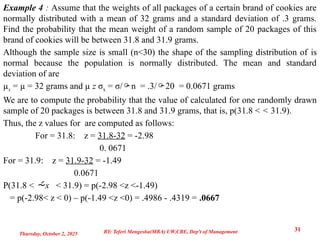
Example 4 :Assume that the weights of all packages of a certain brand of cookies are
normally distributed with a mean of 32 grams and a standard deviation of .3 grams.
Find the probability that the mean weight of a random sample of 20 packages of this
brand of cookies will be between 31.8 and 31.9 grams.
Although the sample size is small (n<30) the shape of the sampling distribution of is
normal because the population is normally distributed. The mean and standard
deviation of are
µx = µ = 32 grams and µ z σx = σ/n = .3/20 = 0.0671 grams
We are to compute the probability that the value of calculated for one randomly drawn
sample of 20 packages is between 31.8 and 31.9 grams, that is, p(31.8 < < 31.9).
Thus, the z values for are computed as follows:
For = 31.8: z = 31.8-32 = -2.98
0. 0671
For = 31.9: z = 31.9-32 = -1.49
0.0671
P(31.8 < x < 31.9) = p(-2.98 <z <-1.49)
= p(-2.98< z < 0) – p(-1.49 <z <0) = .4986 - .4319 = .0667
Thursday, October 2, 2025
31
BY: Teferi Mengesha(MBA) UW,CBE, Dep't of Management
32.
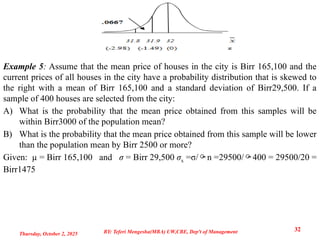
Example 5: Assumethat the mean price of houses in the city is Birr 165,100 and the
current prices of all houses in the city have a probability distribution that is skewed to
the right with a mean of Birr 165,100 and a standard deviation of Birr29,500. If a
sample of 400 houses are selected from the city:
A) What is the probability that the mean price obtained from this samples will be
within Birr3000 of the population mean?
B) What is the probability that the mean price obtained from this sample will be lower
than the population mean by Birr 2500 or more?
Given: µ = Birr 165,100 and σ = Birr 29,500 σx =σ/n =29500/400 = 29500/20 =
Birr1475
Thursday, October 2, 2025
32
BY: Teferi Mengesha(MBA) UW,CBE, Dep't of Management
33.
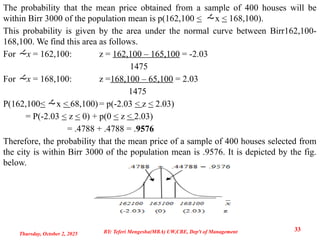
The probability thatthe mean price obtained from a sample of 400 houses will be
within Birr 3000 of the population mean is p(162,100 < x < 168,100).
This probability is given by the area under the normal curve between Birr162,100-
168,100. We find this area as follows.
For x = 162,100: z = 162,100 – 165,100 = -2.03
1475
For x = 168,100: z =168,100 – 65,100 = 2.03
1475
P(162,100< x < 68,100)= p(-2.03 < z < 2.03)
= P(-2.03 < z < 0) + p(0 < z < 2.03)
= .4788 + .4788 = .9576
Therefore, the probability that the mean price of a sample of 400 houses selected from
the city is within Birr 3000 of the population mean is .9576. It is depicted by the fig.
below.
Thursday, October 2, 2025
33
BY: Teferi Mengesha(MBA) UW,CBE, Dep't of Management
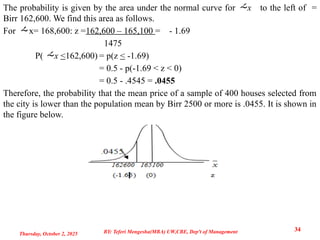
34.
The probability isgiven by the area under the normal curve for x to the left of =
Birr 162,600. We find this area as follows.
For x= 168,600: z =162,600 – 165,100 = - 1.69
1475
P( x <162,600) = p(z < -1.69)
= 0.5 - p(-1.69 < z < 0)
= 0.5 - .4545 = .0455
Therefore, the probability that the mean price of a sample of 400 houses selected from
the city is lower than the population mean by Birr 2500 or more is .0455. It is shown in
the figure below.
Thursday, October 2, 2025
34
BY: Teferi Mengesha(MBA) UW,CBE, Dep't of Management
35.
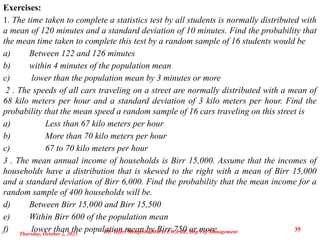
Exercises:
1. The timetaken to complete a statistics test by all students is normally distributed with
a mean of 120 minutes and a standard deviation of 10 minutes. Find the probability that
the mean time taken to complete this test by a random sample of 16 students would be
a) Between 122 and 126 minutes
b) within 4 minutes of the population mean
c) lower than the population mean by 3 minutes or more
2 . The speeds of all cars traveling on a street are normally distributed with a mean of
68 kilo meters per hour and a standard deviation of 3 kilo meters per hour. Find the
probability that the mean speed a random sample of 16 cars traveling on this street is
a) Less than 67 kilo meters per hour
b) More than 70 kilo meters per hour
c) 67 to 70 kilo meters per hour
3 . The mean annual income of households is Birr 15,000. Assume that the incomes of
households have a distribution that is skewed to the right with a mean of Birr 15,000
and a standard deviation of Birr 6,000. Find the probability that the mean income for a
random sample of 400 households will be.
d) Between Birr 15,000 and Birr 15,500
e) Within Birr 600 of the population mean
f) lower than the population mean by Birr 750 or more
Thursday, October 2, 2025
35
BY: Teferi Mengesha(MBA) UW,CBE, Dep't of Management
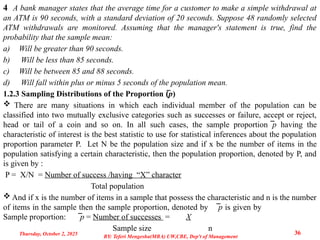
36.
4 A bankmanager states that the average time for a customer to make a simple withdrawal at
an ATM is 90 seconds, with a standard deviation of 20 seconds. Suppose 48 randomly selected
ATM withdrawals are monitored. Assuming that the manager's statement is true, find the
probability that the sample mean:
a) Will be greater than 90 seconds.
b) Will be less than 85 seconds.
c) Will be between 85 and 88 seconds.
d) Will fall within plus or minus 5 seconds of the population mean.
1.2.3 Sampling Distributions of the Proportion (̅p)
There are many situations in which each individual member of the population can be
classified into two mutually exclusive categories such as successes or failure, accept or reject,
head or tail of a coin and so on. In all such cases, the sample proportion ̅p having the
characteristic of interest is the best statistic to use for statistical inferences about the population
proportion parameter P. Let N be the population size and if x be the number of items in the
population satisfying a certain characteristic, then the population proportion, denoted by P, and
is given by :
P = X/N = Number of success /having “X” character
Total population
And if x is the number of items in a sample that possess the characteristic and n is the number
of items in the sample then the sample proportion, denoted by ̅p is given by
Sample proportion: ̅p = Number of successes = X
Sample size n
Thursday, October 2, 2025 36
BY: Teferi Mengesha(MBA) UW,CBE, Dep't of Management
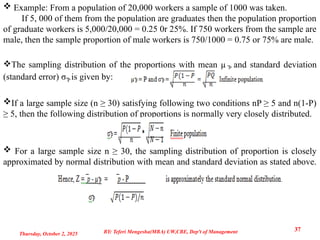
37.
Example: Froma population of 20,000 workers a sample of 1000 was taken.
If 5, 000 of them from the population are graduates then the population proportion
of graduate workers is 5,000/20,000 = 0.25 0r 25%. If 750 workers from the sample are
male, then the sample proportion of male workers is 750/1000 = 0.75 or 75% are male.
The sampling distribution of the proportions with mean µ ̅P and standard deviation
(standard error) σ ̅P is given by:
If a large sample size (n ≥ 30) satisfying following two conditions nP ≥ 5 and n(1-P)
≥ 5, then the following distribution of proportions is normally very closely distributed.
For a large sample size n ≥ 30, the sampling distribution of proportion is closely
approximated by normal distribution with mean and standard deviation as stated above.
Thursday, October 2, 2025
37
BY: Teferi Mengesha(MBA) UW,CBE, Dep't of Management
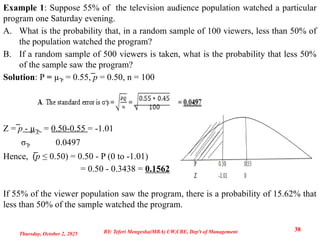
38.
Example 1: Suppose55% of the television audience population watched a particular
program one Saturday evening.
A. What is the probability that, in a random sample of 100 viewers, less than 50% of
the population watched the program?
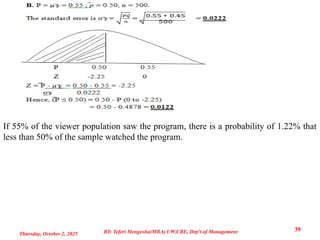
B. If a random sample of 500 viewers is taken, what is the probability that less 50%
of the sample saw the program?
Solution: P = µ̅P = 0.55, ̅p = 0.50, n = 100
Z = ̅p - µ̅P = 0.50-0.55 = -1.01
σ̅P 0.0497
Hence, (̅p ≤ 0.50) = 0.50 - P (0 to -1.01)
= 0.50 - 0.3438 = 0.1562
If 55% of the viewer population saw the program, there is a probability of 15.62% that
less than 50% of the sample watched the program.
Thursday, October 2, 2025
38
BY: Teferi Mengesha(MBA) UW,CBE, Dep't of Management
39.
If 55% ofthe viewer population saw the program, there is a probability of 1.22% that
less than 50% of the sample watched the program.
Thursday, October 2, 2025
39
BY: Teferi Mengesha(MBA) UW,CBE, Dep't of Management
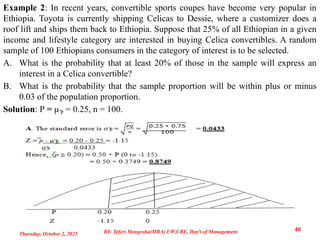
40.
Example 2: Inrecent years, convertible sports coupes have become very popular in
Ethiopia. Toyota is currently shipping Celicas to Dessie, where a customizer does a
roof lift and ships them back to Ethiopia. Suppose that 25% of all Ethiopian in a given
income and lifestyle category are interested in buying Celica convertibles. A random
sample of 100 Ethiopians consumers in the category of interest is to be selected.
A. What is the probability that at least 20% of those in the sample will express an
interest in a Celica convertible?
B. What is the probability that the sample proportion will be within plus or minus
0.03 of the population proportion.
Solution: P = µ̅P = 0.25, n = 100.
Thursday, October 2, 2025
40
BY: Teferi Mengesha(MBA) UW,CBE, Dep't of Management
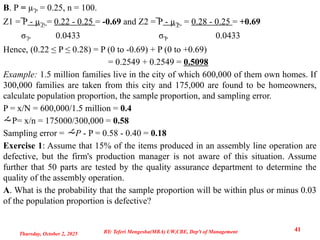
41.
B. P =µ̅P = 0.25, n = 100.
Z1 = P
̅ - µ̅P = 0.22 - 0.25 = -0.69 and Z2 = P
̅ - µ̅P = 0.28 - 0.25 = +0.69
σ̅P 0.0433 σ̅P 0.0433
Hence, (0.22 ≤ P ≤ 0.28) = P (0 to -0.69) + P (0 to +0.69)
= 0.2549 + 0.2549 = 0.5098
Example: 1.5 million families live in the city of which 600,000 of them own homes. If
300,000 families are taken from this city and 175,000 are found to be homeowners,
calculate population proportion, the sample proportion, and sampling error.
P = x/N = 600,000/1.5 million = 0.4
P= x/n = 175000/300,000 = 0.58
Sampling error = P - P = 0.58 - 0.40 = 0.18
Exercise 1: Assume that 15% of the items produced in an assembly line operation are
defective, but the firm's production manager is not aware of this situation. Assume
further that 50 parts are tested by the quality assurance department to determine the
quality of the assembly operation.
A. What is the probability that the sample proportion will be within plus or minus 0.03
of the population proportion is defective?
Thursday, October 2, 2025
41
BY: Teferi Mengesha(MBA) UW,CBE, Dep't of Management
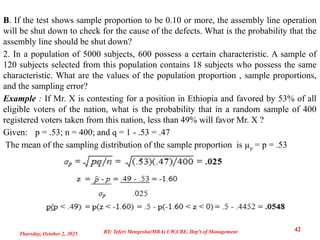
42.
B. If thetest shows sample proportion to be 0.10 or more, the assembly line operation
will be shut down to check for the cause of the defects. What is the probability that the
assembly line should be shut down?
2. In a population of 5000 subjects, 600 possess a certain characteristic. A sample of
120 subjects selected from this population contains 18 subjects who possess the same
characteristic. What are the values of the population proportion , sample proportions,
and the sampling error?
Example : If Mr. X is contesting for a position in Ethiopia and favored by 53% of all
eligible voters of the nation, what is the probability that in a random sample of 400
registered voters taken from this nation, less than 49% will favor Mr. X ?
Given: p = .53; n = 400; and q = 1 - .53 = .47
The mean of the sampling distribution of the sample proportion is µp = p = .53
Thursday, October 2, 2025
42
BY: Teferi Mengesha(MBA) UW,CBE, Dep't of Management
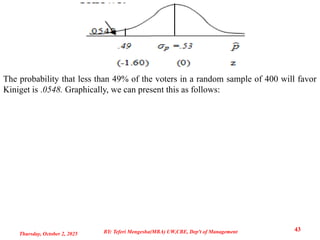
43.
The probability thatless than 49% of the voters in a random sample of 400 will favor
Kiniget is .0548. Graphically, we can present this as follows:
Thursday, October 2, 2025
43
BY: Teferi Mengesha(MBA) UW,CBE, Dep't of Management
44.
1.2.4 Sampling Distributionsof the Difference between Two Means
Many times, we are interested in comparing the results that come from two
populations. For instance, if a company has two different sources that supply it with
raw material, if a personnel manager has two different training programs, if there are
two production lines, etc.
The concept of sampling distribution of sample mean introduced earlier in this
chapter can also be used to compare a population of size N1 having µ1 and standard
deviation σ1 with another similar type of population of size N2 having µ2 and standard
deviation of σ2.
For example,
Source of raw materials == Quality of raw materials
Training programs == More efficient workers
Production ==More output
Comparison can be made based on two independent random samples, with one of
size n1 drawn from the first population and the other of size n2 drawn from the second
population. If x
̅ 1 and x
̅ 2 are the two respective sample two means, we can evaluate the
possible difference between µ1 and µ2 by the difference of the sample means ̅X1 - ̅X2.
Thursday, October 2, 2025
44
BY: Teferi Mengesha(MBA) UW,CBE, Dep't of Management
45.
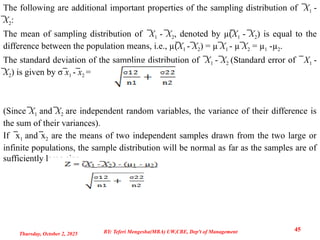
The following areadditional important properties of the sampling distribution of ̅X1 -
̅X2:
The mean of sampling distribution of ̅X1 - ̅X2, denoted by µ(̅X1 - ̅X2) is equal to the
difference between the population means, i.e., µ(̅X1 - ̅X2) = µ ̅X1 - µ ̅X2 = µ1 -µ2.
The standard deviation of the sampling distribution of ̅X1 - ̅X2 (Standard error of ̅ X1 -
̅X2) is given by σ ̅x1 - ̅x2 =
(Since ̅X1 and ̅X2 are independent random variables, the variance of their difference is
the sum of their variances).
If x
̅ 1 and x
̅ 2 are the means of two independent samples drawn from the two large or
infinite populations, the sample distribution will be normal as far as the samples are of
sufficiently large size.
Thursday, October 2, 2025
45
BY: Teferi Mengesha(MBA) UW,CBE, Dep't of Management
46.
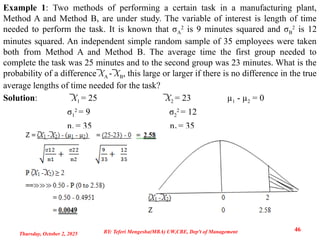
Example 1: Twomethods of performing a certain task in a manufacturing plant,
Method A and Method B, are under study. The variable of interest is length of time
needed to perform the task. It is known that σA
2
is 9 minutes squared and σB
2
is 12
minutes squared. An independent simple random sample of 35 employees were taken
both from Method A and Method B. The average time the first group needed to
complete the task was 25 minutes and to the second group was 23 minutes. What is the
probability of a difference ̅XA - ̅XB, this large or larger if there is no difference in the true
average lengths of time needed for the task?
Solution: ̅X1 = 25 ̅X2 = 23 µ1 - µ2 = 0
σ1
2
= 9 σ2
2
= 12
n1 = 35 n2 = 35
Thursday, October 2, 2025
46
BY: Teferi Mengesha(MBA) UW,CBE, Dep't of Management
47.
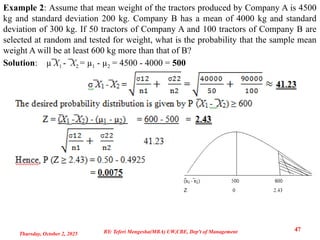
Example 2: Assumethat mean weight of the tractors produced by Company A is 4500
kg and standard deviation 200 kg. Company B has a mean of 4000 kg and standard
deviation of 300 kg. If 50 tractors of Company A and 100 tractors of Company B are
selected at random and tested for weight, what is the probability that the sample mean
weight A will be at least 600 kg more than that of B?
Solution: µ ̅X1 - ̅X2 = µ1 - µ2 = 4500 - 4000 = 500
Thursday, October 2, 2025
47
BY: Teferi Mengesha(MBA) UW,CBE, Dep't of Management
48.
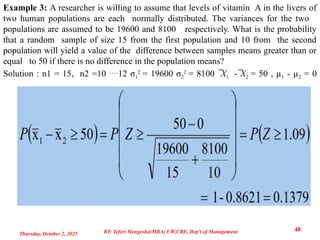
Example 3: Aresearcher is willing to assume that levels of vitamin A in the livers of
two human populations are each normally distributed. The variances for the two
populations are assumed to be 19600 and 8100 respectively. What is the probability
that a random sample of size 15 from the first population and 10 from the second
population will yield a value of the difference between samples means greater than or
equal to 50 if there is no difference in the population means?
Solution : n1 = 15, n2 =10 12 σ1
2
= 19600 σ2
2
= 8100 ̅X1 - ̅X2 = 50 , µ1 - µ2 = 0
Thursday, October 2, 2025
48
BY: Teferi Mengesha(MBA) UW,CBE, Dep't of Management
49.
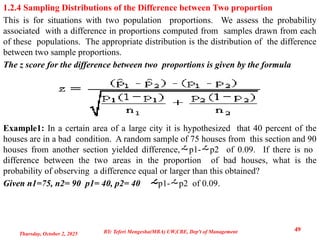
1.2.4 Sampling Distributionsof the Difference between Two proportion
This is for situations with two population proportions. We assess the probability
associated with a difference in proportions computed from samples drawn from each
of these populations. The appropriate distribution is the distribution of the difference
between two sample proportions.
The z score for the difference between two proportions is given by the formula
Example1: In a certain area of a large city it is hypothesized that 40 percent of the
houses are in a bad condition. A random sample of 75 houses from this section and 90
houses from another section yielded difference,p1-p2 of 0.09. If there is no
difference between the two areas in the proportion of bad houses, what is the
probability of observing a difference equal or larger than this obtained?
Given n1=75, n2= 90 p1= 40, p2= 40 p1-p2 of 0.09.
Thursday, October 2, 2025
49
BY: Teferi Mengesha(MBA) UW,CBE, Dep't of Management
50.
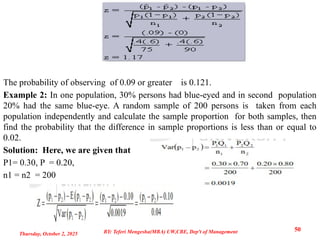
The probability ofobserving of 0.09 or greater is 0.121.
Example 2: In one population, 30% persons had blue-eyed and in second population
20% had the same blue-eye. A random sample of 200 persons is taken from each
population independently and calculate the sample proportion for both samples, then
find the probability that the difference in sample proportions is less than or equal to
0.02.
Solution: Here, we are given that
P1= 0.30, P = 0.20,
n1 = n2 = 200
Thursday, October 2, 2025
50
BY: Teferi Mengesha(MBA) UW,CBE, Dep't of Management
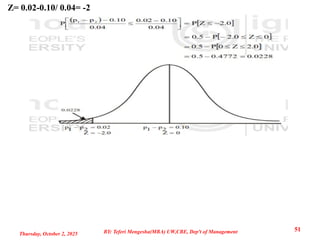
51.
Z= 0.02-0.10/ 0.04=-2
Thursday, October 2, 2025
51
BY: Teferi Mengesha(MBA) UW,CBE, Dep't of Management
52.
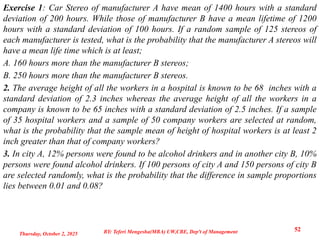
Exercise 1: CarStereo of manufacturer A have mean of 1400 hours with a standard
deviation of 200 hours. While those of manufacturer B have a mean lifetime of 1200
hours with a standard deviation of 100 hours. If a random sample of 125 stereos of
each manufacturer is tested, what is the probability that the manufacturer A stereos will
have a mean life time which is at least;
A. 160 hours more than the manufacturer B stereos;
B. 250 hours more than the manufacturer B stereos.
2. The average height of all the workers in a hospital is known to be 68 inches with a
standard deviation of 2.3 inches whereas the average height of all the workers in a
company is known to be 65 inches with a standard deviation of 2.5 inches. If a sample
of 35 hospital workers and a sample of 50 company workers are selected at random,
what is the probability that the sample mean of height of hospital workers is at least 2
inch greater than that of company workers?
3. In city A, 12% persons were found to be alcohol drinkers and in another city B, 10%
persons were found alcohol drinkers. If 100 persons of city A and 150 persons of city B
are selected randomly, what is the probability that the difference in sample proportions
lies between 0.01 and 0.08?
Thursday, October 2, 2025
52
BY: Teferi Mengesha(MBA) UW,CBE, Dep't of Management