This document outlines a project focused on the automated extraction of features from satellite images using eCognition software to classify land use types such as buildings, roads, and vegetation. The methodology involves segmentation, classification, and the application of a nearest neighbor algorithm to enhance accuracy, while also addressing limitations caused by small sample sizes and computing power. The findings indicate successful feature extraction despite challenges, with recommendations for improving the classification process.


![Step 5: Classify
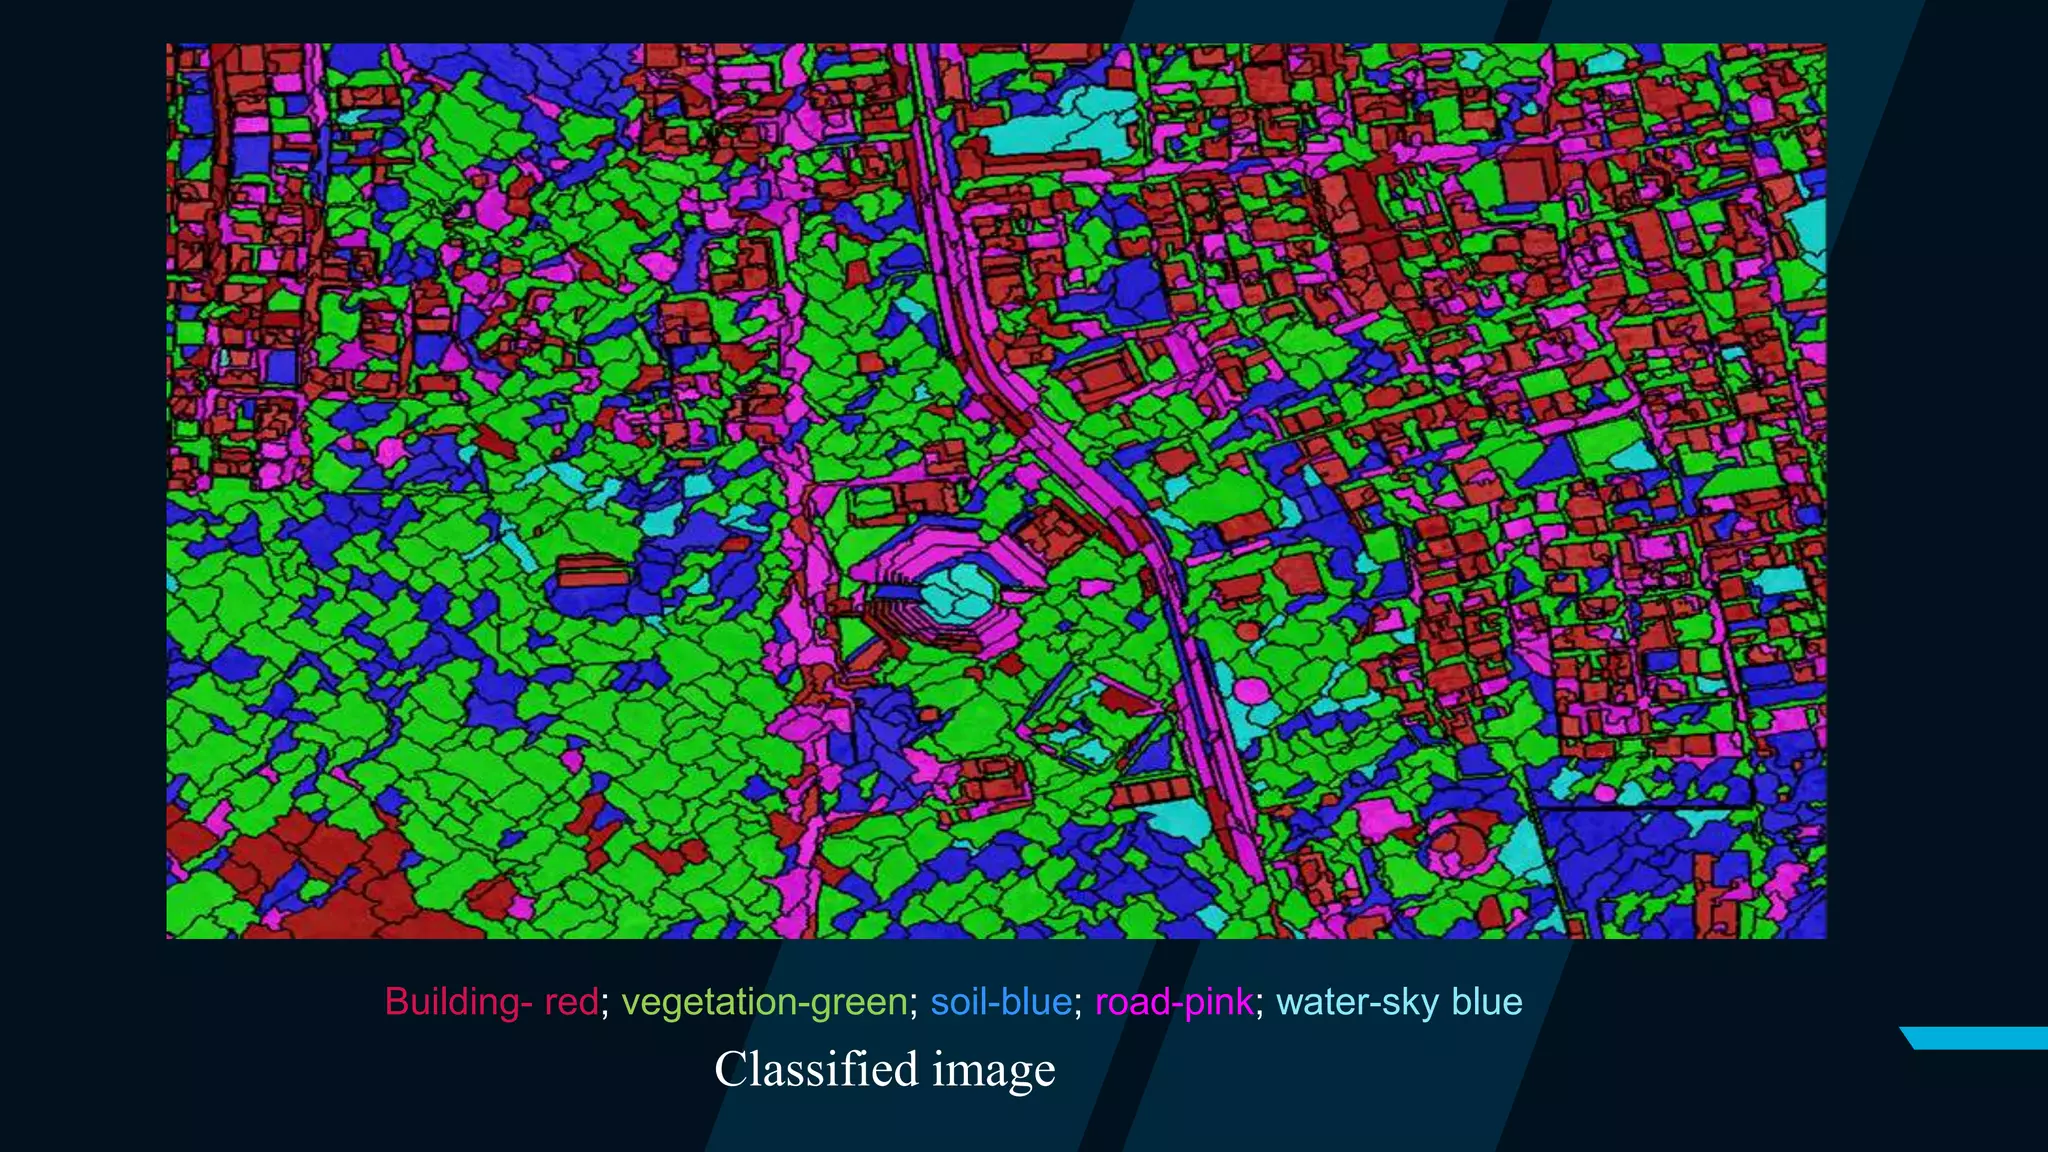
The classification process will classify all objects in the entire image based on the selected samples and the
defined statistics. It will classify each object based on their closeness to the training set.
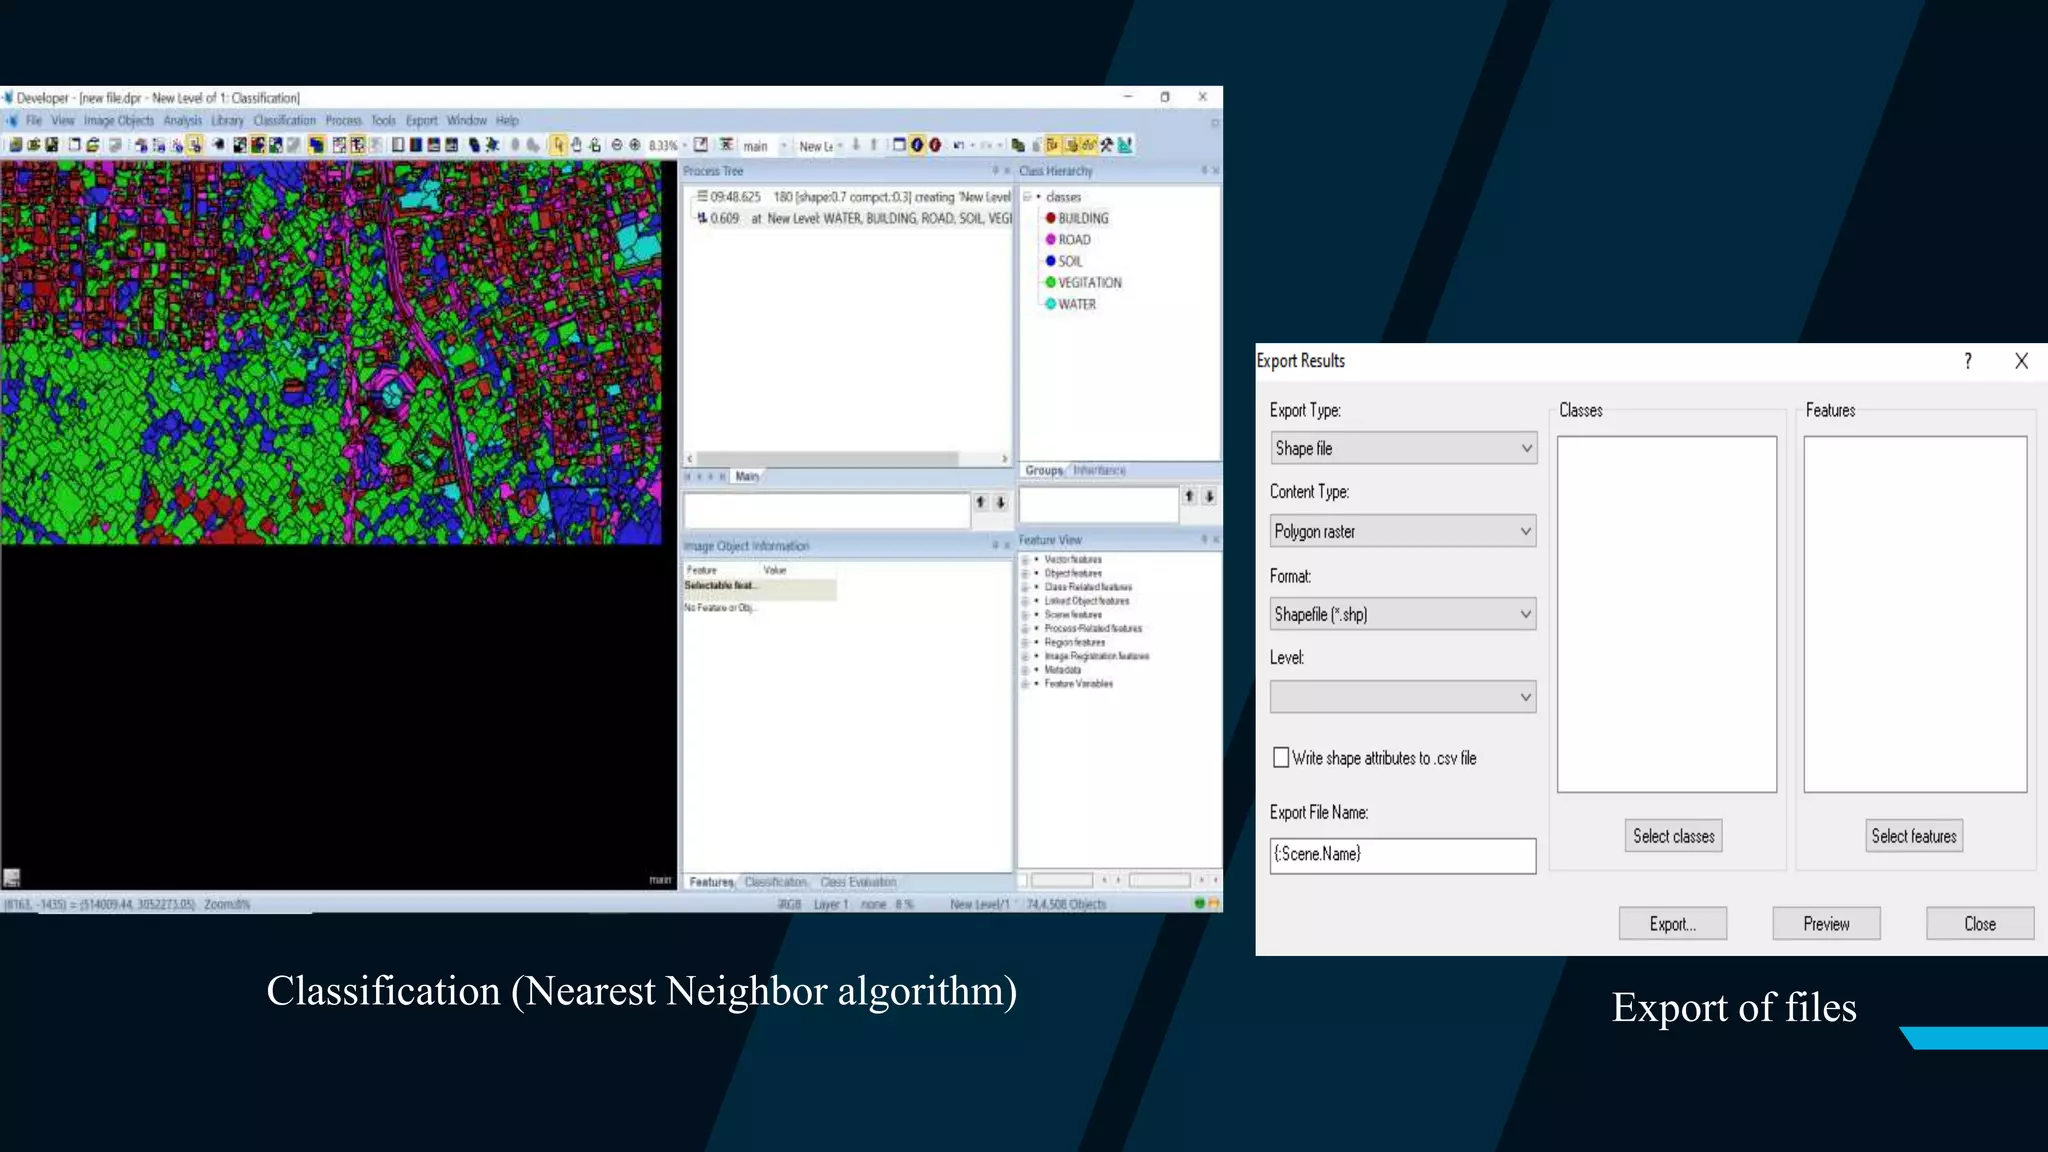
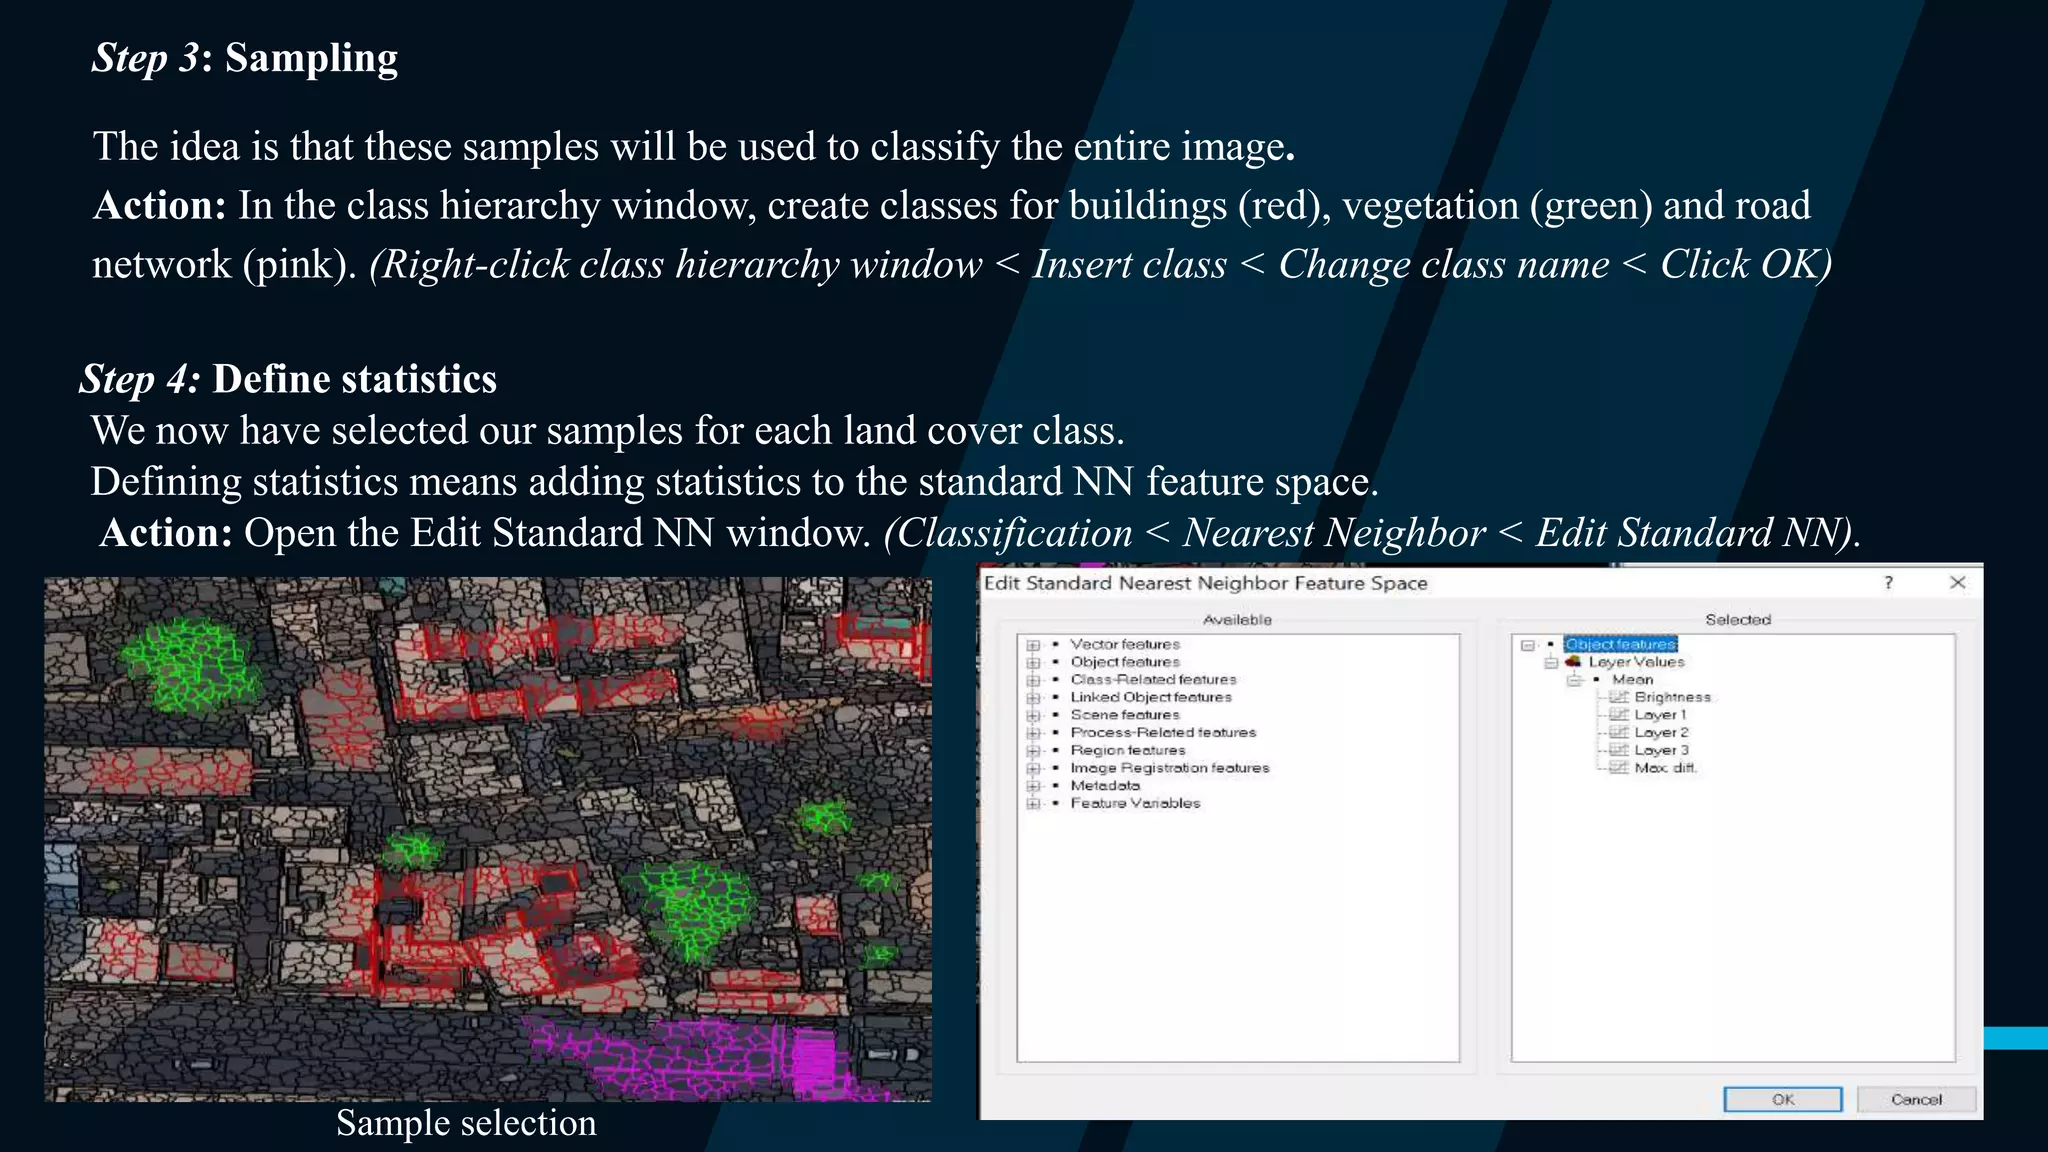
Action: In the class hierarchy; add the “standard nearest neighbor” to each class. (Right-click class< Edit <
Right-click [and min] < Insert new expression < Standard nearest neighbor)
Action: In the process tree, add the “classification” algorithm. (Right-click process tree < Append New <
Select classification algorithm)
Action: Select each class as active classes and press execute. (In parameter window < checkmark all classes <
Right click classification algorithm in process tree < execute)
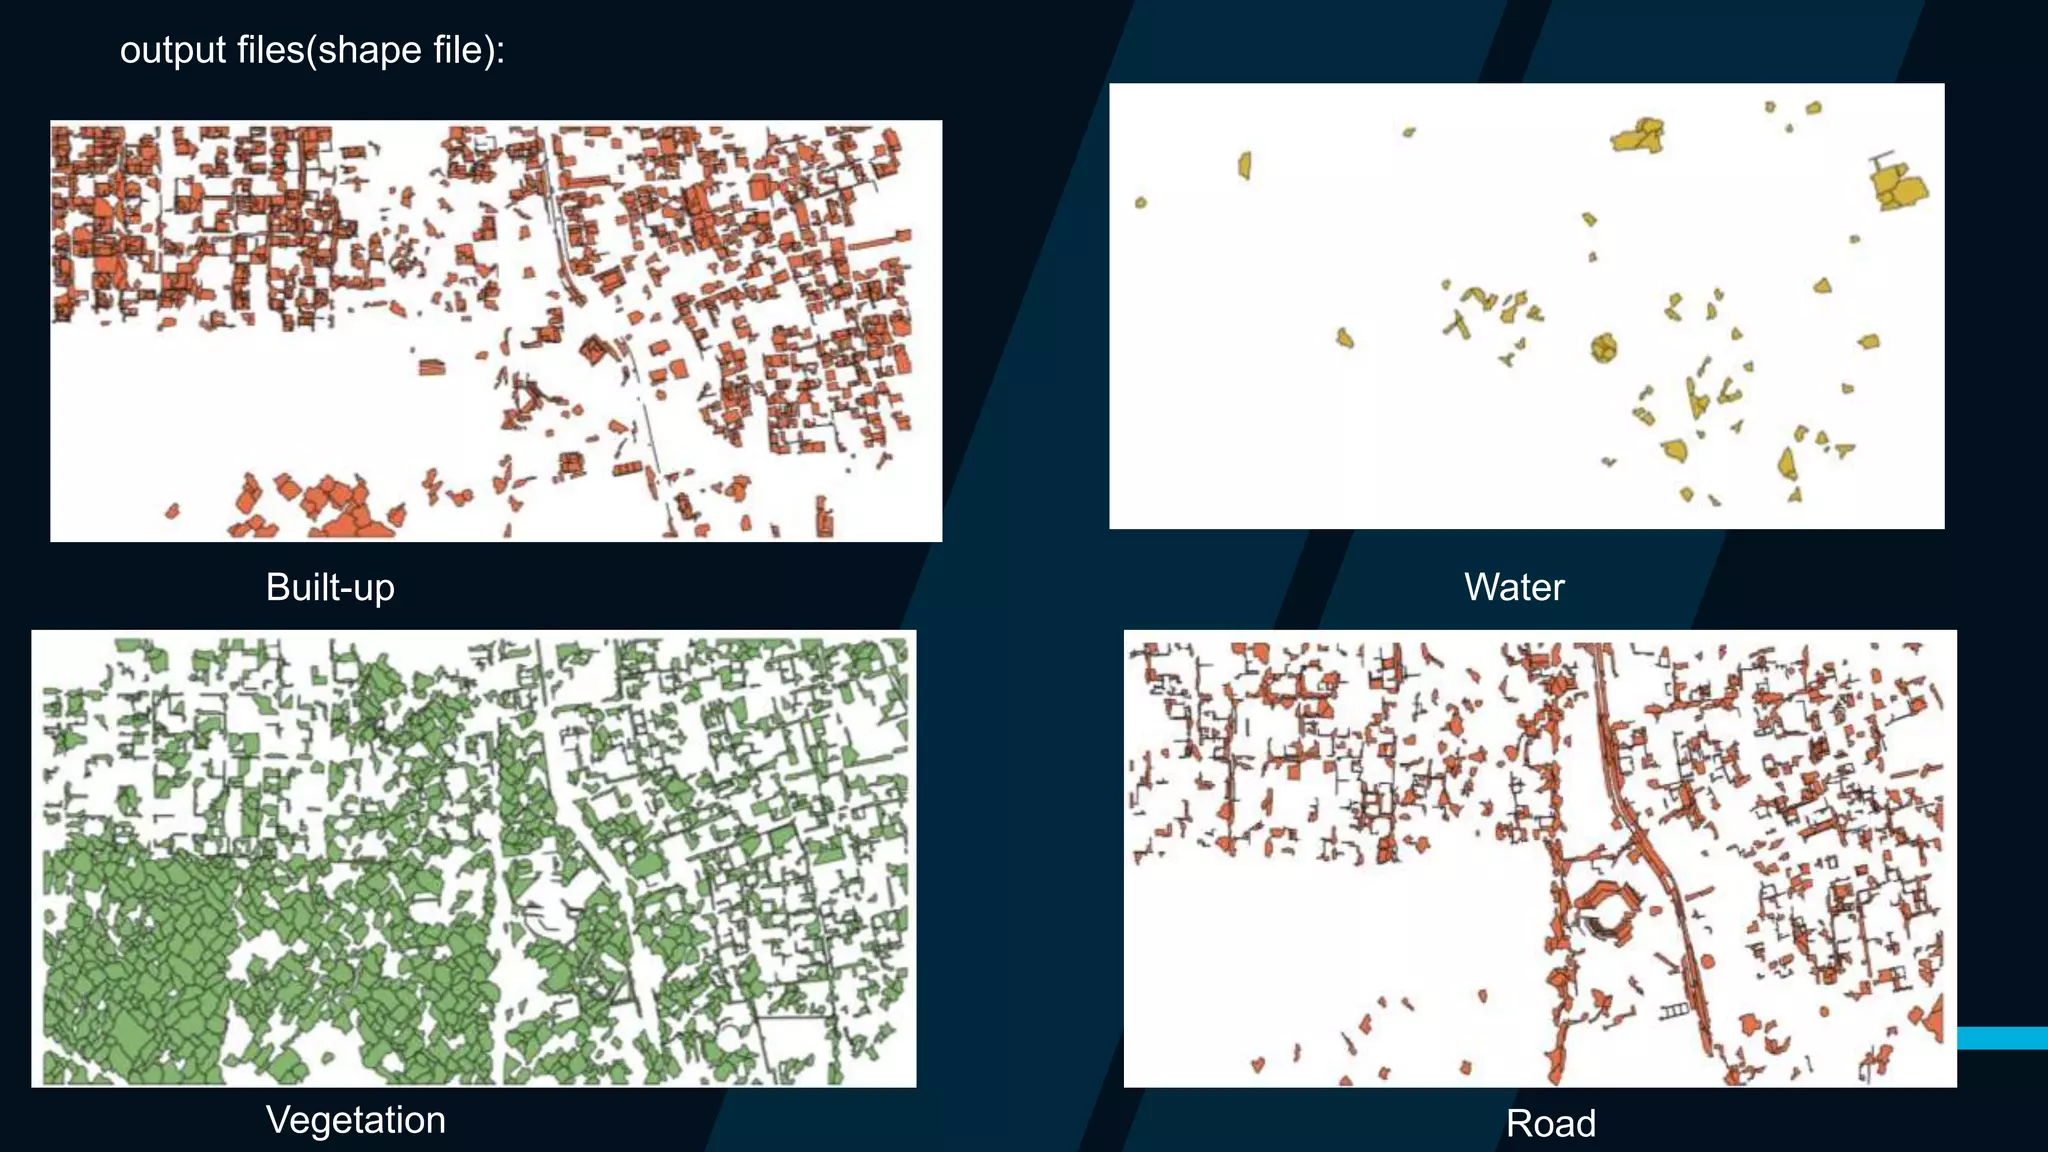
Step 6: Export of vector files
Output result files are saved in vector formats.
Action: (Right-click on Export < Export Results < Export File Name < Select classes < Select Features).](https://image.slidesharecdn.com/finalyearpresentation-210523153214/75/Automated-features-extraction-from-satellite-images-28-2048.jpg)