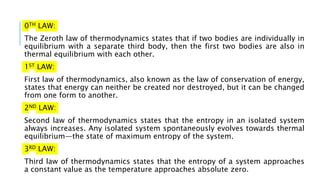
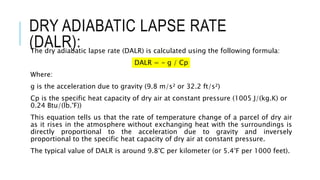
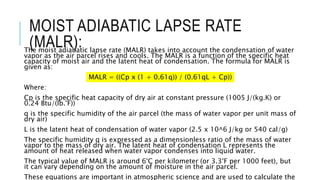
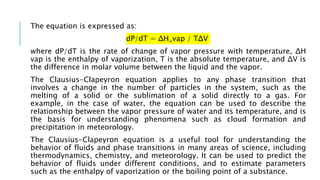
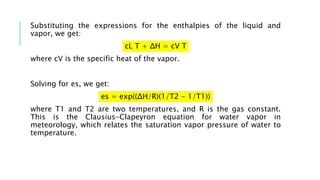
These are the various Thermodynamic Laws and its application to Meteorology. These are just the basic concepts that one needs to know while studying Climatology/Meteorology. It also includes basic derivations and equations.
Hope this file reaches you. Please share it with your friends and collegues
The document discusses different types of winds and factors that influence wind patterns. It explains that convection currents cause local winds like sea and land breezes as land and bodies of water heat and cool at different rates. Prevailing winds blow over long distances due to global wind patterns influenced by unequal heating from the sun and the Coriolis effect from the Earth's rotation. These winds are classified into belts and some regions experience seasonal monsoon winds as air pressures and temperatures shift between land and ocean areas.
Energy transfer in the atmosphere and oceansmgcimariam
The document discusses various ways that energy is transferred within the atmosphere and between the atmosphere and oceans/land. It describes how the sun's radiation is absorbed, reflected, scattered, or transmitted by gases in the atmosphere. Thermal energy is also transferred via conduction, convection, and radiation. Convection currents globally distribute heat. Prevailing winds are influenced by these currents. Ocean currents similarly redistribute warm and cold water around the world through processes like the global conveyor belt. Latent heat absorption and release also influences global climate patterns.
The document discusses jet streams, which are narrow bands of strong winds found in the westerlies in the upper atmosphere. There are typically two jet streams in each hemisphere - a polar jet around 30-60°N and a subtropical jet around 20-30°N. Jet streams form due to temperature differences between air masses and can reach speeds of over 200 knots, influencing global weather and being an important factor for transcontinental flight planning.
The global atmospheric circulation system transports heat around the Earth's atmosphere and affects climate and weather patterns. It involves warm air rising at the equator and cold air sinking at the poles, creating circulation cells. Without this system, temperatures would become more extreme between the tropics and poles.
This document discusses various concepts related to atmospheric humidity and cloud formation. It defines specific humidity, relative humidity, dew point, and how temperature affects the air's capacity to hold moisture. It explains the different types of atmospheric stability and instability, including stable, conditionally unstable, and absolutely unstable air. The document also covers cloud development processes like convection, collision and coalescence, ice crystal growth, and precipitation formation. Finally, it describes the characteristics and formation of different cloud types like cirrus, cumulus, stratus and nimbostratus clouds.
The document discusses how the ocean affects climate through various mechanisms:
1) It regulates global temperature by storing and transporting heat around the globe via currents and influences wind and precipitation patterns.
2) Ocean currents stabilize climate in coastal regions and bring nutrients to marine environments.
3) The ocean cycles gases by absorbing large amounts of carbon dioxide from the atmosphere.
4) Human activities like greenhouse gas emissions and land use changes are altering the climate system.
Jet streams are strong winds that generally blow from west to east at high altitudes near the tropopause. They form when warm and cold air masses meet, causing the warm air to rise and cold air to sink. There are two major types: subtropical jet streams, which circulate above 30-35 degrees latitude year-round; and polar front jet streams, which are more irregular and formed above the convergence of polar and tropical air masses. Jet streams have immense influence on local and regional weather conditions.
1.1 Climate change and impacts on hydrological extremes (P.Willems)Stevie Swenne
Presentation of Patrick Willems (KU Leuven) on 'Climate change and impacts on hydrological extremes' during the conference 'Environmental challenges & Climate change opportunities' organised by Flanders Environment Agency (VMM)
The document discusses various aspects of weather forecasting by the National Weather Service and U.S. Navy. It describes the different types of forecasts produced, including area forecasts by major Navy units, flight forecasts for successive flight stages, and local forecasts by ships and stations. It also outlines the roles of organizations like the National Oceanic and Atmospheric Administration, National Weather Service, and Navy Meteorology and Oceanography Command in coordinating weather data collection and forecasting activities.
Tides are caused by the gravitational attraction of the moon and sun on the oceans as well as the centrifugal force from the Earth's rotation. High tides occur where the moon is overhead, while low tides happen 90 degrees away, and both the moon and sun's gravitational pulls contribute to the regular rising and falling of sea levels, though the moon has a greater effect being closer to Earth.
The solar radiation that reaches Earth is the primary energy source that drives atmospheric and oceanic circulation systems and the hydrologic cycle. Most of the radiation emitted from the sun is in the visible spectrum. While some solar radiation is reflected or scattered by gases, particles, and surfaces like clouds, ice, and snow, most is absorbed by Earth and its atmosphere. This absorbed solar energy is then re-radiated as terrestrial radiation and helps maintain the planet's heat balance.
This document summarizes atmospheric circulation and pressure distributions. It describes the single-cell and three-cell models of atmospheric circulation, including the Hadley cell, Ferrel cell, and polar cell. It discusses global wind patterns, pressure systems like the subtropical high and Intertropical Convergence Zone, and factors that influence winds like solar heating and the Coriolis effect. It also mentions regional circulation features and pressure systems, ocean currents, and mesoscale and microscale atmospheric phenomena.
This document summarizes key concepts about atmospheric pressure and global wind patterns from a geography textbook chapter. It defines important terms like isobars, high and low pressure systems, and describes the major wind systems - including the trade winds, westerlies, and polar easterlies - that make up the general circulation of the atmosphere. Specific wind patterns like the Hadley cell and subtropical high are explained in terms of atmospheric pressure gradients and the Coriolis effect.
Here you can find the Ocean circulation, as it is happening by natural activities, Coriolis effect will occur due to the wind pattern and changes in the ocean floors.
Earth's energy budget refers to the tracking of how much energy is flowing into and out of the Earth's climate, where the energy is going, and if the energy coming in balances with the energy going out. The Earth receives energy from the Sun, and it also reflects and radiates energy back into space. All of the energy that warms the atmosphere, oceans and land must be radiated back into space in order to maintain our current climate. If the amount of energy radiating back into space is decreased by even a very small amount, it can lead to warming. It is believed that increasing levels of carbon dioxide in the atmosphere has a 'greenhouse effect' of reducing the amount of energy radiated into space.
The document discusses the Earth's radiation budget, which is the balance between incoming solar radiation and outgoing radiation from the Earth. The key components of the radiation budget are:
- Incoming solar radiation that is either reflected by surfaces like snow or absorbed by the Earth and atmosphere
- Heat from absorbed solar radiation that is re-emitted from the Earth and atmosphere as outgoing longwave radiation
- Greenhouse gases that absorb most outgoing longwave radiation, warming the lower atmosphere and maintaining heat on Earth
- Various factors like clouds, surface albedo, and latitude that influence the radiation budget and distribution of heat globally.
The document analyzes sea surface temperature data in the Arctic from 1982 to 2006. It describes using imaging software to measure the area of water below 15 degrees Celsius over time. The results found the area fluctuated without a clear decreasing or increasing trend. This disproved the hypothesis that the area would consistently decrease due to global warming. Future small changes are possible but human impacts are minimal currently.
Climatology is the science of studying the average atmospheric conditions of a region in long-term perspective. The primary goal of Climatology is to study the unique characteristics of atmosphere in controlling the global climate, origin, types of climates, causes and processes influencing the climatic variations, elements of weather and the impact of climate on humans or vice-versa.
Structure and Composition of the Atmospherebeaudry2011
The atmosphere is composed of gases, water droplets, and particles surrounding Earth. It has four main layers - the troposphere, stratosphere, mesosphere, and thermosphere - each decreasing or increasing in temperature with altitude. The troposphere is where weather occurs, extending 8-16km high. Above is the stratosphere where temperatures increase with little weather, then the mesosphere where temperatures decrease again up to 80km. The thermosphere is the outermost layer with increasing temperatures from 80km high. The atmosphere composition consists primarily of nitrogen, oxygen, argon, and trace gases. Water vapor is the most abundant variable gas.
Climate models are tools used in climate research that range in complexity from simple zero-dimensional energy balance models to complex three-dimensional general circulation models. They work by solving equations that conserve mass, momentum, energy and other quantities in grid boxes. Climate models are evaluated by comparing their results to observations. They are used for applications such as detecting and attributing causes of climate change, making projections of future climate change, and studying past climates.
This document discusses several key indicators and phases of the El Niño-Southern Oscillation (ENSO) cycle in the tropical Pacific:
(1) It describes the typical conditions during La Niña versus El Niño phases, including differences in sea surface temperatures, wind patterns, thermocline depth and precipitation across the eastern and western tropical Pacific.
(2) It explains how ENSO is a coupled ocean-atmosphere phenomenon, with interactions and feedbacks between the two systems either enhancing or suppressing the phases.
(3) It provides illustrations of the average December-February conditions and how the patterns differ and evolve during La Niña and El Niño episodes.
Thermohaline Circulation & Climate ChangeArulalan T
Today I have presented "The Thermohaline Circulation and Climate Change" as Mini-Project for our Science of Climate Change Course ! We can expect THC shutdown around 2050s... OMG ! Yes, we can expect "The Day After Tomorrow" around 2100... All the images credited to the reference papers except one T-S-Sigmat created by me using CDAT5.2.
Ocean currents are driven by both wind at the surface and density differences in deep water. Surface currents move large amounts of heat and water around the world's oceans. Below the surface, thermohaline circulation involves the slow movement of dense water masses that sink and flow horizontally, driven by differences in water density due to temperature and salinity. Together, surface and deep ocean currents form the global conveyor belt that redistributes heat around the planet.
The document summarizes Milutin Milanković's theory that variations in the Earth's orbit and axial tilt (known as Milankovitch cycles) influence long-term climate changes by affecting the amount of solar radiation reaching the Earth. These cycles are caused by changes in the Earth's eccentricity, obliquity, and precession over thousands to hundreds of thousands of years. Lower summer insolation in the Northern Hemisphere due to these orbital variations can trigger ice ages by preventing summer melting of winter snows and ice accumulation. Stratigraphic evidence from oxygen isotopes and fossils correlates past climate changes with Milankovitch cycle patterns.
Atmospheric science is the study of the atmosphere, its processes, and interactions with other systems. It includes subdisciplines like atmospheric physics, chemistry, dynamics, climatology, meteorology, and the study of other planetary atmospheres. Meteorology focuses on weather forecasting and includes the study of temperature, pressure, humidity, wind, and their changes over time. The history of meteorology dates back thousands of years, with early contributions from cultures around the world, and major advances driven by scientific discoveries over the centuries. Modern meteorology plays an important role in fields like navigation, aviation, agriculture, and understanding climate change.
The document discusses atmospheric stability and its relationship to moisture and weather. It defines stable, unstable, and conditionally unstable atmospheres based on environmental lapse rates. Stability impacts cloud formation and precipitation - unstable air leads to tall clouds and heavy rain while stable air suppresses vertical air movement and yields light precipitation. Daily changes in temperature and moisture content can increase or decrease atmospheric stability.
This lesson describes the vertical structure of the atmosphere and how temperature changes with altitude affect atmospheric stability and vertical air movement. It introduces adiabatic diagrams to explain conditions that encourage or limit pollutant dispersion. Unstable conditions with air parcels rising allow dispersion, while stable conditions or inversions with warmer air trapped above cooler air limit dispersion. Neutral conditions neither encourage nor limit vertical air movement.
Thermodynamics deals with concepts of heat, temperature, and energy conversion. Thermal equilibrium occurs between substances when there is no further heat transfer between them. Internal energy is the total energy of all atoms and molecules in a substance due to their random motion. Thermodynamic systems are classified as open, closed, or isolated based on heat and matter transfer ability. The first law of thermodynamics relates heat and work through a mathematical equation. Entropy is a measure of disorder or randomness that increases for energy received by a system and decreases for energy given out. The second law of thermodynamics prohibits heat from spontaneously flowing from cold to hot without work.
The document discusses key concepts in thermodynamics including:
1. Thermodynamics is the study of heat and its transformation into mechanical energy. It describes the relationship between heat and work.
2. The first law of thermodynamics states that energy cannot be created or destroyed, and that whenever heat is added to a system, it transforms into an equal amount of internal energy or external work done by the system.
3. Thermodynamic processes can be represented on pressure-volume diagrams, which show how properties change as a system undergoes different thermodynamic processes like expansion or compression.
This document provides an introduction to basic concepts in thermodynamics. It discusses that thermodynamics deals with various forms of energy and the laws governing the transformation of energy. Engineering thermodynamics specifically applies these concepts to power generation and machinery. Key concepts introduced include:
- Thermodynamic systems and processes involve a working substance or medium that can store and transfer energy.
- The state of a substance is defined by properties like pressure, volume, temperature, etc.
- A thermodynamic cycle occurs when a system returns to its initial state after undergoing a series of processes.
1) The document discusses concepts of atmospheric thermodynamics including the ideal gas law, hydrostatic balance, heat and temperature, conduction, convection, radiation, latent heating, and adiabatic processes.
2) It provides explanations and formulas for calculating variables like gas constant, virtual temperature, scale height, and relates these to atmospheric vertical structure.
3) Heat can be transferred through conduction, convection, advection, radiation, and latent heating, which influence air temperature changes.
Thermodynamics is the branch of physics that deals with heat and other forms of energy. The first law of thermodynamics states that the total energy of a system remains constant, such that any increase in one form of energy (such as heat) results in an equal decrease in another form (such as work). The second law states that heat cannot spontaneously flow from a colder body to a hotter body without an input of work. The third law states that the entropy of a perfect crystal approaches zero as the temperature approaches absolute zero.
This document discusses key concepts in thermodynamics including:
1. Thermodynamics is concerned with energy relationships involving heat, mechanical energy, and other aspects of energy transfer between systems and their surroundings. Temperature is a measure of an object's hotness or coldness.
2. The zeroth law of thermodynamics allows the definition of temperature and states that if two bodies are in thermal equilibrium with a third body, they are in thermal equilibrium with each other.
3. An ideal gas is a theoretical gas that follows the ideal gas law (PV=nRT) and behaves similarly to real gases at high temperatures and low pressures. The ideal gas law relates the pressure, volume, temperature, and amount
Humidity refers to the amount of water vapor in the air. It can be measured using instruments like a psychrometer, which uses the difference between dry and wet bulb thermometer readings. Relative humidity indicates the percentage of water vapor an air sample can hold compared to its maximum capacity. Other expressions of humidity include vapor pressure, absolute humidity, dewpoint, specific humidity, and mixing ratio. Proper measurement requires accounting for factors like temperature fluctuations, instrument errors, and air ventilation.
The document discusses atmospheric humidity and related concepts. It defines humidity as the amount of water vapor in the air, and notes that humidity varies due to evaporation and condensation. Instruments like psychrometers are used to measure humidity by determining the difference between wet and dry bulb temperatures. The document also examines vapor pressure, dew point, relative humidity, and other terms, and how humidity levels fluctuate over time due to factors like temperature changes and the seasons.
Temperature is a measure of the average kinetic energy of particles in a substance. It is expressed on comparative scales like Celsius, Fahrenheit and Kelvin. Thermometers use materials like mercury that expand with increasing heat to measure temperature. Temperature inversions occur when warm air is above cooler air near the surface, trapping pollutants. Inversions impact air quality by preventing the dispersion of pollution. Clouds also impact temperature by reflecting sunlight to lower maximum temperatures while trapping heat at night to raise minimums.
Thermodynamics is the branch of physics that deals with heat, work, and temperature, and their relation to energy, radiation, and physical properties of matter. It explains interactions of variables in an system in terms of conservation of energy. The four main concepts are heat, temperature, entropy, and the laws of thermodynamics. Heat is energy transferred between objects at different temperatures. Temperature is a measure of average kinetic energy. Entropy represents disorder and waste heat. The laws govern energy transfer and conservation.
Climate feedbacksWe talked briefly about the positivWilheminaRossi174
Climate �feedbacks�
We talked briefly about the positive feedback processes of climate
change in previous lectures. What is “feedback”?
Feedback is a concept that explains the interaction of the climate
system that alters changes in climate. When the rate of climate change
is amplified (either by warming or cooling), the process is called
“positive feedback”. The upper figure demonstrates the basic way that
these feedbacks operate.
On the other hand, when the rate of climate change is suppressed, then
the process is called “negative feedback” (lower figure).
Primary Climate System Feedbacks
• Radiation feedback (hotter planet radiates
more energy out to space, E=sT4)
• Snow/ice-albedo feedback
• Water Vapor feedback
• Cloud feedback (high versus low clouds)
So, climate feedbacks are a loop of cause and effect; positive (amplifier) and
negative feedbacks (stabilizer). Some feedback processes are more
complicated than others. Here are a few important feedbacks that affect our
climate system.
Temperatureà radiation feedback
Energy emitted = σT4
éTemperature
éradiation to
space
éCO2
êTemperature
The temperature of the Earth is increasing due to a rise in greenhouse gases in
the atmosphere. Thus, how will the climate feedback system change with this
temperature increase?
First, increases in temperature will alter radiation feedback because the energy
emitted from a blackbody is proportionate to its temperature to the fourth (σT4).
Feedback process: Increasing CO2 concentration in the atmosphere – increasing
temperature – increasing associated energy radiation to space – decreasing
temperature
Thus, increasing CO2 is a negative feedback process in the long term. However,
this feedback process in the climate system is far more complex. This is not the
only feedback loop that we know of.
Snow/sea ice albedo feedback
Melting of snow/sea ice directly affects the
albedo of the Earth (less ice = decrease in albedo)
Measuring Earth’s Albedo
https://earthobservatory.nasa.gov/IOTD/view.php
?id=84499
https://earthobservatory.nasa.gov/IOTD/view.php?id=84499
Also, we have seen how
recent warming has
been impacting the
arctic sea ice (see the
following two slides)
Polar amplification!
Global temperature departures from average
during January through May 2020, compared
with a 1951-1980 average. (Berkeley Earth).
Greater climate change observed near the pole responds to changes in the
radiation balance (e.g. intensified greenhouse effect). This phenomenon is
known as “polar amplification”.
Melting sea ice in the Arctic decreases the Earth’s albedo. Changes in albedo are
likely contributing to significant temperature increases in the northern
hemisphere. The increase in surface temperature is observed mainly in the
higher latitude in the northern hemisphere, where most sea ice is, and where
there is a greater continental distribution (more continent is located in the
northern hemisph ...
The document discusses the four laws of thermodynamics: (1) the zeroth law which underlies the definition of temperature, (2) the first law which mandates conservation of energy and states that heat is a form of energy, (3) the second law which states that entropy of the universe always increases, and (4) the third law which concerns entropy at absolute zero temperature. It also defines key thermodynamic concepts like internal energy, heat, and work.
Meteorological factors such as wind speed, temperature, and humidity influence the dispersion of air pollutants from their sources. Calm air with low wind allows pollutants to accumulate near their source, while strong winds disperse pollutants over larger areas, lowering their concentration. Temperature inversions trap pollutants near the ground. Rain can help remove pollutants from the air but can also lead to acid rain. Turbulence and stability of the atmosphere determine how pollutant plumes behave and spread. Different plume types occur under varying meteorological conditions and impact pollutant concentrations near the ground.
Chapter 13 temperature kinetic theory and the gas lawsSarah Sue Calbio
Thermal equilibrium and the zeroth law of thermodynamics are introduced. The document defines temperature as what is measured by a thermometer and discusses different temperature scales. It states that two systems are in thermal equilibrium when placed in contact and their temperatures do not change to equalize. The zeroth law establishes that if objects A and B are in thermal equilibrium, and objects B and C are also in thermal equilibrium, then objects A and C must be in thermal equilibrium as well.
Weather & climate{project work} by Aman MaqsoodAman Maqsood
The document discusses the key differences between weather and climate. It defines weather as the short-term atmospheric conditions of a place at a given time, measured in days or weeks. Climate is defined as the average weather conditions of a region over a long period of time, typically 30 years. The document then outlines some of the main elements that define weather and climate, such as temperature, pressure, wind, humidity, precipitation, and sunlight. It provides details on how each of these elements is measured.
The State of Atmosphere Stability and Instability Effects on Air Qualitytheijes
The ascending air parcel will expand, and it will experience not only lowering of its pressure and density, but also of its temperature. All three state variables: pressure, density, and temperature will remain in balance as described by the gas law. By combining the equation of state, the first law of thermodynamics, and the hydrostatic equation, the rate of adiabatic temperature change in an ascending air parcel can be found. Atmospheric lapse is a measure of how much air decreases in temperature as it rises through the atmosphere. There are three types of lapse rates: dry-adiabatic, environmental lapse rates, and saturated or moist-adiabatic. The stability of air parcel under vertical displacement is determined by the comparing its laps rate with the environmental laps rate. There are three basic categories in which the atmosphere or a layer in the atmosphere can be classified in terms of stability. These categories are stable, unstable, and neutral. Atmospheric stability is also an extremely important issue in reference to air quality. We can tell how pollutant emissions are likely to disperse and what the likely ground level concentration patterns will be if we know how stable (or unstable) the atmosphere is at a given time. Inversions are associated with minimal air mixing, or more stable atmospheric conditions, and thus generate the highest downwind concentrations from an effluent source.
Ivanolegov thermodynamics serbian 4th edition test bank 1Ivan Olegov
Thermal energy is the energy a compound or system has due to its temperature, i.e., the power of moving or shaking molecules, according to the Power Education web site of the Texas Education Company. Thermodynamics involves determining this energy, which can be "exceptionally complicated," according to David McKee, a teacher of physics at Missouri Southern State University. Commonly this is idealized as the mass of the system, the stress of the system, and the quantity of the system, or some various other comparable set of numbers.
The document summarizes the four laws of thermodynamics:
1) The first law states that energy cannot be created or destroyed, only changed in form.
2) The second law states that the entropy of an isolated system always increases.
3) The third law states that the entropy of a system approaches a minimum, zero, as the temperature approaches absolute zero.
4) There is no universally accepted fourth law, but some proposals include the Onsager reciprocal relations regarding heat and matter flow parameters.
Similar to ATMOSPHERIC THERMODYNAMICS BASIC CONCEPTS.pptx (20)
The ability to recreate computational results with minimal effort and actionable metrics provides a solid foundation for scientific research and software development. When people can replicate an analysis at the touch of a button using open-source software, open data, and methods to assess and compare proposals, it significantly eases verification of results, engagement with a diverse range of contributors, and progress. However, we have yet to fully achieve this; there are still many sociotechnical frictions.
Inspired by David Donoho's vision, this talk aims to revisit the three crucial pillars of frictionless reproducibility (data sharing, code sharing, and competitive challenges) with the perspective of deep software variability.
Our observation is that multiple layers — hardware, operating systems, third-party libraries, software versions, input data, compile-time options, and parameters — are subject to variability that exacerbates frictions but is also essential for achieving robust, generalizable results and fostering innovation. I will first review the literature, providing evidence of how the complex variability interactions across these layers affect qualitative and quantitative software properties, thereby complicating the reproduction and replication of scientific studies in various fields.
I will then present some software engineering and AI techniques that can support the strategic exploration of variability spaces. These include the use of abstractions and models (e.g., feature models), sampling strategies (e.g., uniform, random), cost-effective measurements (e.g., incremental build of software configurations), and dimensionality reduction methods (e.g., transfer learning, feature selection, software debloating).
I will finally argue that deep variability is both the problem and solution of frictionless reproducibility, calling the software science community to develop new methods and tools to manage variability and foster reproducibility in software systems.
Exposé invité Journées Nationales du GDR GPL 2024
ESR spectroscopy in liquid food and beverages.pptxPRIYANKA PATEL
With increasing population, people need to rely on packaged food stuffs. Packaging of food materials requires the preservation of food. There are various methods for the treatment of food to preserve them and irradiation treatment of food is one of them. It is the most common and the most harmless method for the food preservation as it does not alter the necessary micronutrients of food materials. Although irradiated food doesn’t cause any harm to the human health but still the quality assessment of food is required to provide consumers with necessary information about the food. ESR spectroscopy is the most sophisticated way to investigate the quality of the food and the free radicals induced during the processing of the food. ESR spin trapping technique is useful for the detection of highly unstable radicals in the food. The antioxidant capability of liquid food and beverages in mainly performed by spin trapping technique.
EWOCS-I: The catalog of X-ray sources in Westerlund 1 from the Extended Weste...Sérgio Sacani
Context. With a mass exceeding several 104 M⊙ and a rich and dense population of massive stars, supermassive young star clusters
represent the most massive star-forming environment that is dominated by the feedback from massive stars and gravitational interactions
among stars.
Aims. In this paper we present the Extended Westerlund 1 and 2 Open Clusters Survey (EWOCS) project, which aims to investigate
the influence of the starburst environment on the formation of stars and planets, and on the evolution of both low and high mass stars.
The primary targets of this project are Westerlund 1 and 2, the closest supermassive star clusters to the Sun.
Methods. The project is based primarily on recent observations conducted with the Chandra and JWST observatories. Specifically,
the Chandra survey of Westerlund 1 consists of 36 new ACIS-I observations, nearly co-pointed, for a total exposure time of 1 Msec.
Additionally, we included 8 archival Chandra/ACIS-S observations. This paper presents the resulting catalog of X-ray sources within
and around Westerlund 1. Sources were detected by combining various existing methods, and photon extraction and source validation
were carried out using the ACIS-Extract software.
Results. The EWOCS X-ray catalog comprises 5963 validated sources out of the 9420 initially provided to ACIS-Extract, reaching a
photon flux threshold of approximately 2 × 10⁻⁸ photons cm−2
s
−1
. The X-ray sources exhibit a highly concentrated spatial distribution,
with 1075 sources located within the central 1 arcmin. We have successfully detected X-ray emissions from 126 out of the 166 known
massive stars of the cluster, and we have collected over 71 000 photons from the magnetar CXO J164710.20-455217.
The use of Nauplii and metanauplii artemia in aquaculture (brine shrimp).pptxMAGOTI ERNEST
Although Artemia has been known to man for centuries, its use as a food for the culture of larval organisms apparently began only in the 1930s, when several investigators found that it made an excellent food for newly hatched fish larvae (Litvinenko et al., 2023). As aquaculture developed in the 1960s and ‘70s, the use of Artemia also became more widespread, due both to its convenience and to its nutritional value for larval organisms (Arenas-Pardo et al., 2024). The fact that Artemia dormant cysts can be stored for long periods in cans, and then used as an off-the-shelf food requiring only 24 h of incubation makes them the most convenient, least labor-intensive, live food available for aquaculture (Sorgeloos & Roubach, 2021). The nutritional value of Artemia, especially for marine organisms, is not constant, but varies both geographically and temporally. During the last decade, however, both the causes of Artemia nutritional variability and methods to improve poorquality Artemia have been identified (Loufi et al., 2024).
Brine shrimp (Artemia spp.) are used in marine aquaculture worldwide. Annually, more than 2,000 metric tons of dry cysts are used for cultivation of fish, crustacean, and shellfish larva. Brine shrimp are important to aquaculture because newly hatched brine shrimp nauplii (larvae) provide a food source for many fish fry (Mozanzadeh et al., 2021). Culture and harvesting of brine shrimp eggs represents another aspect of the aquaculture industry. Nauplii and metanauplii of Artemia, commonly known as brine shrimp, play a crucial role in aquaculture due to their nutritional value and suitability as live feed for many aquatic species, particularly in larval stages (Sorgeloos & Roubach, 2021).
Remote Sensing and Computational, Evolutionary, Supercomputing, and Intellige...University of Maribor
Slides from talk:
Aleš Zamuda: Remote Sensing and Computational, Evolutionary, Supercomputing, and Intelligent Systems.
11th International Conference on Electrical, Electronics and Computer Engineering (IcETRAN), Niš, 3-6 June 2024
Inter-Society Networking Panel GRSS/MTT-S/CIS Panel Session: Promoting Connection and Cooperation
https://www.etran.rs/2024/en/home-english/
When I was asked to give a companion lecture in support of ‘The Philosophy of Science’ (https://shorturl.at/4pUXz) I decided not to walk through the detail of the many methodologies in order of use. Instead, I chose to employ a long standing, and ongoing, scientific development as an exemplar. And so, I chose the ever evolving story of Thermodynamics as a scientific investigation at its best.
Conducted over a period of >200 years, Thermodynamics R&D, and application, benefitted from the highest levels of professionalism, collaboration, and technical thoroughness. New layers of application, methodology, and practice were made possible by the progressive advance of technology. In turn, this has seen measurement and modelling accuracy continually improved at a micro and macro level.
Perhaps most importantly, Thermodynamics rapidly became a primary tool in the advance of applied science/engineering/technology, spanning micro-tech, to aerospace and cosmology. I can think of no better a story to illustrate the breadth of scientific methodologies and applications at their best.
Describing and Interpreting an Immersive Learning Case with the Immersion Cub...Leonel Morgado
Current descriptions of immersive learning cases are often difficult or impossible to compare. This is due to a myriad of different options on what details to include, which aspects are relevant, and on the descriptive approaches employed. Also, these aspects often combine very specific details with more general guidelines or indicate intents and rationales without clarifying their implementation. In this paper we provide a method to describe immersive learning cases that is structured to enable comparisons, yet flexible enough to allow researchers and practitioners to decide which aspects to include. This method leverages a taxonomy that classifies educational aspects at three levels (uses, practices, and strategies) and then utilizes two frameworks, the Immersive Learning Brain and the Immersion Cube, to enable a structured description and interpretation of immersive learning cases. The method is then demonstrated on a published immersive learning case on training for wind turbine maintenance using virtual reality. Applying the method results in a structured artifact, the Immersive Learning Case Sheet, that tags the case with its proximal uses, practices, and strategies, and refines the free text case description to ensure that matching details are included. This contribution is thus a case description method in support of future comparative research of immersive learning cases. We then discuss how the resulting description and interpretation can be leveraged to change immersion learning cases, by enriching them (considering low-effort changes or additions) or innovating (exploring more challenging avenues of transformation). The method holds significant promise to support better-grounded research in immersive learning.
The debris of the ‘last major merger’ is dynamically youngSérgio Sacani
The Milky Way’s (MW) inner stellar halo contains an [Fe/H]-rich component with highly eccentric orbits, often referred to as the
‘last major merger.’ Hypotheses for the origin of this component include Gaia-Sausage/Enceladus (GSE), where the progenitor
collided with the MW proto-disc 8–11 Gyr ago, and the Virgo Radial Merger (VRM), where the progenitor collided with the
MW disc within the last 3 Gyr. These two scenarios make different predictions about observable structure in local phase space,
because the morphology of debris depends on how long it has had to phase mix. The recently identified phase-space folds in Gaia
DR3 have positive caustic velocities, making them fundamentally different than the phase-mixed chevrons found in simulations
at late times. Roughly 20 per cent of the stars in the prograde local stellar halo are associated with the observed caustics. Based
on a simple phase-mixing model, the observed number of caustics are consistent with a merger that occurred 1–2 Gyr ago.
We also compare the observed phase-space distribution to FIRE-2 Latte simulations of GSE-like mergers, using a quantitative
measurement of phase mixing (2D causticality). The observed local phase-space distribution best matches the simulated data
1–2 Gyr after collision, and certainly not later than 3 Gyr. This is further evidence that the progenitor of the ‘last major merger’
did not collide with the MW proto-disc at early times, as is thought for the GSE, but instead collided with the MW disc within
the last few Gyr, consistent with the body of work surrounding the VRM.
Immersive Learning That Works: Research Grounding and Paths ForwardLeonel Morgado
We will metaverse into the essence of immersive learning, into its three dimensions and conceptual models. This approach encompasses elements from teaching methodologies to social involvement, through organizational concerns and technologies. Challenging the perception of learning as knowledge transfer, we introduce a 'Uses, Practices & Strategies' model operationalized by the 'Immersive Learning Brain' and ‘Immersion Cube’ frameworks. This approach offers a comprehensive guide through the intricacies of immersive educational experiences and spotlighting research frontiers, along the immersion dimensions of system, narrative, and agency. Our discourse extends to stakeholders beyond the academic sphere, addressing the interests of technologists, instructional designers, and policymakers. We span various contexts, from formal education to organizational transformation to the new horizon of an AI-pervasive society. This keynote aims to unite the iLRN community in a collaborative journey towards a future where immersive learning research and practice coalesce, paving the way for innovative educational research and practice landscapes.
3. 0TH LAW:
The Zeroth law of thermodynamics states that if two bodies are individually in
equilibrium with a separate third body, then the first two bodies are also in
thermal equilibrium with each other.
1ST LAW:
First law of thermodynamics, also known as the law of conservation of energy,
states that energy can neither be created nor destroyed, but it can be changed
from one form to another.
2ND LAW:
Second law of thermodynamics states that the entropy in an isolated system
always increases. Any isolated system spontaneously evolves towards thermal
equilibrium—the state of maximum entropy of the system.
3RD LAW:
Third law of thermodynamics states that the entropy of a system approaches
a constant value as the temperature approaches absolute zero.
4. OTH LAW:
The zeroth law of thermodynamics is a fundamental principle that
establishes the concept of temperature and thermal equilibrium. It
states that if two systems are in thermal equilibrium with a third
system, then they are also in thermal equilibrium with each other.
This law is the basis for the measurement of temperature and the
concept of thermal equilibrium.
5. 1ST LAW:
The first law of thermodynamics has several important implications. For
example, it means that if energy is added to a system, the system's internal
energy will increase. This can manifest itself in various forms, such as an
increase in temperature or an increase in pressure. Conversely, if energy is
removed from a system, the internal energy will decrease.
The first law of thermodynamics also applies to open systems, which are
systems that can exchange energy and matter with their surroundings. In an
open system, the energy added to or removed from the system can be in the
form of work done by or on the system, or heat transferred into or out of the
system.
The first law of thermodynamics is a fundamental principle that has many
practical applications. It is used in the study of engines, refrigeration systems,
and other energy conversion systems. It is also used in the analysis of chemical
reactions and in the study of the behavior of materials under different
conditions. The first law of thermodynamics is a cornerstone of the field of
6. The first law of thermodynamics is applicable to weather systems as well. It
states that the energy of an isolated system is constant, and this applies to
the atmosphere, which is an open system that exchanges energy and matter
with its surroundings.
In meteorology, the first law of thermodynamics is used to understand how
energy is transferred and transformed within the atmosphere. The sun
provides the energy that drives atmospheric processes, such as the
movement of air masses, the formation of clouds, and the distribution of
heat and moisture.
When sunlight enters the atmosphere, it is either absorbed or reflected. The
absorbed energy is converted into heat, which is then transferred to the
surrounding air. This process leads to an increase in temperature, which can
result in the formation of convective currents and the movement of air
masses.
The first law of thermodynamics also applies to the formation and
movement of clouds. Clouds are formed when warm, moist air rises and
cools, leading to the condensation of water vapor. The release of latent heat
during condensation helps to fuel the upward movement of air, which can
7. CONTINUED…
The first law of thermodynamics is also important in understanding
the distribution of heat and moisture within the atmosphere. Heat is
transferred from warmer areas to cooler areas through conduction,
convection, and radiation. This transfer of heat helps to balance the
temperature and moisture content of the atmosphere, which is
important for the formation and movement of weather systems.
Overall, the first law of thermodynamics is a crucial concept in
understanding the behavior of energy in weather systems. It helps
meteorologists to predict and understand weather patterns and to
develop more accurate models of atmospheric processes.
8. The first law of thermodynamics in weather systems can be expressed
mathematically as follows:
ΔU = Q - W
Where ΔU is the change in internal energy of the system, Q is the heat
added to the system, and W is the work done on or by the system.
In meteorology, this equation can be used to describe the behavior of
the atmosphere, which can be considered as an open system that
exchanges energy and matter with its surroundings.
9. For example, if we consider a parcel of air moving upward in the
atmosphere, we can use the first law of thermodynamics to describe
the changes in internal energy, heat transfer, and work done on the
parcel.
As the parcel rises, it expands and cools due to adiabatic cooling.
This means that no heat is added or removed from the parcel, so Q =
0. The work done on the parcel is also negligible, so W = 0.
Therefore, the change in internal energy of the parcel is equal to the
negative of the work done by the parcel due to the expansion:
ΔU = -W
This equation can be used to calculate the change in temperature of
the parcel as it rises.
10. The work done by the parcel is equal to the product of the pressure
difference and the change in volume:
W = PΔV
Substituting this into the equation for ΔU, we get:
ΔU = -PΔV
Since the parcel is rising, its volume is increasing, so ΔV is positive.
Therefore, the change in internal energy of the parcel is negative, which
means that its temperature decreases as it rises.
This equation can be used to calculate the adiabatic lapse rate, which is the
rate at which the temperature of a parcel of air changes as it rises due to
adiabatic cooling. The adiabatic lapse rate is given by:
ΔT/Δz = -g/Cp
Where ΔT is the change in temperature of the parcel, Δz is the change in
altitude, g is the acceleration due to gravity, and Cp is the specific heat
capacity of air at constant pressure.
11. This equation shows that the adiabatic lapse rate is a function of the
acceleration due to gravity and the specific heat capacity of air.
Therefore, it depends on the composition of the atmosphere and the
altitude at which the parcel is rising.
Overall, the first law of thermodynamics provides a fundamental
framework for understanding the behavior of the atmosphere and the
processes that drive weather patterns.
12. PSEUDO- ADIABATIC PROCESS
A pseudo-adiabatic process in meteorology refers to an air parcel's
ascent, where it is allowed to cool adiabatically until it reaches its dew
point temperature, and then it continues to cool at a slower rate, but
not entirely adiabatically, because condensation occurs, and latent
heat is released into the parcel.
When an air parcel ascends, it expands and cools adiabatically due to
decreasing pressure. The rate at which an air parcel cools adiabatically
is called the dry adiabatic lapse rate (DALR), which is approximately
9.8°C per kilometer for dry air. However, as the parcel continues to
rise, it may reach a level where its temperature reaches the dew point,
and water vapor starts to condense. As the water vapor condenses
into liquid droplets, latent heat is released, which warms the air
parcel. This process of condensation and release of latent heat slows
down the rate of cooling, and the parcel cools at a slower rate than
the DALR. This slower rate of cooling is called the pseudo-adiabatic
lapse rate (or saturated adiabatic lapse rate) and is typically around
13. The pseudo-adiabatic process is crucial in meteorology because
it affects the vertical distribution of moisture in the
atmosphere, which, in turn, affects cloud formation and
precipitation. When an air parcel rises and cools, it reaches a
level where its temperature drops to its dew point temperature,
and condensation begins. If the parcel continues to rise and
cool, it may reach a level where it becomes saturated and forms
a cloud. As the cloud continues to grow, precipitation may form
if the cloud droplets or ice particles become large enough to
fall to the ground.
In summary, a pseudo-adiabatic process in meteorology refers
to the cooling of an air parcel as it rises and reaches its dew
point temperature, and condensation occurs, releasing latent
heat that slows down the cooling rate. This process is crucial
for understanding cloud formation and precipitation and is
essential in weather forecasting.
14. ADIABATIC LAPSE RATE
The adiabatic lapse rate is the rate at which the temperature of an air parcel changes as
it rises or sinks in the atmosphere without any exchange of heat with its surroundings,
i.e., adiabatically. The adiabatic lapse rate is an important concept in atmospheric
science and is used to explain many atmospheric phenomena, including the formation
of clouds and the development of thunderstorms.
There are two types of adiabatic lapse rates, dry adiabatic lapse rate (DALR) and moist
adiabatic lapse rate (MALR).
The dry adiabatic lapse rate (DALR) is the rate at which the temperature of a parcel of
dry air changes as it rises or sinks in the atmosphere without exchanging heat with its
surroundings. It is approximately equal to 9.8°C per kilometer (or 5.4°F per 1000 feet)
and is a function of the specific heat of dry air, which is constant at constant pressure.
The dry adiabatic lapse rate can be derived from the first law of thermodynamics, which
states that the internal energy of a system remains constant if no heat is exchanged
with the surroundings. As an air parcel rises in the atmosphere, it expands due to
decreasing atmospheric pressure. The expansion of the air parcel results in a decrease
in temperature, as the internal energy of the system remains constant.
15. The moist adiabatic lapse rate (MALR) is the rate at which the
temperature of a parcel of moist air changes as it rises or sinks in the
atmosphere without exchanging heat with its surroundings. It is
slower than the DALR and varies between 4°C to 8°C per kilometer,
depending on the amount of moisture in the air parcel.
The MALR takes into account the condensation of water vapor as the
air parcel rises, which releases latent heat and slows the rate of
cooling. As the air parcel rises and cools, the relative humidity of the
air parcel increases until it reaches 100%. At this point, the air parcel
is said to be saturated, and further cooling leads to the formation of
clouds and precipitation.
Overall, the adiabatic lapse rate is an important concept in
atmospheric science that helps to explain the behavior of air parcels
in the atmosphere and the formation of weather patterns.
16. DRY ADIABATIC LAPSE RATE
(DALR):
The dry adiabatic lapse rate (DALR) is calculated using the following formula:
DALR = - g / Cp
Where:
g is the acceleration due to gravity (9.8 m/s² or 32.2 ft/s²)
Cp is the specific heat capacity of dry air at constant pressure (1005 J/(kg.K) or
0.24 Btu/(lb.°F))
This equation tells us that the rate of temperature change of a parcel of dry air
as it rises in the atmosphere without exchanging heat with the surroundings is
directly proportional to the acceleration due to gravity and inversely
proportional to the specific heat capacity of dry air at constant pressure.
The typical value of DALR is around 9.8°C per kilometer (or 5.4°F per 1000 feet).
17. MOIST ADIABATIC LAPSE RATE
(MALR):
The moist adiabatic lapse rate (MALR) takes into account the condensation of water
vapor as the air parcel rises and cools. The MALR is a function of the specific heat
capacity of moist air and the latent heat of condensation. The formula for MALR is
given as:
MALR = ((Cp x (1 + 0.61q)) / (0.61qL + Cp))
Where:
Cp is the specific heat capacity of dry air at constant pressure (1005 J/(kg.K) or
0.24 Btu/(lb.°F))
q is the specific humidity of the air parcel (the mass of water vapor per unit mass of
dry air)
L is the latent heat of condensation of water vapor (2.5 x 10^6 J/kg or 540 cal/g)
The specific humidity q is expressed as a dimensionless ratio of the mass of water
vapor to the mass of dry air. The latent heat of condensation L represents the
amount of heat released when water vapor condenses into liquid water.
The typical value of MALR is around 6°C per kilometer (or 3.3°F per 1000 feet), but
it can vary depending on the amount of moisture in the air parcel.
These equations are important in atmospheric science and are used to calculate the
18. CLAUSIUS-CLAPEYRON EQUATION
he Clausius-Clapeyron equation is an important equation in
thermodynamics that describes the relationship between the vapor
pressure of a liquid and its temperature. It is named after the German
physicist Rudolf Clausius and the French engineer Benoît Paul Émile
Clapeyron, who independently derived the equation in the mid-19th
century.
The Clausius-Clapeyron equation is derived by considering the phase
transition between a liquid and its vapor. At equilibrium, the rate of
evaporation of the liquid is equal to the rate of condensation of the
vapor, and the vapor pressure of the liquid is constant. The Clausius-
Clapeyron equation relates the change in vapor pressure with
temperature for a given phase transition.
19. The equation is expressed as:
dP/dT = ΔH_vap / TΔV
where dP/dT is the rate of change of vapor pressure with temperature, ΔH
vap is the enthalpy of vaporization, T is the absolute temperature, and ΔV is
the difference in molar volume between the liquid and the vapor.
The Clausius-Clapeyron equation applies to any phase transition that
involves a change in the number of particles in the system, such as the
melting of a solid or the sublimation of a solid directly to a gas. For
example, in the case of water, the equation can be used to describe the
relationship between the vapor pressure of water and its temperature, and is
the basis for understanding phenomena such as cloud formation and
precipitation in meteorology.
The Clausius-Clapeyron equation is a useful tool for understanding the
behavior of fluids and phase transitions in many areas of science, including
thermodynamics, chemistry, and meteorology. It can be used to predict the
behavior of fluids under different conditions, and to estimate parameters
such as the enthalpy of vaporization or the boiling point of a substance.
20. The Clausius-Clapeyron equation can be derived from the Gibbs-
Helmholtz equation, which relates the change in the Gibbs free
energy of a system to the change in temperature and pressure. The
Gibbs free energy is given by:
G = H - TS
where G is the Gibbs free energy, H is the enthalpy, T is the
temperature, and S is the entropy.
For a system at constant pressure, the Gibbs-Helmholtz equation can
be written as:
dG/dT = -S
This equation relates the change in Gibbs free energy to the change
in temperature, and can be used to derive the Clausius-Clapeyron
equation.
21. Consider a system consisting of a liquid and its vapor in equilibrium.
At equilibrium, the chemical potentials of the liquid and the vapor are
equal. The chemical potential of the vapor is given by:
μ_vapor = G_vapor / n
where μ_vapor is the chemical potential of the vapor, G_vapor is the
Gibbs free energy of the vapor, and n is the number of moles of the
vapor.
Similarly, the chemical potential of the liquid is given by:
μ_liquid = G_liquid / n
where μ_liquid is the chemical potential of the liquid, and G_liquid is
the Gibbs free energy of the liquid.
At equilibrium, the chemical potentials of the liquid and the vapor are
equal:
μ_vapor = μ_liquid
22. Substituting the expressions for the Gibbs free energy of the liquid and the
vapor, we get:
G_vapor / n = G_liquid / n
or
G_vapor - G_liquid = 0
Now, consider the phase transition between the liquid and the vapor. At a
given temperature and pressure, the Gibbs free energy of the liquid and the
vapor are equal. Therefore, we can write:
G_vapor = G_liquid + ΔG
where ΔG is the change in Gibbs free energy during the phase transition.
Substituting this expression into the previous equation, we get:
ΔG = 0
This means that the change in Gibbs free energy during the phase transition is
zero, and the temperature and pressure of the system are constant. Therefore,
the only change that can occur is a change in the number of moles of the
substance, as some of the liquid evaporates into vapor.
23. The change in Gibbs free energy can be written as:
ΔG = ΔH - TΔS
where ΔH is the enthalpy of vaporization, and ΔS is the change in entropy during the phase
transition.
For a small change in the number of moles, we can write:
dG = ΔG = ΔH - TΔS
Substituting this expression into the Gibbs-Helmholtz equation, we get:
dG/dT = -S = -ΔH/T^2 + ΔS/T
Solving for dP/dT, we get:
dP/dT = ΔH_vap / TΔV
where ΔH_vap is the enthalpy of vaporization, and ΔV is the difference in molar volume
between the liquid and the vapor.
This is the Clausius-Clapeyron equation, which relates the change in vapor pressure with
temperature for a given phase transition.
24. …IN METEOROLOGY
In meteorology, the Clausius-Clapeyron equation is used to relate the
saturation vapor pressure of water to temperature. This relationship
is important for understanding the behavior of water vapor in the
atmosphere, and for predicting the formation of clouds and
precipitation.
The Clausius-Clapeyron equation can be derived using the
thermodynamic properties of water and the assumptions of an ideal
gas.
Consider a parcel of moist air in the atmosphere that is in equilibrium
with a surface of water. At equilibrium, the air is saturated with water
vapor, meaning that the air contains the maximum amount of water
vapor it can hold at that temperature and pressure. The saturation
vapor pressure, es, is the pressure exerted by water vapor when the
air is saturated.
25. The Clausius-Clapeyron equation relates the saturation vapor
pressure of water to temperature, and can be derived as follows:
First, assume that the water vapor behaves as an ideal gas. The vapor
pressure of a gas is given by the ideal gas law:
P = nRT/V
where P is the pressure, n is the number of moles of gas, R is the gas
constant, T is the temperature, and V is the volume of the gas.
Next, assume that the parcel of moist air is a closed system, so that
the number of moles of water vapor in the air remains constant. This
means that the change in vapor pressure with temperature is equal to
the change in temperature divided by the change in volume.
26. Taking the derivative of the ideal gas law with respect to temperature,
we get:
dP/dT = nR/V
Substituting the expression for the volume of an ideal gas (V =
nRT/P), we get:
dP/dT = P/R(T^2)
This expression relates the change in vapor pressure with
temperature for an ideal gas.
However, water vapor is not a perfect ideal gas, and there are
deviations from the ideal gas law at high pressures and low
temperatures. These deviations are accounted for by introducing the
concept of the enthalpy of vaporization.
The enthalpy of vaporization, ΔH, is the amount of energy required to
vaporize a unit mass of liquid at a constant temperature and
pressure. For water at standard temperature and pressure, the
enthalpy of vaporization is approximately 40.7 kJ/mol.
27. The Clausius-Clapeyron equation can be derived by considering the
change in enthalpy during a phase transition. At a given temperature
and pressure, the enthalpy of the liquid and vapor are equal. The
enthalpy of the liquid, hL, is given by the specific heat of the liquid,
cL, multiplied by the temperature, T:
hL = cL T
The enthalpy of the vapor, hV, is given by the sum of the enthalpy of
the liquid and the enthalpy of vaporization:
hV = hL + ΔH
At equilibrium, the saturation vapor pressure, es, is the pressure at
which the enthalpy of the vapor is equal to the enthalpy of the liquid:
hV = hL
28. Substituting the expressions for the enthalpies of the liquid and
vapor, we get:
cL T + ΔH = cV T
where cV is the specific heat of the vapor.
Solving for es, we get:
es = exp((ΔH/R)(1/T2 - 1/T1))
where T1 and T2 are two temperatures, and R is the gas constant.
This is the Clausius-Clapeyron equation for water vapor in
meteorology, which relates the saturation vapor pressure of water to
temperature.
30. The second law of thermodynamics is a fundamental law of nature
that governs the behavior of energy and matter in the universe. It
states that in any process, the total entropy of a closed system always
increases over time or remains constant, but it can never decrease.
The concept of entropy is closely related to the degree of disorder or
randomness in a system.
The second law can be expressed in different ways, but the most
common statement is:
"Entropy of a closed system always increases over time or remains
constant, but it can never decrease."
This law implies that energy will always tend to flow from hotter to
colder objects, and that systems will tend to become more disordered
over time. It also implies that some energy will always be lost as
waste heat when work is performed, and that the efficiency of any
process cannot be 100%.
31. The second law has several important implications:
Heat cannot flow from a cold object to a hot object spontaneously.
Heat will always flow from a hotter object to a colder object, and work
must be performed to move heat from a colder object to a hotter
object.
The efficiency of any heat engine is always less than 100%. This is
because some energy is always lost as waste heat, which increases
the entropy of the system.
Entropy is a measure of the degree of disorder or randomness in a
system. Any process that results in an increase in entropy is
irreversible, meaning that it cannot be reversed without the input of
external energy.
The second law implies that there are limits to the amount of useful
energy that can be extracted from any energy source. This is known
as the Carnot limit, which states that the maximum efficiency of any
heat engine is limited by the temperature difference between the hot
and cold reservoirs.
32. The second law of thermodynamics has important implications for
weather systems as well. It implies that any process that increases the
entropy of the system is irreversible, meaning that it cannot be
reversed without the input of external energy. In weather systems,
this means that any process that increases the entropy of the
atmosphere, such as mixing of air masses, will tend to be
irreversible.
The second law also implies that there are limits to the efficiency of
energy conversion in weather systems. For example, the efficiency of
a heat engine, such as a thunderstorm, is limited by the temperature
difference between the hot and cold reservoirs. In a thunderstorm,
warm and moist air rises, cools and condenses, releasing latent heat
and producing thunder, lightning, and rain. However, the efficiency of
this energy conversion process is limited by the temperature
difference between the warm air at the surface and the cooler air at
higher altitudes.
The second law also has implications for the adiabatic lapse rate,
which is the rate at which the temperature of a parcel of air changes
as it rises or sinks in the atmosphere. The dry adiabatic lapse rate
33. The dry adiabatic lapse rate assumes that no heat is
exchanged between the parcel of air and its
surroundings, while the moist adiabatic lapse rate
accounts for the condensation of water vapor as the
air parcel rises and cools. Both of these processes
result in an increase in the entropy of the atmosphere.
In summary, the second law of thermodynamics has
important implications for weather systems, including
the irreversibility of processes that increase the
entropy of the atmosphere, the limits to the efficiency
of energy conversion in weather systems, and the
adiabatic lapse rate of rising or sinking air parcels.
34. ENTROPY:
Entropy is a thermodynamic property that measures the degree of disorder
or randomness in a system. In meteorology, entropy is used to describe the
state of the atmosphere and the behavior of weather systems.
As air parcels move through the atmosphere, they exchange heat and
moisture with their surroundings, which can lead to changes in their
temperature, pressure, and density. These changes in the state of the air
parcel can be quantified using the concept of entropy.
In meteorology, the entropy of the atmosphere is often expressed in terms of
the potential temperature, which is the temperature that an air parcel would
have if it were brought adiabatically (i.e., without exchanging heat with its
surroundings) to a reference pressure level. The potential temperature is a
measure of the entropy of the air parcel, and it is conserved during adiabatic
processes.
35. For example, when an air parcel rises in the atmosphere, it expands and
cools adiabatically, which increases its entropy. The potential temperature
of the air parcel also decreases, which means that it becomes less dense
than its surroundings and continues to rise. Similarly, when an air parcel
sinks in the atmosphere, it compresses and warms adiabatically, which
decreases its entropy and increases its potential temperature. The air
parcel becomes more dense than its surroundings and continues to sink.
Entropy is also used to describe the behavior of weather systems, such as
thunderstorms and hurricanes. These systems are characterized by the
exchange of heat and moisture between the atmosphere and the Earth's
surface, which can lead to the development of strong convective motions
and the generation of vorticity. The degree of disorder and randomness in
the atmosphere, as measured by its entropy, plays a key role in the
development and evolution of these systems.
In summary, entropy is an important concept in meteorology that
describes the degree of disorder and randomness in the atmosphere and
the behavior of weather systems. It is often expressed in terms of the
potential temperature, which is a measure of the entropy of an air parcel
36. IMPORTANT EQUATIONS:
During an adiabatic process, the change in entropy of an
air parcel is given by the following equation:
ΔS = -Cp ln (P2/P1) + R ln (T2/T1)
Where Cp is the specific heat at constant pressure, R is the
gas constant, P1 and T1 are the initial pressure and
temperature of the air parcel, and P2 and T2 are the final
pressure and temperature of the air parcel. This equation
relates the change in entropy to the change in pressure and
temperature during the adiabatic process.
37. The potential temperature (θ) of an air parcel is
given by the following equation:
θ = T (P0/P)^(R/Cp)
Where T is the temperature of the air parcel, P0 is a
reference pressure level (usually 1000 hPa), P is the
pressure of the air parcel, R is the gas constant, and
Cp is the specific heat at constant pressure. This
equation relates the potential temperature to the
temperature and pressure of the air parcel.
38. The rate of entropy production (σ) in the atmosphere
is given by the following equation:
σ = -∫(Q/T)Dv
Where Q is the heat flux, T is the temperature, and dV
is the volume element. This equation relates the rate
of entropy production to the rate of heat exchange
and temperature gradients in the atmosphere.
These equations are used to describe the
thermodynamic behavior of the atmosphere and the
entropy of air parcels and weather systems.
39. IDEAL GAS LAW:
The Ideal Gas Law, also known as the General Gas Equation, is represented by
the formula
PV = nRT
where P is pressure, V is volume, n is the number of moles of gas, R is the
universal gas constant, and T is temperature in Kelvin. This law is a
fundamental principle of thermodynamics and is used to describe the behavior
of ideal gases.
The Ideal Gas Law is derived from a combination of several empirical laws such
as Boyle's law, Charles's law, and Avogadro's law. These laws describe the
relationship between the pressure, volume, and temperature of a gas, as well
as the number of gas molecules in a given volume.
Boyle's law states that, at a constant temperature, the volume of a gas is
inversely proportional to its pressure. Charles's law states that, at a constant
pressure, the volume of a gas is directly proportional to its temperature.
40. The Ideal Gas Law combines these laws into a single equation that relates the
pressure, volume, temperature, and number of molecules in an ideal gas. The
law assumes that the gas molecules are point particles that are in constant
random motion, with no intermolecular forces acting between them.
The Universal Gas Constant, R, is a proportionality constant that depends on
the units used for pressure, volume, temperature, and the number of
molecules. It is given by the following equation:
R = kN_A
where k is the Boltzmann constant and N_A is the Avogadro constant. The
value of R is approximately 8.31 J/mol·K.
The Ideal Gas Law is used in many fields of science and engineering,
including chemistry, physics, and meteorology. In meteorology, it is used to
describe the behavior of gases in the atmosphere, particularly in relation to
weather systems and air masses. The law is also used to calculate the density
and mass of air, which are important parameters for understanding
atmospheric dynamics and weather forecasting.
41. SPECIFIC HEAT
Specific heat is a thermodynamic property that relates the heat energy
transferred to a material to the resulting change in temperature. Specifically, it
is the amount of heat energy required to raise the temperature of one unit of
mass of a substance by one degree Celsius (or Kelvin).
In meteorology, specific heat is an important property of the atmosphere as it
determines how much energy is required to raise the temperature of air in the
atmosphere. The specific heat of air varies with temperature and pressure, but
for dry air at constant pressure, it is approximately 1005 J/(kg·K). This means
that to raise the temperature of one kilogram of dry air by one degree Celsius,
1005 joules of energy are required.
The specific heat of moist air is slightly lower than that of dry air, as some of
the energy is used to evaporate water from the air. The specific heat of water
vapor is also different from that of dry air, so the specific heat of moist air
depends on the temperature, pressure, and amount of water vapor in the air.
42. Specific heat plays an important role in atmospheric processes such
as convection, advection, and radiation. For example, during
convection, warm air rises and cooler air sinks, resulting in the
transfer of heat from the surface of the Earth to the atmosphere. The
specific heat of air determines how much energy is required to raise
the temperature of the air, and therefore how quickly the air will heat
up or cool down.
The specific heat of air also plays a role in radiation processes in the
atmosphere. When the sun's radiation enters the Earth's atmosphere,
it is absorbed by the air and the surface of the Earth. The specific
heat of air determines how much of this energy is stored in the air
and how much is transferred to the surface of the Earth. This has
important implications for weather and climate as it affects the
amount of energy available to drive atmospheric processes such as
wind and precipitation.
In summary, specific heat is an important thermodynamic property of
the atmosphere that affects the temperature, pressure, and energy
transfer in the atmosphere. It is a key parameter in meteorology as it
43. The specific heat of a substance can be calculated from the heat
capacity, which is the amount of heat energy required to raise the
temperature of a substance by a given amount. The heat capacity is
defined as:
C = Q / ΔT
where C is the heat capacity, Q is the amount of heat energy
transferred, and ΔT is the resulting change in temperature.
In meteorology, the specific heat of air is an important property that
depends on the temperature and pressure of the air. The specific heat
of dry air at constant pressure (cp) can be derived from the first law
of thermodynamics:
ΔU = Q - W
where ΔU is the change in internal energy, Q is the heat energy
transferred, and W is the work done by the system.
44. For a gas, the internal energy is a function of temperature only, and is
given by:
ΔU = Cv ΔT
where Cv is the molar specific heat at constant volume, and ΔT is the
change in temperature.
For a constant pressure process, the work done is given by:
W = PΔV
where P is the pressure, and ΔV is the change in volume.
Substituting these expressions into the first law of thermodynamics, we
get:
Cp ΔT = Cv ΔT + P ΔV
Dividing both sides by ΔT and rearranging, we get:
Cp = Cv + PΔV / ΔT
45. Using the ideal gas law, PV = nRT, where P is pressure, V is volume, n is the number of
moles of gas, R is the universal gas constant, and T is temperature in Kelvin, we can
write:
ΔV = (nR / P) ΔT
Substituting this expression into the equation for Cp, we get:
Cp = Cv + nR
where n is the number of moles of gas.
For dry air, the molar specific heat at constant volume (Cv) is approximately 20.8
J/(mol·K), and the universal gas constant (R) is 8.31 J/(mol·K). Therefore, the molar
specific heat at constant pressure (Cp) for dry air is approximately 29.1 J/(mol·K).
The specific heat of moist air depends on the temperature, pressure, and amount of
water vapor in the air. The specific heat of water vapor is different from that of dry air,
so the specific heat of moist air is a weighted average of the specific heats of dry air
and water vapor. The specific heat of moist air can be calculated using the
psychrometric chart or by numerical methods.
In summary, the specific heat of dry air at constant pressure can be derived from the
first law of thermodynamics and the ideal gas law, and depends on the molar specific
heat at constant volume and the universal gas constant. The specific heat of moist air is
a weighted average of the specific heats of dry air and water vapor, and depends on the
temperature, pressure, and amount of water vapor in the air.
46. DALTON PRINCIPLE
The Dalton principle, also known as Dalton's law of partial pressures, states
that in a mixture of gases, each gas exerts a pressure that is independent
of the presence of other gases in the mixture. This means that the total
pressure of the mixture is the sum of the partial pressures of each gas in
the mixture.
For example, consider a container with a mixture of gases A, B, and C.
According to Dalton's principle, the pressure exerted by each gas is
proportional to its concentration or mole fraction in the mixture. The mole
fraction is the ratio of the number of moles of a particular gas to the total
number of moles in the mixture.
Let's assume that the total pressure of the mixture is P and the mole
fraction of gas A, gas B, and gas C are xA, xB, and xC respectively. Then the
partial pressure of each gas can be calculated as follows:
Partial pressure of gas A = xA * P
Partial pressure of gas B = xB * P
Partial pressure of gas C = xC * P
47. The total pressure of the mixture is the sum of the partial pressures of each
gas:
P = P_A + P_B + P_C
P = xA * P + xB * P + xC * P
The Dalton principle is based on the kinetic theory of gases, which assumes
that gases are made up of a large number of small particles (atoms or
molecules) that move randomly in all directions. The pressure of a gas is the
result of the collisions of these particles with the walls of the container. The
principle is named after the British chemist and physicist John Dalton, who
first described it in the early 19th century. The principle is widely used in
many areas of science and engineering, including atmospheric science and
gas chromatography.
48. VIRTUAL TEMPERATURE
In meteorology, the virtual temperature is a temperature value that
takes into account the effect of water vapor on the density of air. It is
defined as the temperature that a parcel of dry air would have if it had
the same density as a parcel of moist air at the same pressure and
volume.
The virtual temperature (Tv) is related to the actual temperature (T) and
the mixing ratio (r) of water vapor in the air by the following equation:
Tv = T (1 + 0.61 r)
where the mixing ratio is the mass of water vapor per unit mass of dry
air.
The 0.61 constant in the equation represents the ratio of the specific
gas constant for water vapor to that for dry air (Rv/Rd). The virtual
temperature is always greater than the actual temperature, because the
presence of water vapor reduces the density of the air, making it easier
for the air to expand and increasing its temperature.
49. The virtual temperature is important in meteorology
because it is a better indicator of the potential energy
available in the atmosphere for convective processes,
such as thunderstorm development. This is because
convective processes are driven by differences in
potential energy, which are related to the difference in
temperature between the surface and the upper
atmosphere. Because the virtual temperature takes
into account the effect of water vapor on the density
of the air, it provides a more accurate estimate of the
potential energy available in the atmosphere for
convective processes.
50. The concept of virtual temperature arises from the fact that the presence of
water vapor in the air affects its density. The density of a gas is proportional to
its pressure and inversely proportional to its temperature, according to the
ideal gas law:
p = ρRT
where p is the pressure, ρ is the density, R is the gas constant, and T is the
temperature.
For a mixture of dry air and water vapor, the pressure is the sum of the partial
pressures of the two gases:
p = pd + pv
where pd is the partial pressure of dry air and pv is the partial pressure of
water vapor.
The density of the mixture can be expressed as:
ρ = (pd + pv) / RT
If we assume that the volume occupied by the mixture is constant, we can
51. ρ = (pd + pv) / RTv
Tv = (pd + pv) / ρR
Substituting pv = rρp, where r is the mixing ratio of water vapor (mass of water
vapor per unit mass of dry air) and p is the total pressure of the mixture, we
get:
Tv = T (1 + 0.61 r)
where T is the actual temperature of the mixture.
The constant 0.61 arises from the fact that the specific gas constant for water
vapor (Rv) is different from that for dry air (Rd), and is given by:
Rv / Rd = 0.622
where 0.622 is the ratio of the molecular weight of water vapor to that of dry
air.
The equation for virtual temperature shows that it is always greater than the
actual temperature, because the presence of water vapor reduces the density of
the air, making it easier for the air to expand and increasing its temperature.
The virtual temperature is important in meteorology because it provides a
more accurate estimate of the potential energy available in the atmosphere for
52. POTENTIAL TEMPERATURE AND
METEOROLOGY
Potential temperature is an essential concept in meteorology used to
describe the temperature of a parcel of air if it were raised or lowered
to a certain pressure level without exchanging heat with the
surrounding atmosphere.
Potential temperature is defined as the temperature a parcel of dry air
would have if it was expanded or compressed adiabatically (without
exchanging heat with its surroundings) from its current pressure and
temperature to a reference pressure level, usually at 1000 hPa.
The potential temperature of a parcel of air remains constant if the
parcel is lifted or lowered adiabatically in the atmosphere. This is a
useful concept for meteorologists because it allows them to track the
movement of air masses and analyze their properties.
53. One of the most significant advantages of using potential
temperature is that it removes the effect of pressure changes on
temperature. This is because when a parcel of air is raised or lowered
adiabatically, its pressure changes, but its potential temperature does
not. Therefore, potential temperature is a more useful parameter to
analyze and compare air masses at different altitudes and locations.
Potential temperature is commonly used in weather forecasting,
especially in identifying the location and strength of fronts, the
development of severe weather events, and the advection of air
masses. It is also used in the analysis of atmospheric stability, which
is essential in predicting the development of thunderstorms and
other severe weather events.
In summary, potential temperature is a critical concept in
meteorology, providing a useful way to analyze the properties of air
masses and track their movement in the atmosphere. Its ability to
remove the effects of pressure changes on temperature makes it a
valuable parameter for weather forecasting and analysis.
54. The potential temperature (theta) is a thermodynamic variable that is
useful in meteorology for tracking air parcels that move vertically in
the atmosphere. It is defined as the temperature a parcel of air would
have if it were moved adiabatically (without exchanging heat with the
environment) to a reference pressure level, usually 1000 hPa.
The potential temperature can be derived using the first law of
thermodynamics, which states that the change in internal energy of a
system is equal to the heat added to the system minus the work done
by the system:
dU = dQ - dW
where dU is the change in internal energy, dQ is the heat added to
the system, and dW is the work done by the system. For an adiabatic
process, dQ = 0, so the equation simplifies to:
dU = -dW
55. For a parcel of air that is moving adiabatically in the atmosphere, the
work done is the work required to change the volume of the parcel as
it moves up or down. This work is given by:
dW = -pdV
where p is the pressure and dV is the change in volume. Using the
ideal gas law, we can write:
dV/V = -dP/P
where V is the volume, P is the pressure, and dP is the change in
pressure. Substituting this expression into the equation for dW, we
get:
dW = pdV = -pdP/P
56. Substituting this expression into the equation for dU, we get:
dU = -dW = pdP/P
For a reversible adiabatic process, we can write:
P^(1-gamma)T^gamma = constant
where gamma is the ratio of the specific heats of the gas at constant pressure
and constant volume, and the constant is the adiabatic invariant. Taking the
logarithm of both sides and differentiating with respect to pressure, we get:
d ln(T) = (gamma-1)d ln(P)
Substituting this expression into the equation for dU, we get:
dU = pdP/P = -pd ln(P) = Cp d ln(T)
where Cp is the specific heat of the gas at constant pressure. Integrating this
equation from the initial temperature and pressure (T1, P1) to the reference
pressure level (P0), we get:
Cp ln(T0/T1) = -R ln(P0/P1)
where R is the gas constant.
57. Solving for T0, the potential temperature, we get:
T0 = T1 (P0/P1)^(R/Cp)
This is the equation for the potential temperature. It relates the
temperature of an air parcel at one pressure level to its temperature
at a different pressure level, assuming that the parcel moves
adiabatically between the two levels. The potential temperature is a
useful variable in meteorology because it allows us to compare the
properties of air parcels that have different pressures and
temperatures.
58. EQUIVALENT TEMPERATURE AND
EQUIVALENT POTENTIAL
TEMPERATURE
Equivalent Temperature and Equivalent Potential Temperature are
important concepts in Atmospheric Dynamics that help to understand the
thermodynamic state of the atmosphere.
Equivalent Temperature: Equivalent Temperature is the temperature that
dry air would have if it contained the same amount of water vapor as the
actual moist air. It is a measure of the combined effect of temperature
and humidity, and is often used as an indicator of how "comfortable" the
air feels. Equivalent Temperature can be calculated using the following
equation:
Equivalent Temperature = T + (L / Cp) * q
where T is the actual air temperature, L is the latent heat of vaporization,
Cp is the specific heat of air at constant pressure, and q is the specific
humidity (mass of water vapor per unit mass of dry air).
59. Equivalent Potential Temperature: Equivalent Potential Temperature is the
temperature that a parcel of air would have if it was brought to a reference
pressure level (usually 1000 mb) by adiabatic processes. It is a measure of the
amount of energy that a parcel of air would have if it were lifted to the
reference pressure level, and is often used as an indicator of the stability of
the atmosphere. Equivalent Potential Temperature can be calculated using the
following equation:
Equivalent Potential Temperature = T * (P_0 / P)^(R_d / C_p) * exp((L / C_p) *
q)
where T is the temperature of the air parcel, P_0 is the reference pressure
level (usually 1000 mb), P is the pressure of the air parcel, R_d is the gas
constant for dry air, C_p is the specific heat of air at constant pressure, L is
the latent heat of vaporization, and q is the specific humidity.
Both Equivalent Temperature and Equivalent Potential Temperature are useful
in atmospheric science and meteorology for understanding the behavior of air
parcels, the formation of clouds, and the development of weather systems.
60. HUMIDITY, ABSOLUTE AND
RELATIVE HUMIDITY
Humidity is the amount of water vapor present in the air. It is an important
factor in weather and climate, and affects the comfort and health of living
organisms. Humidity can be expressed in several ways, including absolute
humidity and relative humidity.
Absolute humidity is the mass of water vapor per unit volume of air. It is
typically expressed in grams per cubic meter (g/m3) or kilograms per cubic
meter (kg/m3). Absolute humidity is a measure of the actual amount of water
vapor in the air, and can be directly measured using a hygrometer.
Relative humidity (RH) is the ratio of the amount of water vapor in the air to the
amount of water vapor that the air can hold at a given temperature and
pressure. It is expressed as a percentage. Relative humidity indicates how close
the air is to saturation, or the point at which the air can no longer hold any
more water vapor. Warm air can hold more water vapor than cool air, so relative
humidity can change even if the absolute humidity remains the same.
61. The relationship between absolute humidity and relative humidity can
be expressed using the concept of saturation vapor pressure.
Saturation vapor pressure is the pressure exerted by water vapor
when it is in equilibrium with a flat surface of pure liquid water at a
given temperature. As the temperature increases, the saturation
vapor pressure also increases. When the actual vapor pressure (the
pressure exerted by the water vapor in the air) is equal to the
saturation vapor pressure, the air is said to be saturated and the
relative humidity is 100%. If the actual vapor pressure is less than the
saturation vapor pressure, the relative humidity is less than 100%.
Relative humidity is an important parameter in weather forecasting
and in human comfort. High relative humidity can make the air feel
hotter and more uncomfortable, while low relative humidity can lead
to dry skin and respiratory problems. It is also an important factor in
many industrial processes, including drying, cooling, and storage of
materials.
62. WET BULB AND DRY BULB
CONCEPT:
The wet-bulb and dry-bulb temperatures are two important measures
of temperature in meteorology. They are used to calculate relative
humidity and other atmospheric properties.
The dry-bulb temperature is the ambient temperature of the air,
measured with a thermometer that is not covered by a wet wick. It is
the most common measure of air temperature, and is used in weather
forecasts and climate data.
The wet-bulb temperature is the temperature that is measured by
wrapping a wet wick around a thermometer and exposing it to the air.
The wet wick is saturated with water and exposed to air flow, which
causes evaporation and cools the thermometer. The wet-bulb
temperature is a measure of the cooling effect of evaporation, and is
typically lower than the dry-bulb temperature. The difference between
the wet-bulb and dry-bulb temperatures is a measure of the moisture
content of the air.
63. The wet-bulb temperature is used to calculate relative humidity, which
is a measure of the amount of water vapor present in the air compared
to the maximum amount of water vapor that the air can hold at a
given temperature. The relative humidity is calculated by comparing
the wet-bulb temperature to the dry-bulb temperature using a
psychrometric chart or equations derived from thermodynamics.
In meteorology, the wet-bulb and dry-bulb temperatures are used to
calculate other important atmospheric properties, such as dew point
temperature, specific humidity, and enthalpy. These properties are
used to understand the behavior of the atmosphere and to make
weather forecasts.
The wet-bulb temperature is also used in heat stress and comfort
indexes, which take into account both the temperature and humidity
of the air to determine the perceived temperature or heat index. This
is important in human comfort and safety, as high temperatures
combined with high humidity can lead to heat exhaustion or heat
stroke.
64. HUMIDITY VS DEW POINT
EXPLANATION
Humidity and dew point are two important measures of atmospheric
moisture content. While humidity is a measure of the amount of water
vapor present in the air, dew point is the temperature at which water
vapor begins to condense into dew.
Relative humidity (RH) is a measure of the amount of water vapor
present in the air compared to the amount of water vapor that the air
can hold at a given temperature and pressure. It is expressed as a
percentage. The formula for relative humidity is:
RH = (e / es) x 100%
where e is the vapor pressure of the air, and es is the saturation
vapor pressure at the same temperature.
65. Dew point, on the other hand, is the temperature at which the air
becomes saturated with water vapor and dew begins to form. It is a
measure of the actual amount of water vapor in the air. The dew point
temperature is calculated using the following formula:
Td = (b x γ) / (a - γ)
where Td is the dew point temperature, a is the constant for the
saturation vapor pressure curve, b is the constant for the Clausius-
Clapeyron equation, and γ is the ratio of the mass of water vapor to
the mass of dry air in a given volume.
The dew point temperature can also be estimated using the following
formula, which is based on the relationship between temperature and
relative humidity:
Td = T - ((100 - RH) / 5)
where T is the dry-bulb temperature in degrees Celsius.
66. While relative humidity is a measure of the
amount of water vapor in the air compared to
the maximum amount of water vapor that the
air can hold at a given temperature, the dew
point temperature is a measure of the actual
amount of water vapor in the air. As the
temperature drops and the air becomes more
saturated with water vapor, the dew point
temperature also drops. When the dew point
temperature and the dry-bulb temperature are
the same, the air is fully saturated and the
relative humidity is 100%.
67. 0 5000 10000 15000 20000 25000 30000 35000 40000
0
10
20
30
40
50
60
70
80
90
100
-100
-80
-60
-40
-20
0
20
40
0 5000 10000 15000 20000 25000 30000 35000 40000
RELATIVE
HUMIDITY
TEMPERATURE
AND
DEWPOINT
HEIGHT (M)
MADRA STATION; MAY 28, 2020
TEMP (DEGREE CELCIUS) DEWPOINT RELATIVE HUMIDITY (%)
TEMPERAURE VS HUMIDITY VS DEWPOINT WTH TO HEIGHT; RADIOSONDE DATA
68. THERMODYNAMIC DIAGRAM: T -
GRAM
The T-gram, also known as the thermodynamic or temperature-humidity
diagram, is a graphical representation of the thermodynamic properties of
moist air. It is widely used in meteorology to analyze atmospheric processes,
including cloud formation, precipitation, and atmospheric stability.
The T-gram is a two-dimensional plot of temperature (T) and specific humidity
(q), with lines of constant values for various atmospheric properties. The
diagram is constructed using the ideal gas law, which relates the pressure,
temperature, and density of a gas.
The T-gram is constructed by plotting the temperature and specific humidity at
a given pressure level. The specific humidity is the mass of water vapor per
unit mass of air, expressed as a fraction or percentage.
Lines of constant temperature, known as isotherms, are plotted on the diagram
as horizontal lines. Lines of constant specific humidity, known as isohumes or
mixing ratio lines, are plotted as diagonal lines that slope upwards to the right.
69. The T-gram also includes lines of constant
saturation mixing ratio, known as
isodrosotherms or saturation vapor pressure
lines. These lines represent the maximum
amount of water vapor that the air can hold
at a given temperature, and are curved lines
that slope upwards to the right.
***||***
Isodrosotherms (meaning):
a line on a weather map or chart connecting
points having an equal dew point.
70. The T-gram can be used to determine various atmospheric properties,
including:
1. Dew point temperature: the temperature at which the air becomes
saturated with water vapor, leading to the formation of dew or frost.
2. Wet-bulb temperature: the temperature at which a thermometer covered
in a wet cloth reaches equilibrium with the surrounding air, indicating the
maximum cooling effect that can be achieved by evaporation.
3. Lifting condensation level (LCL): the altitude at which a parcel of air
becomes saturated with water vapor as it is lifted, leading to the
formation of clouds.
4. Convective available potential energy (CAPE): the amount of energy
available for convection, which is a measure of atmospheric instability.
The T-gram is a powerful tool for meteorological analysis, and is widely used
in weather forecasting, atmospheric research, and aviation.
71. T-GRAM CONTINUED…
The thermodynamic diagram, also known as a T-gram, is a graphical
representation of the thermodynamic variables used in meteorology. It
is a type of coordinate system that is used to plot temperature,
pressure, and humidity data to analyze atmospheric stability,
convection, and other important atmospheric properties.
The T-gram is based on the dry adiabatic lapse rate, which is the rate
at which air cools as it rises in a dry atmosphere. The dry adiabatic
lapse rate is approximately 9.8 degrees Celsius per kilometer, or 5.5
degrees Fahrenheit per 1000 feet.
To plot temperature data on a T-gram, the dry adiabatic lapse rate is
used to calculate the temperature at different altitudes. For example,
if the surface temperature is 20 degrees Celsius and the air rises to an
altitude of 1 kilometer, the temperature at that altitude would be
approximately 10 degrees Celsius (assuming no moisture is added or
removed). This is plotted as a point on the T-gram with the
72. To plot pressure data on a T-gram, the logarithmic relationship
between pressure and altitude is used. The pressure axis on the T-
gram is typically labeled in millibars or hectopascals, and the altitude
axis is labeled in kilometers or feet.
Humidity data is plotted on the T-gram using specific humidity or
mixing ratio. Specific humidity is the mass of water vapor in a given
mass of air, expressed in grams per kilogram (g/kg), while mixing
ratio is the mass of water vapor in a given mass of dry air, expressed
in grams per kilogram (g/kg). These values are plotted on the T-gram
with the humidity axis labeled in g/kg.
Using the T-gram, meteorologists can analyze the stability of the
atmosphere, the likelihood of convection, the potential for
precipitation, and other important atmospheric properties. The T-
gram is also used to plot soundings, which are vertical profiles of
temperature, pressure, and humidity data collected by weather
balloons.
73. STABILITY AND INSTABILITY IN
ATMOSPHERIC DYNAMICS
Stability and instability are two important concepts in atmospheric
dynamics that describe the tendency of air parcels to either remain in
place or to move vertically in the atmosphere.
Stability refers to the tendency of an air parcel to remain in place or to
oscillate around its initial position when it is displaced vertically from
its equilibrium level. A stable atmosphere resists vertical motion,
which means that if an air parcel is lifted, it will be cooler and denser
than the surrounding air, and will therefore sink back down to its
original level. In a stable atmosphere, the environmental lapse rate is
less than the dry adiabatic lapse rate, which means that the
temperature decreases more slowly with height than it would if the air
were rising adiabatically. Stable conditions are often associated with
clear skies, light winds, and cool temperatures.
74. Instability, on the other hand, refers to the tendency of an air parcel to
accelerate vertically when it is displaced from its equilibrium level. An
unstable atmosphere promotes vertical motion, which means that if an
air parcel is lifted, it will be warmer and less dense than the
surrounding air, and will therefore continue to rise until it reaches an
altitude where it is in equilibrium with the surrounding air. In an
unstable atmosphere, the environmental lapse rate is greater than the
dry adiabatic lapse rate, which means that the temperature decreases
more rapidly with height than it would if the air were rising
adiabatically. Unstable conditions are often associated with cloudy
skies, strong winds, and warm temperatures.
The stability of the atmosphere is influenced by several factors,
including temperature, moisture content, and pressure. For example,
if the air near the surface is warm and moist, and the air aloft is cool
and dry, the atmosphere may be unstable because the warm and
moist air will be less dense than the cool and dry air, and will
therefore rise rapidly. On the other hand, if the air near the surface is
cool and dry, and the air aloft is warm and moist, the atmosphere may
be stable because the cool and dry air will be denser than the warm
75. In meteorology, stability and instability are
important concepts that are used to understand
and predict weather patterns, including the
development of thunderstorms, hurricanes, and
other severe weather events. By analyzing the
stability of the atmosphere, meteorologists can
predict the likelihood of convection,
precipitation, and other atmospheric
phenomena, and can issue warnings and
advisories to help protect the public from the
potential impacts of severe weather.
76. RATE OF PRECIPITATION IN
ATMOSPHERIC DYNAMICS
The rate of precipitation in atmospheric dynamics refers to the
amount of water that falls from the atmosphere to the ground in a
given period of time. Precipitation occurs when the air becomes
saturated with water vapor and the excess water condenses into
liquid or solid particles, which then fall to the ground due to gravity.
The rate of precipitation can be influenced by several factors,
including the temperature, moisture content, and stability of the
atmosphere. In general, warmer air can hold more moisture than
cooler air, which means that the rate of precipitation is often higher
in warmer climates. However, the stability of the atmosphere can also
play a role in the rate of precipitation, as unstable air masses can
promote rapid vertical motion and lead to more intense precipitation
events.
77. The rate of precipitation is typically measured in units of length per
unit time, such as inches per hour or millimeters per day. In
meteorology, the intensity of precipitation is often classified into
different categories based on its rate, such as light rain (less than 2.5
mm per hour), moderate rain (2.5 to 7.6 mm per hour), heavy rain
(7.6 to 50 mm per hour), and extreme rain (more than 50 mm per
hour).
Measuring the rate of precipitation is important for many
applications, including agriculture, hydrology, and weather
forecasting. Accurate precipitation measurements can help farmers to
determine when to plant and harvest crops, water resource managers
to manage water supplies, and meteorologists to predict and track
severe weather events such as floods, hurricanes, and tornadoes.
78. DERIVATION:
The rate of precipitation can be derived based on the behavior of air
parcels in the atmosphere. When an air parcel rises, it expands and
cools adiabatically, which can lead to the condensation of water vapor
and the formation of cloud droplets. As the cloud droplets grow and
become heavy enough, they will begin to fall due to gravity, forming
precipitation.
The rate of precipitation can be calculated using the following
equation:
P = A * V * ρw
where P is the rate of precipitation in units of mass per unit time, A is
the cross-sectional area of the precipitation system, V is the fall
velocity of the precipitation particles, and ρw is the density of the
water in the precipitation particles.
79. The cross-sectional area of the precipitation system can be calculated
based on the size and shape of the precipitation particles. For
example, if the precipitation particles are spherical, the cross-
sectional area can be calculated using the equation:
A = π * (d/2)^2
where d is the diameter of the precipitation particles.
The fall velocity of the precipitation particles depends on their size,
shape, and density, as well as the atmospheric conditions such as
temperature, humidity, and wind. The fall velocity can be estimated
using empirical relationships based on laboratory measurements or
observations of precipitation in the atmosphere.
The density of the water in the precipitation particles can be
calculated using the equation:
ρw = m/V
where m is the mass of the water in the precipitation particles and V
is the volume of the precipitation particles. The volume of the
80. ROLE OF CONVECTIVE AVAILABLE
POTENTIAL ENERGY (CAPE) AND
CONVECTIVE INHIBITION ENERGY
(CINE) IN THUNDERSTORM
DEVELOPMENT
Convective Available Potential Energy (CAPE) and Convective Inhibition
Energy (CINE) are both important factors that influence thunderstorm
development.
CAPE is a measure of the amount of energy that is available to an air
parcel as it rises from the surface of the earth to a given level in the
atmosphere. It represents the amount of work that can be done by the air
parcel as it rises and expands, and is directly related to the strength of
updrafts in the atmosphere. High values of CAPE indicate that there is a
lot of energy available to support convection, which can lead to the
development of thunderstorms.
81. CINE, on the other hand, is a measure of the amount of energy that is
required to overcome a layer of stable air in the atmosphere that
inhibits convection. CINE is essentially the negative of the CAPE in a
layer of stable air, and represents the amount of energy that must be
removed from an air parcel in order to allow it to rise through the
stable layer and initiate convection. High values of CINE indicate that
it will be difficult for thunderstorms to develop, as the stable layer
will inhibit the upward movement of air parcels.
Both CAPE and CINE play important roles in thunderstorm
development. When CAPE is high and CINE is low, the atmosphere is
very unstable and there is a lot of energy available to support
convection. This can lead to the development of strong updrafts,
which can drive the formation of thunderstorms. However, if CINE is
high, the stable layer will inhibit convection, even if CAPE is high, and
thunderstorms may not develop.
In summary, CAPE and CINE are both important factors that
meteorologists use to assess the potential for thunderstorm
development. High values of CAPE and low values of CINE indicate a
high likelihood of thunderstorm development, while high values of
82. DERIVATIONS
The Convective Available Potential Energy (CAPE) and Convective
Inhibition Energy (CINE) are derived from thermodynamic profiles of
the atmosphere, typically obtained from weather balloons or
numerical weather models.
To derive CAPE, we first need to calculate the buoyancy of an air
parcel as it rises from the surface to a given level in the atmosphere.
This is done using the following equation:
$B = g frac{theta_v - theta_e}{theta_v}$
where $B$ is the buoyancy of the air parcel in J/kg, $g$ is the
acceleration due to gravity in m/s^2, $theta_v$ is the virtual
temperature of the air parcel in K, and $theta_e$ is the
environmental temperature in K at the same pressure level.
83. The virtual temperature $theta_v$ is defined as:
$theta_v = theta left(1 + frac{0.61q}{p}right)$
where $theta$ is the potential temperature of the air parcel in K, $q$ is the
specific humidity of the air parcel in kg/kg, and $p$ is the pressure of the
air parcel in Pa.
Next, we integrate the buoyancy of the air parcel from the surface to the
level of free convection (LFC) to obtain the CAPE:
$CAPE = int_{0}^{LFC} B dz$
where $z$ is the height above sea level in meters.
The Convective Inhibition Energy (CINE) is the amount of energy that is
required to overcome a layer of stable air in the atmosphere that inhibits
convection. CINE is essentially the negative of the CAPE in a layer of stable
air. It can be calculated as follows:
$CINE = -int_{LFC}^{EL} B dz$
where EL is the equilibrium level, the height at which the buoyancy of the air
84. In summary, the CAPE and CINE are derived by
calculating the buoyancy of an air parcel as it
rises from the surface to the level of free
convection and the equilibrium level,
respectively, and integrating this buoyancy over
the height range of interest. These values
provide important information on the potential
for thunderstorm development and the strength
of updrafts in the atmosphere.
85. IMPORTANT NOTES:
Dew: Dew is the condensation of water droplets that occurs on surfaces
when the temperature of the surface drops below the dew point
temperature of the surrounding air.
Frost: Frost is a covering of ice crystals that forms on surfaces when the
temperature of the surface drops below the freezing point temperature of
the surrounding air.
Fog: Fog is a cloud that forms near the ground when the temperature of
the air drops to the dew point and the air becomes saturated with
moisture.
Clouds: Clouds are visible masses of water droplets or ice crystals
suspended in the atmosphere. They form when moist air rises and cools,
causing water vapor to condense into liquid or solid particles.
Precipitation: Precipitation is any form of water that falls from the
atmosphere to the Earth's surface. This includes rain, snow, sleet, and hail.
86. Airmass: An airmass is a large body of air that has a relatively
uniform temperature and moisture content. Airmasses are classified
based on their temperature and moisture characteristics, which are
determined by their source region.
Fronts: Fronts are boundaries between air masses of different
temperature and moisture characteristics. When two air masses meet,
they do not mix easily, and the resulting boundary between them is a
front.
Tornado: A tornado is a violently rotating column of air that extends
from a thunderstorm to the ground. Tornadoes can cause significant
damage and loss of life.
Cyclones: Cyclones are areas of low pressure in the atmosphere that
are associated with rotating winds and storms. Cyclones can be large
weather systems that impact entire regions.
Dust Storm: A dust storm is a strong wind that picks up and carries
dust and other particulate matter, reducing visibility and potentially
causing respiratory problems. Dust storms often occur in arid regions