Download to read offline

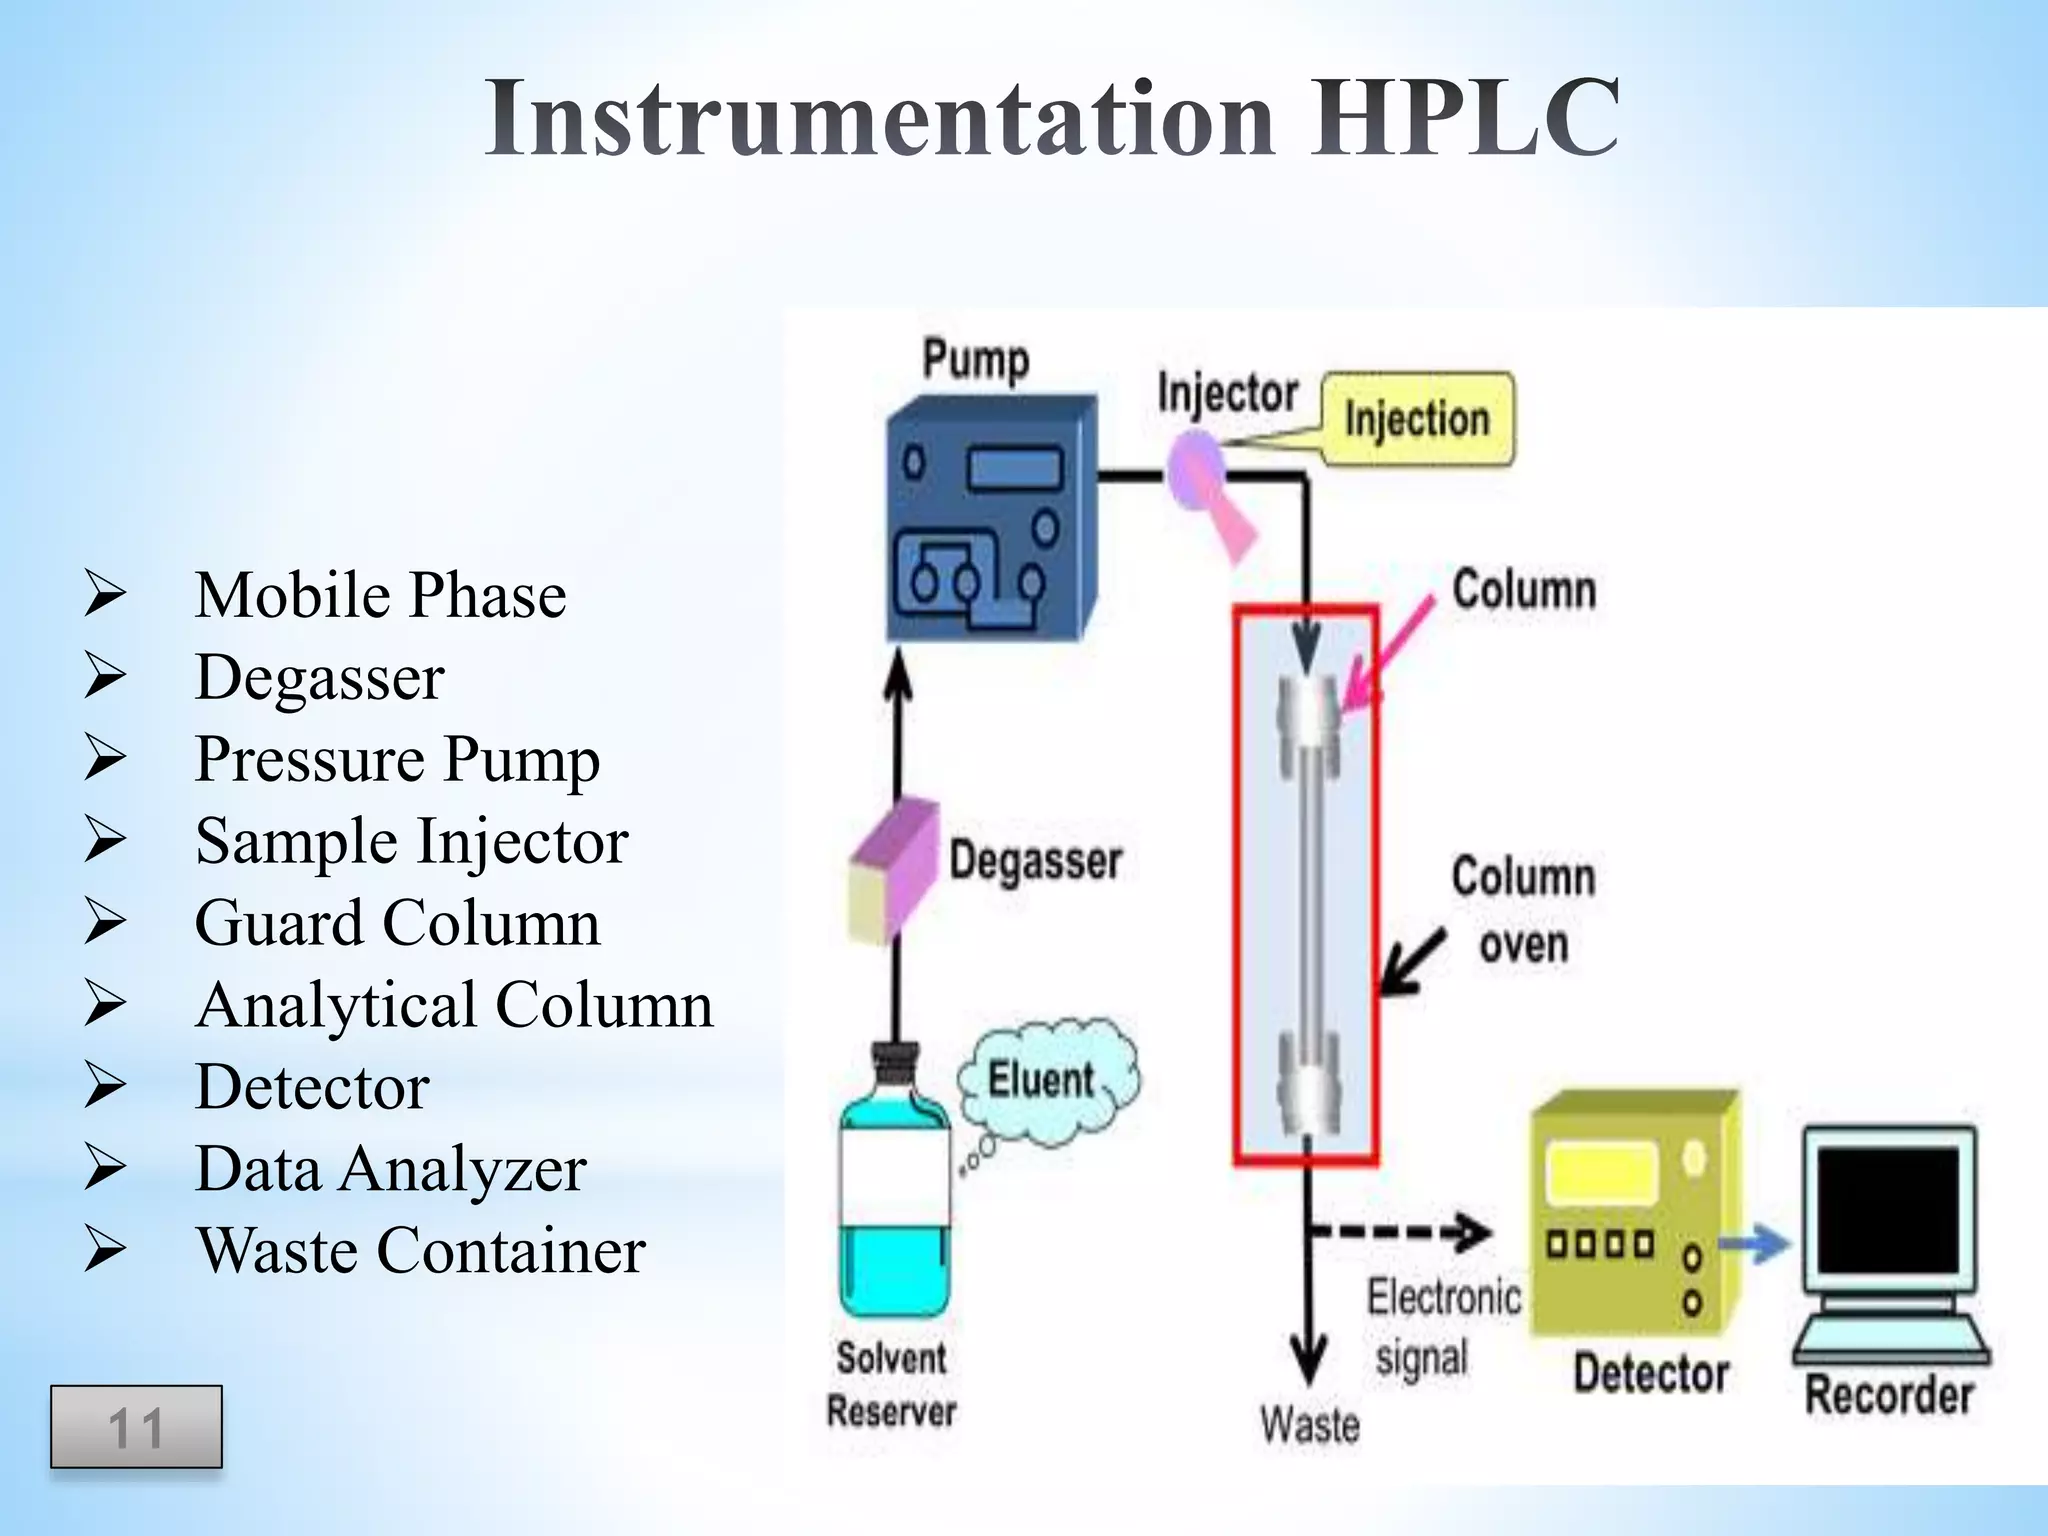


The document discusses the applications of ultraviolet (UV) spectroscopy with High-Performance Liquid Chromatography (HPLC), explaining key concepts such as separation techniques, instrumentation, and detector types. It highlights the advantages of UV detection, including sensitivity and wide applicability in various industries such as pharmaceuticals and food. The content also acknowledges contributors and references relevant literature on the topic.


