The document discusses the history, definition, and various applications of Bessel's function across fields such as mechanical engineering, frequency modulation, biology, and its relevance in daily life. It highlights how Bessel's function can be used in heat transfer, DNA structure analysis, and sound modulation. Additionally, it includes mathematical formulations and examples to illustrate these applications.
Contents.
>History and definition.
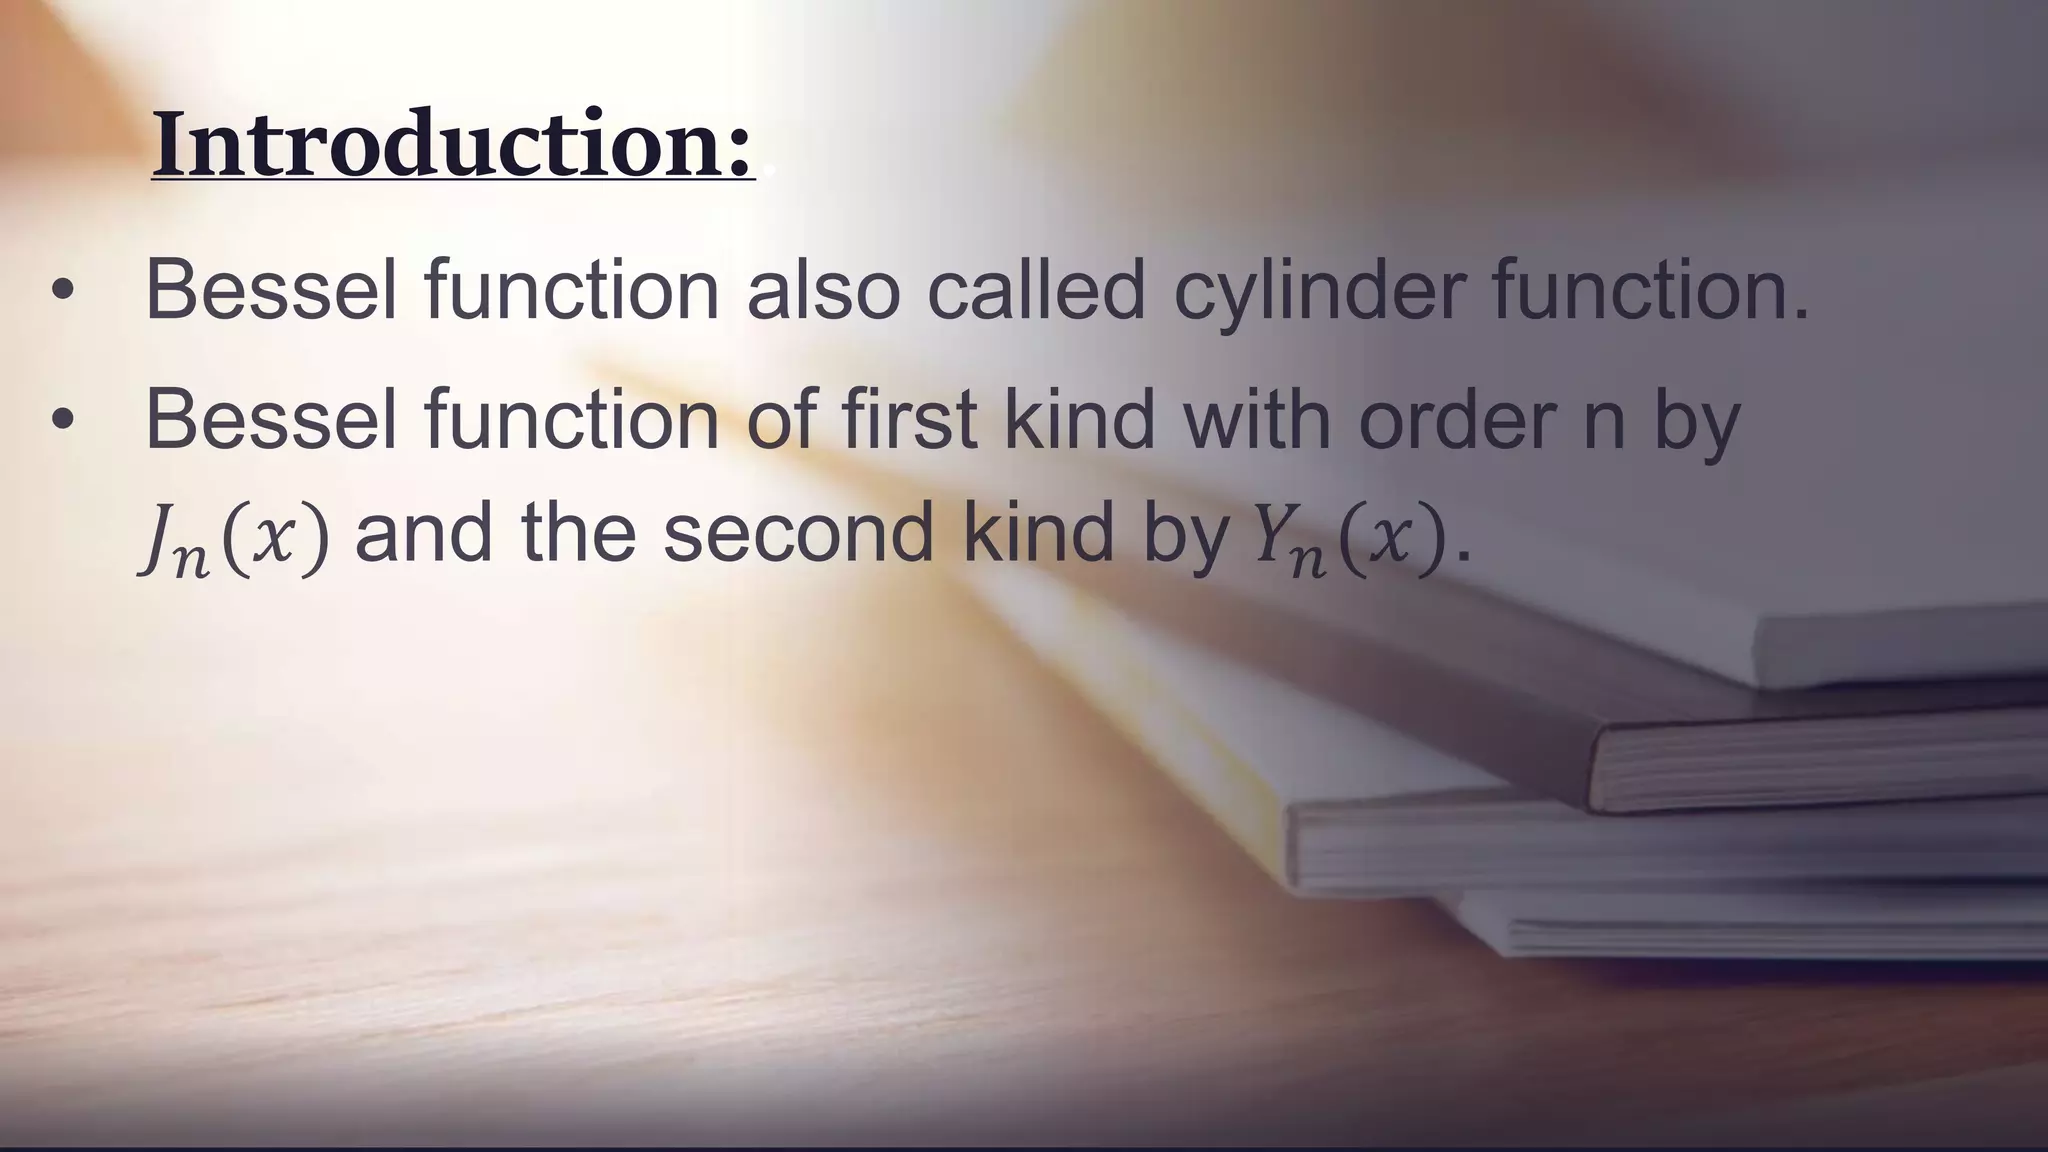
>Introduction.
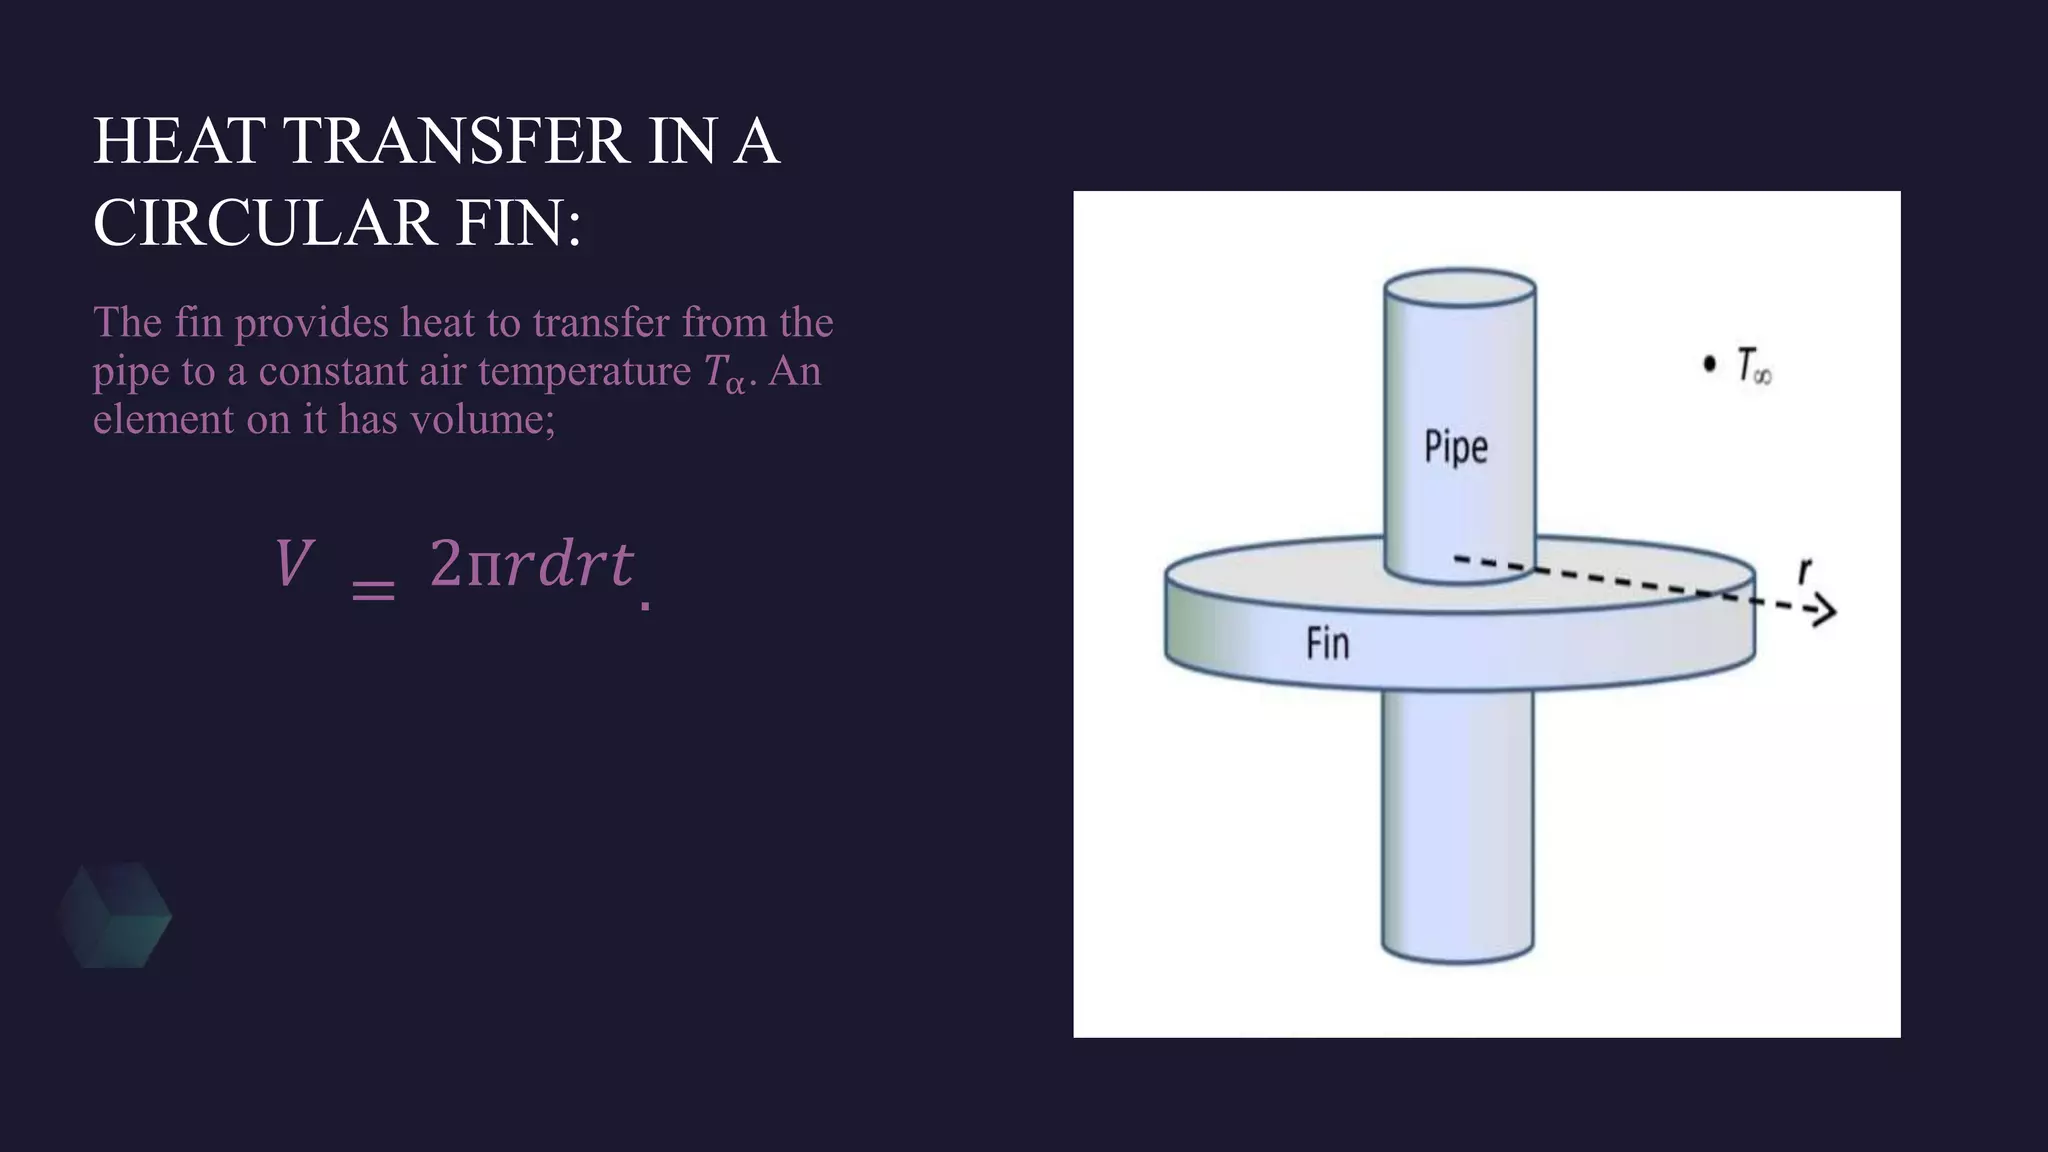
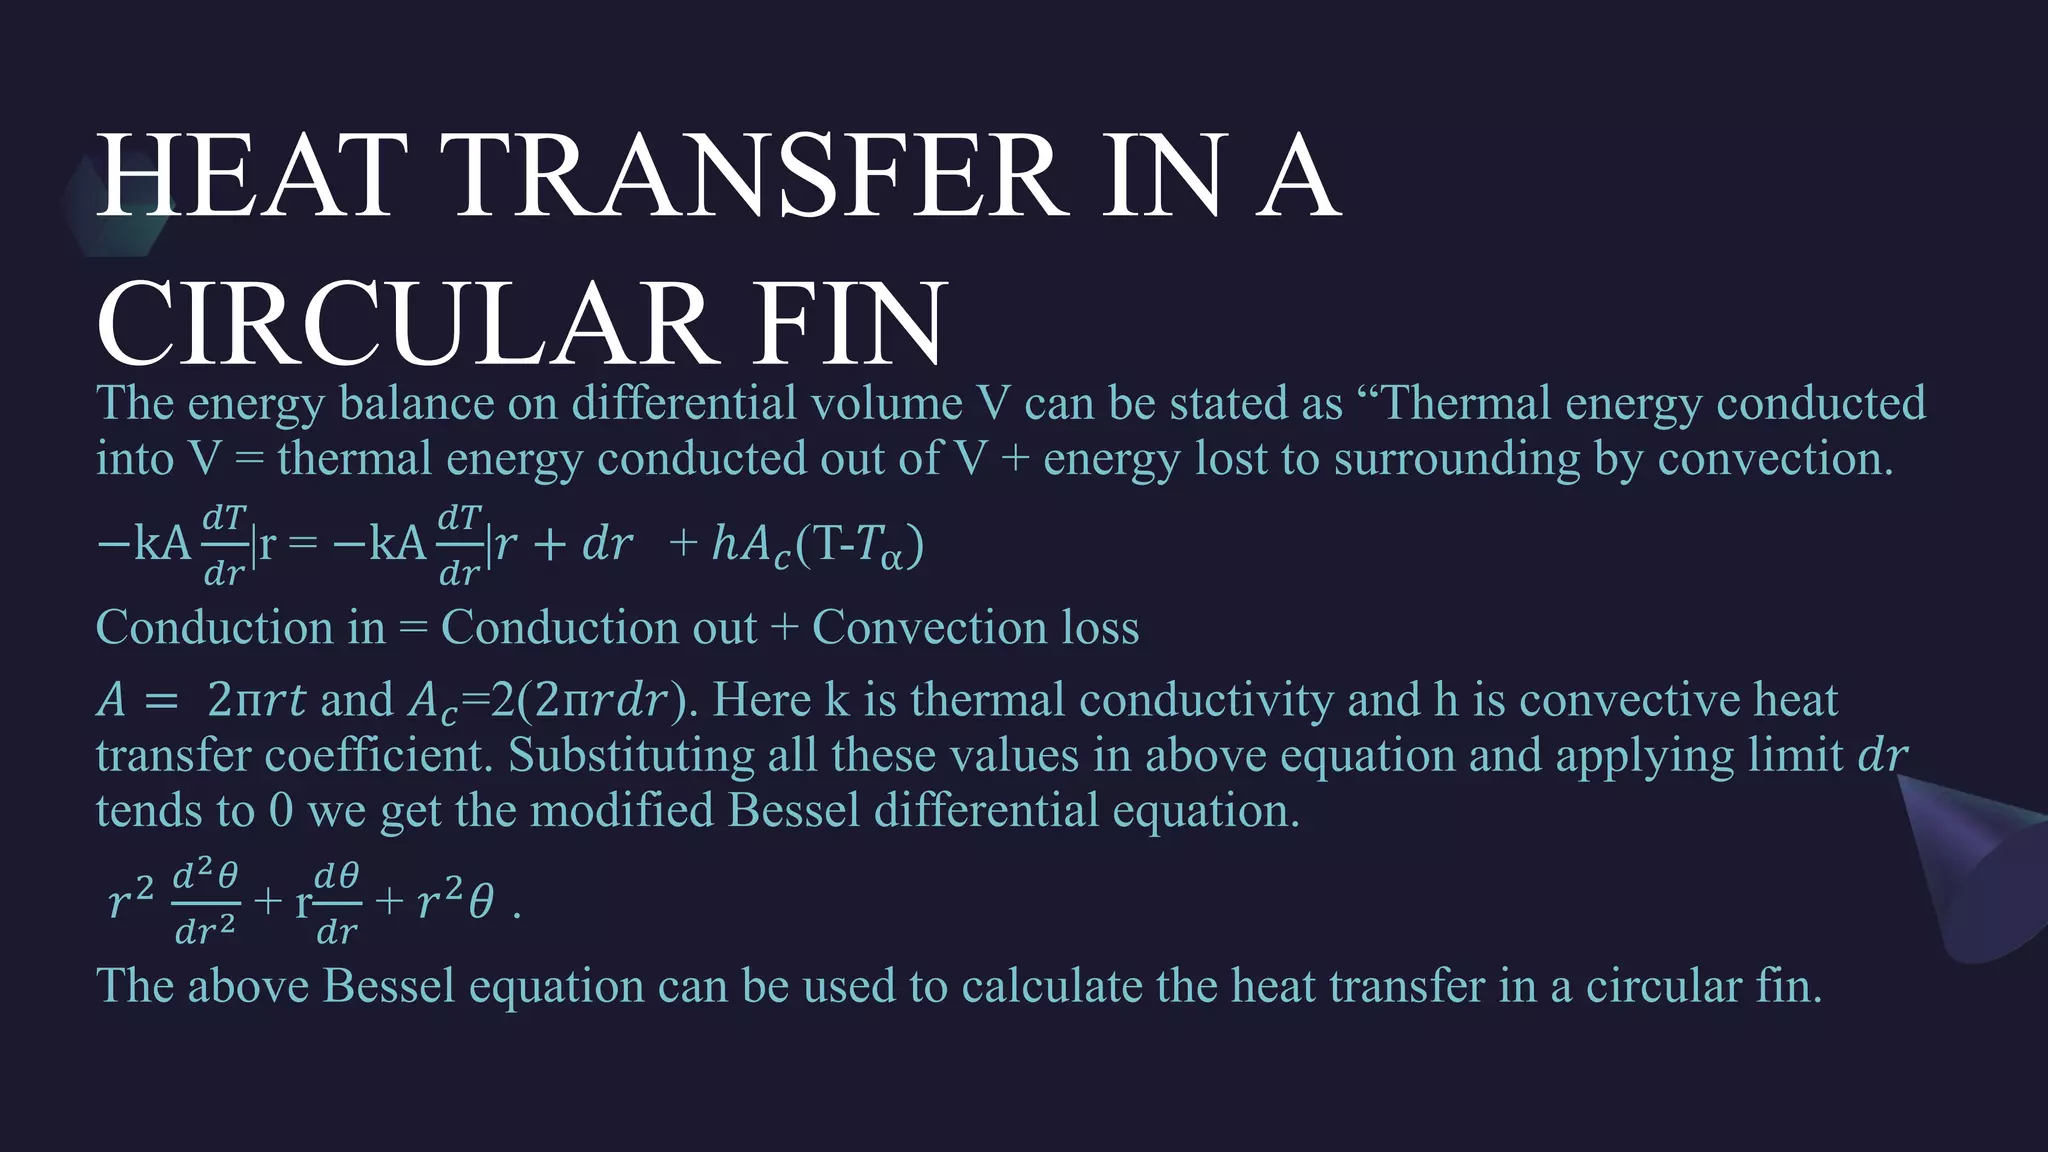
>Applicationin Mechanical Engineering.
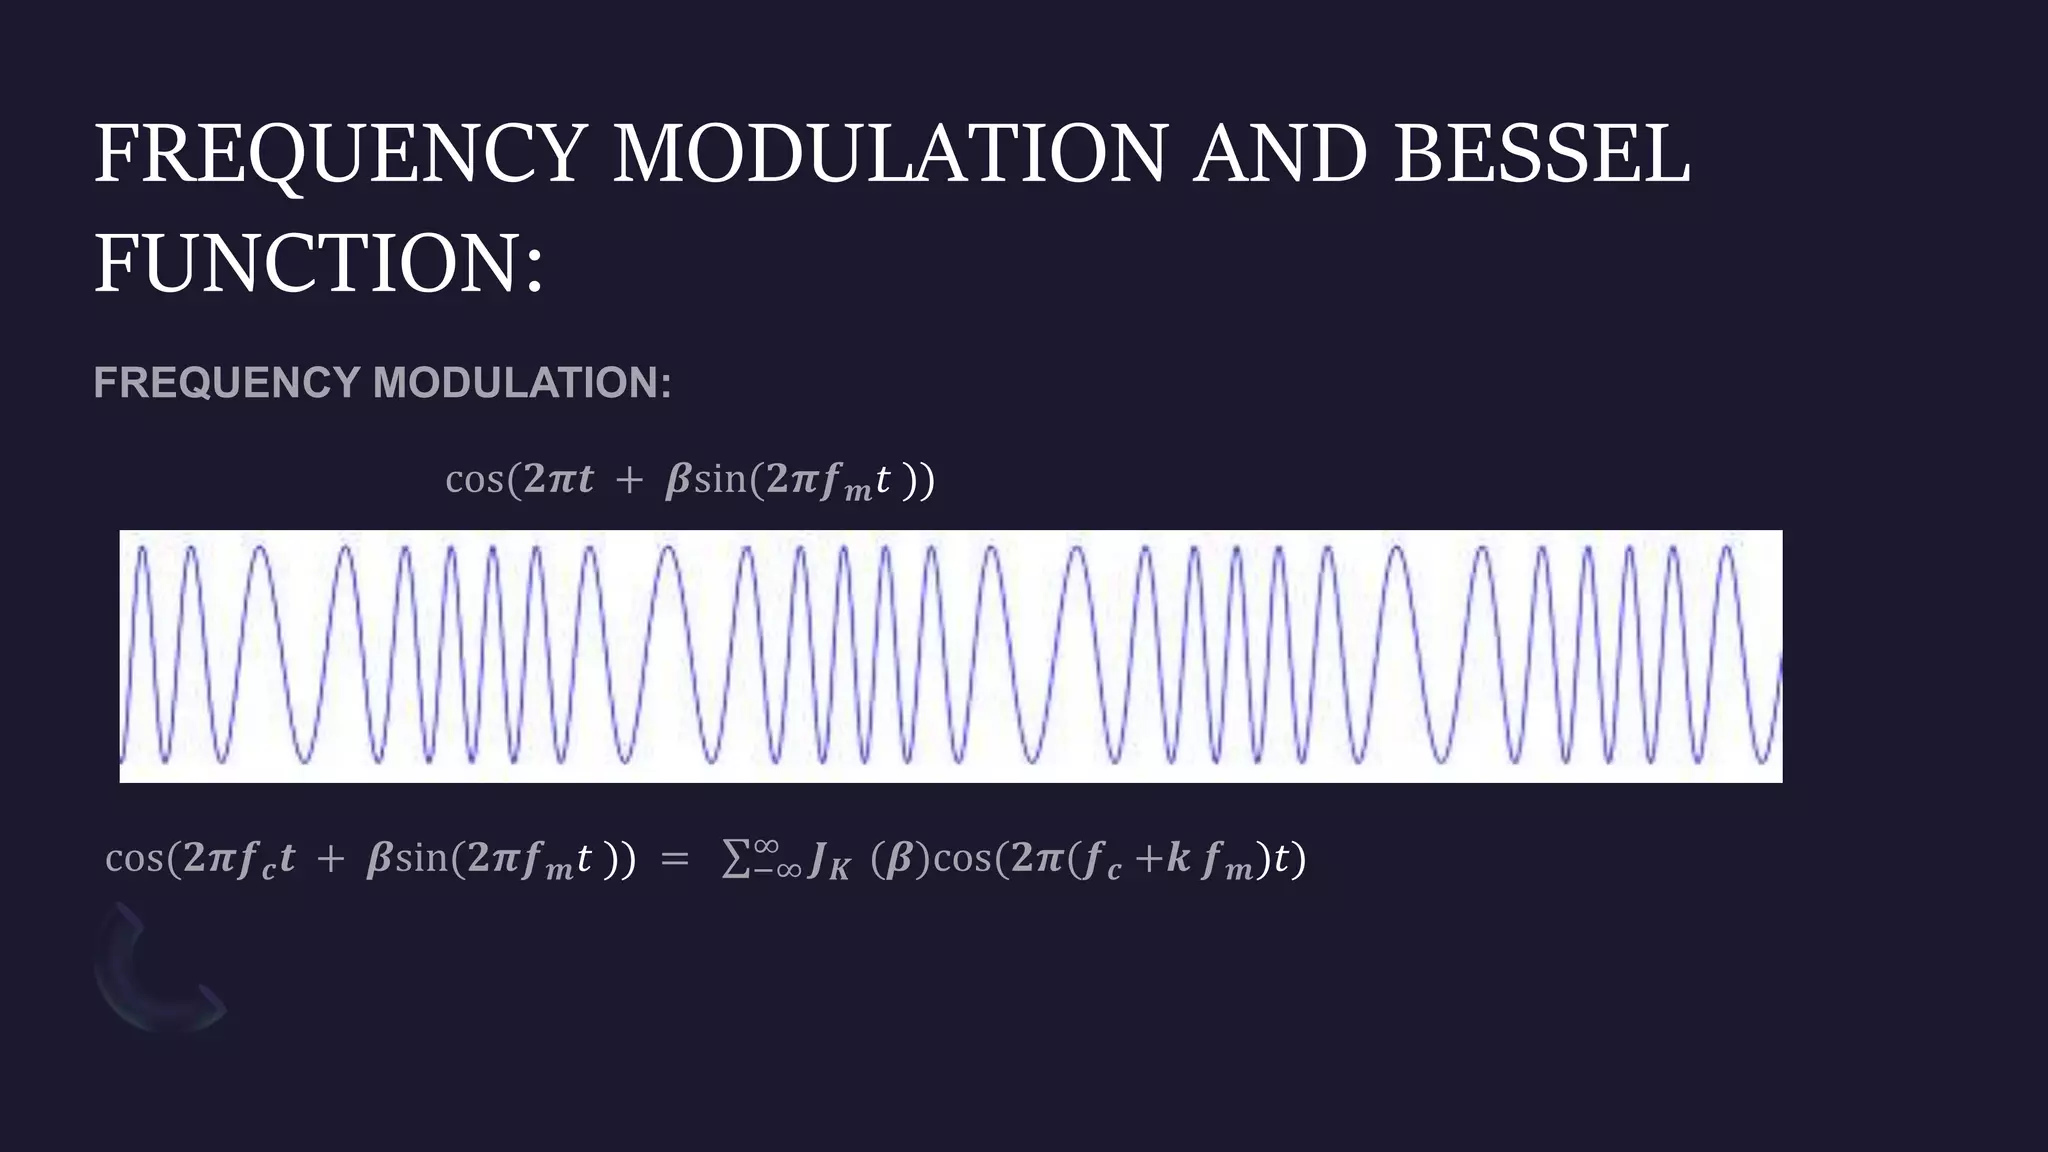
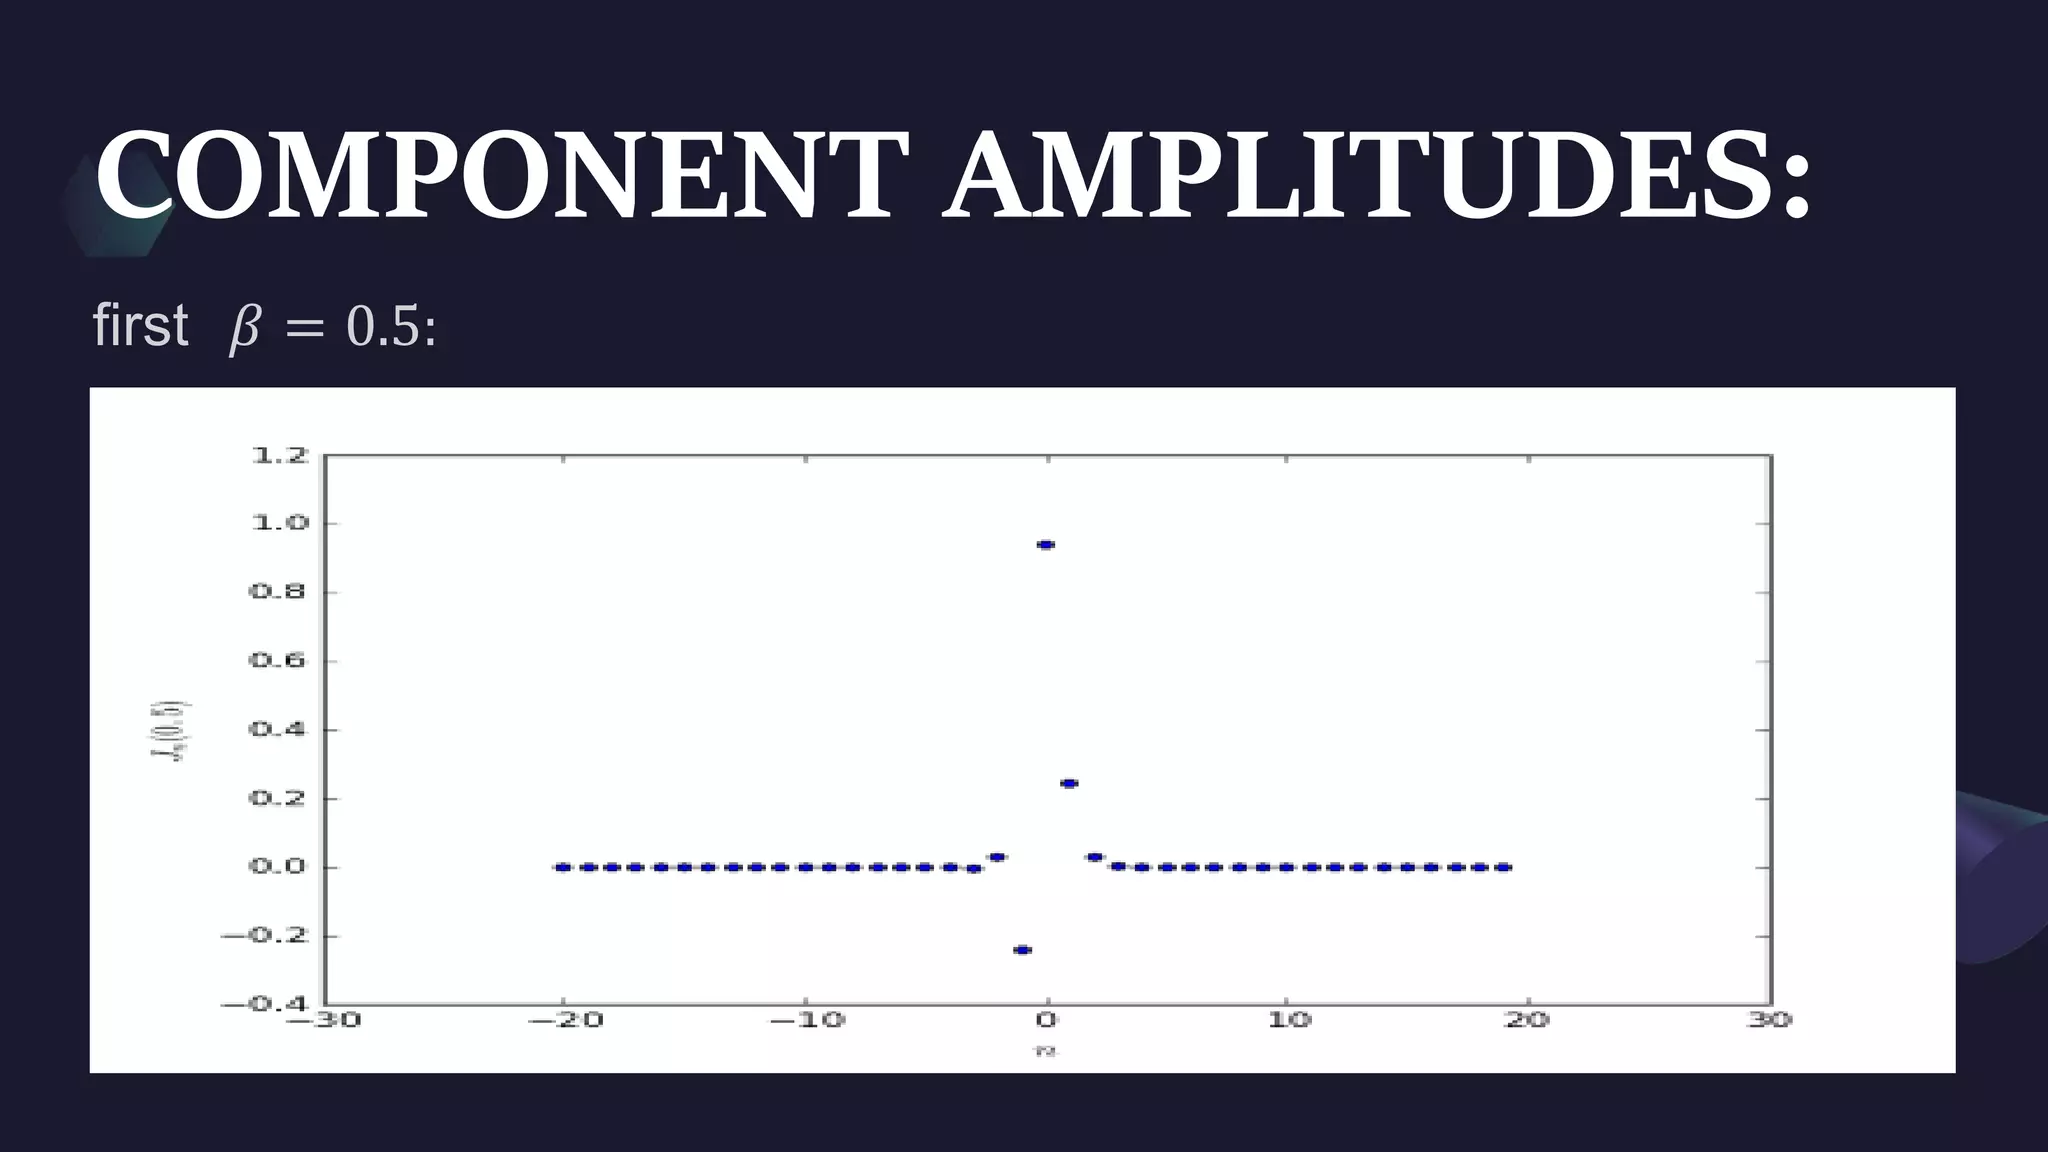
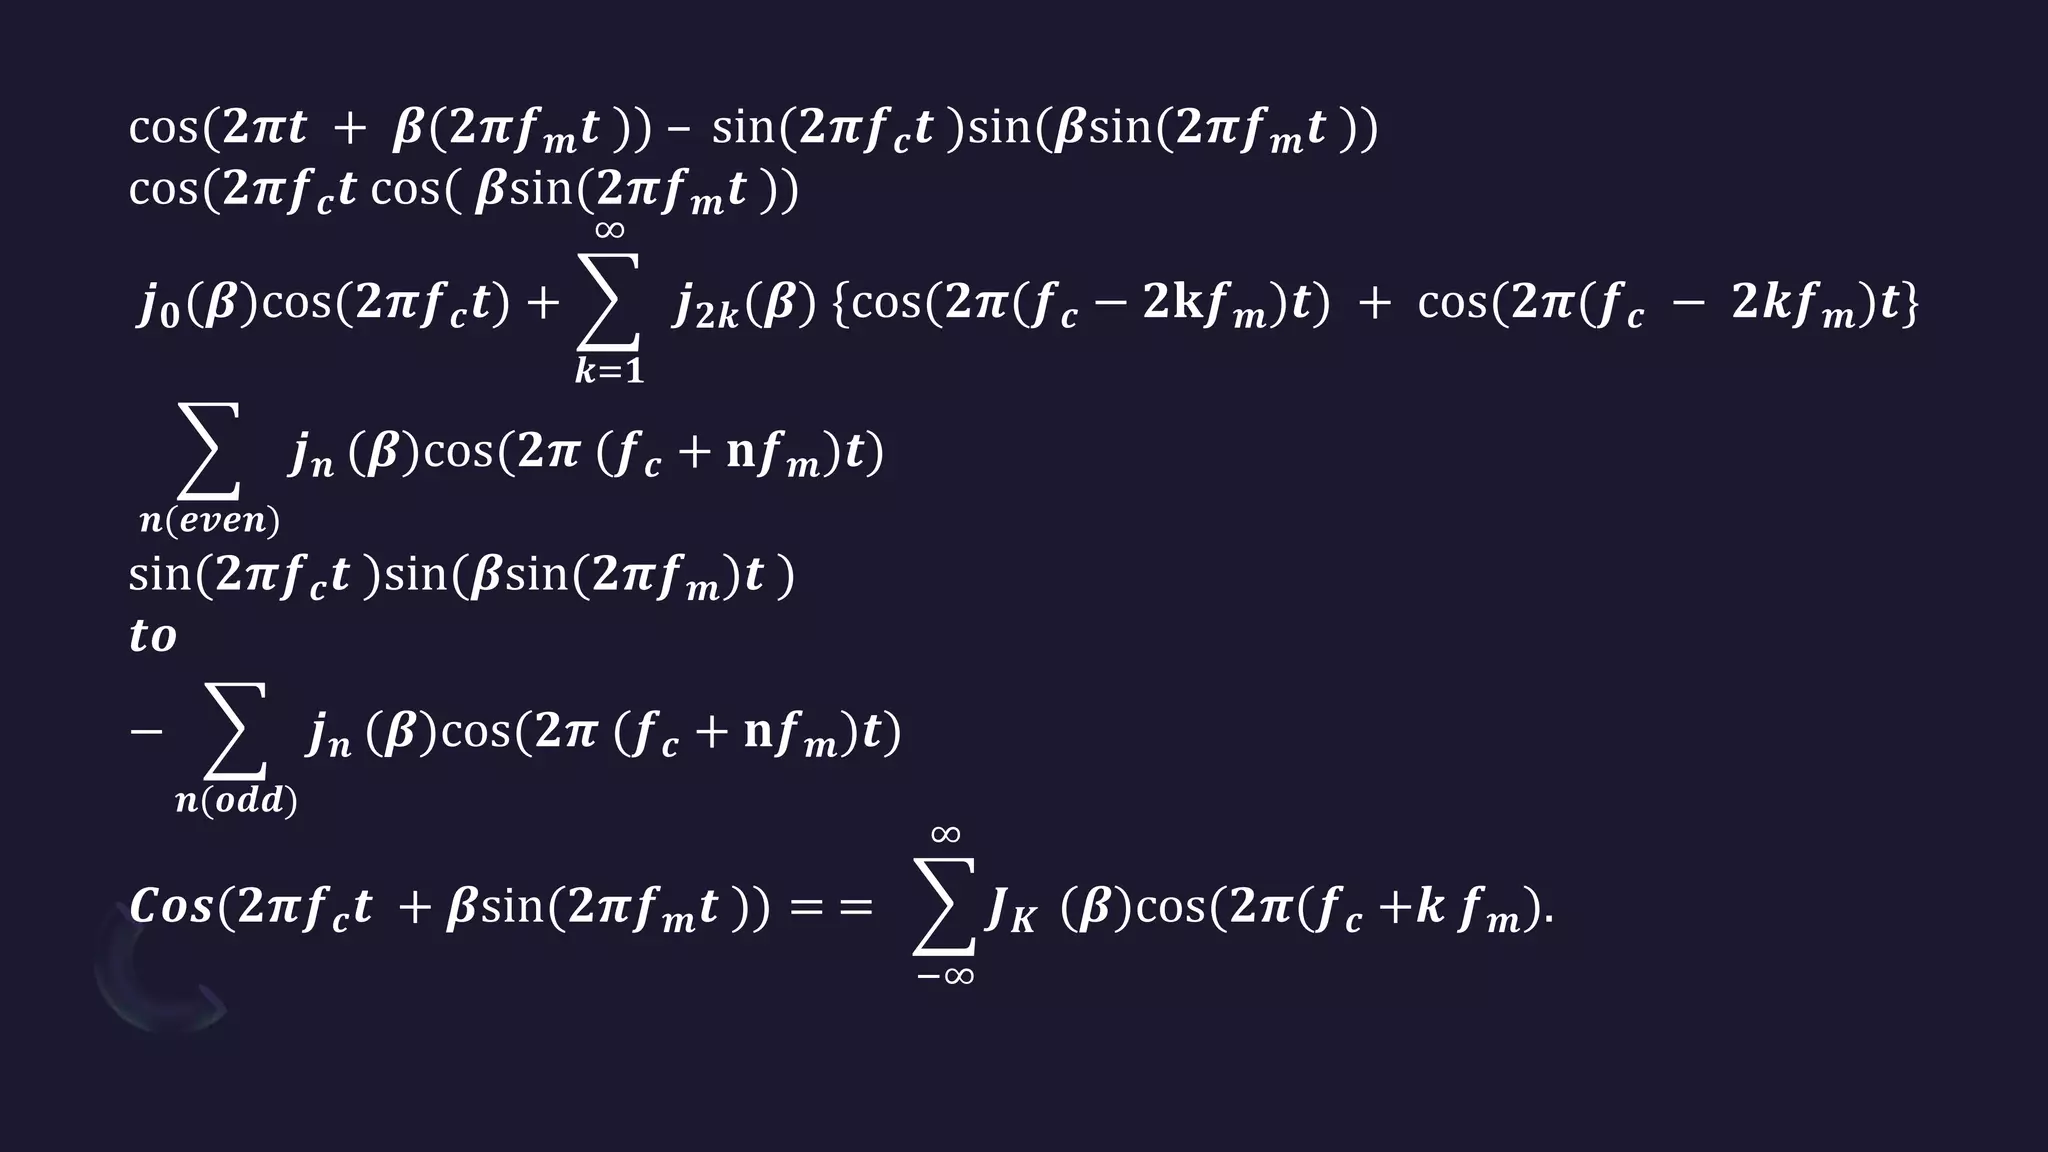
>Uses of Bessel’s function in frequency
modulation.
>Application of Bessel’s Function is
Biology.
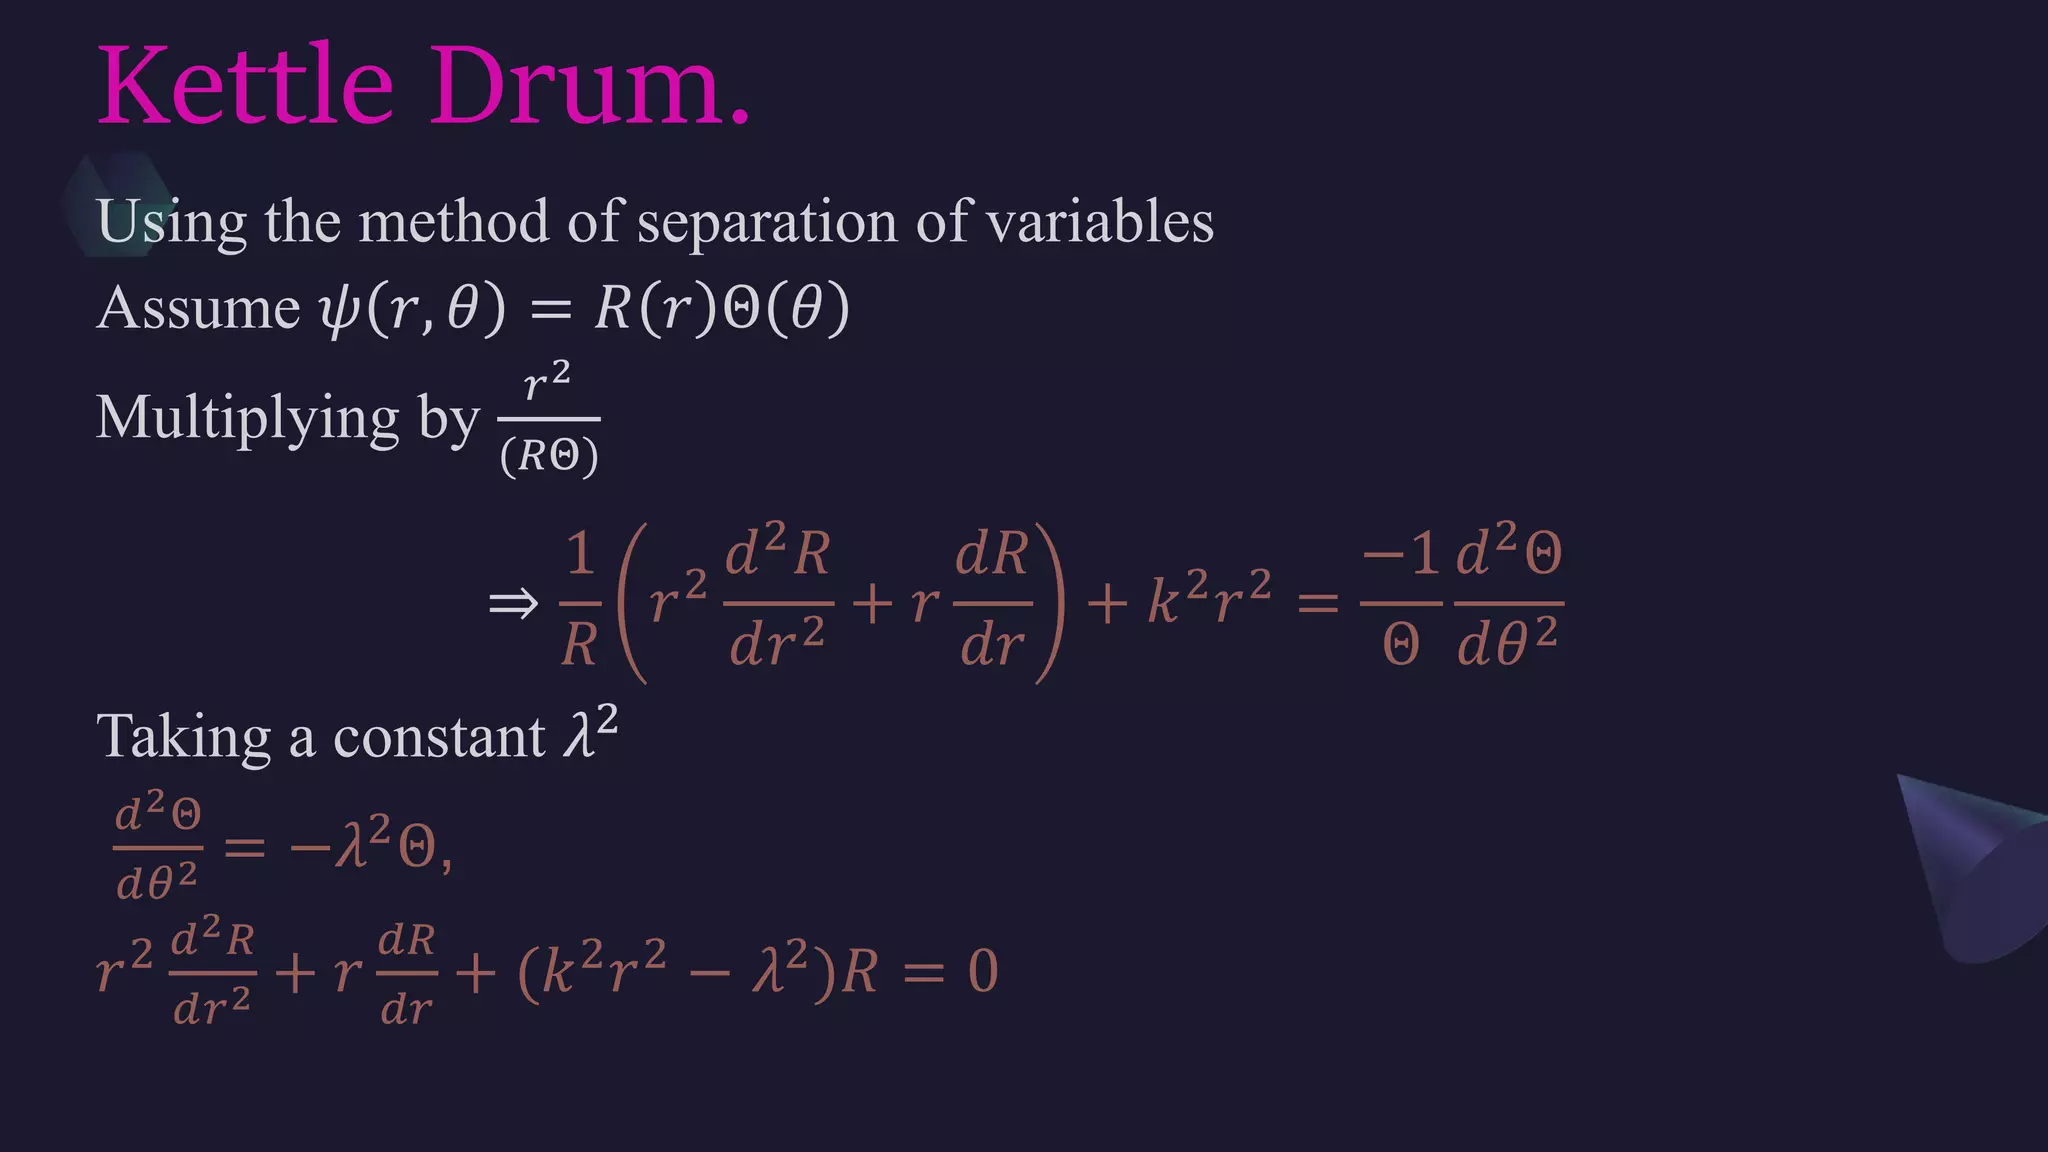
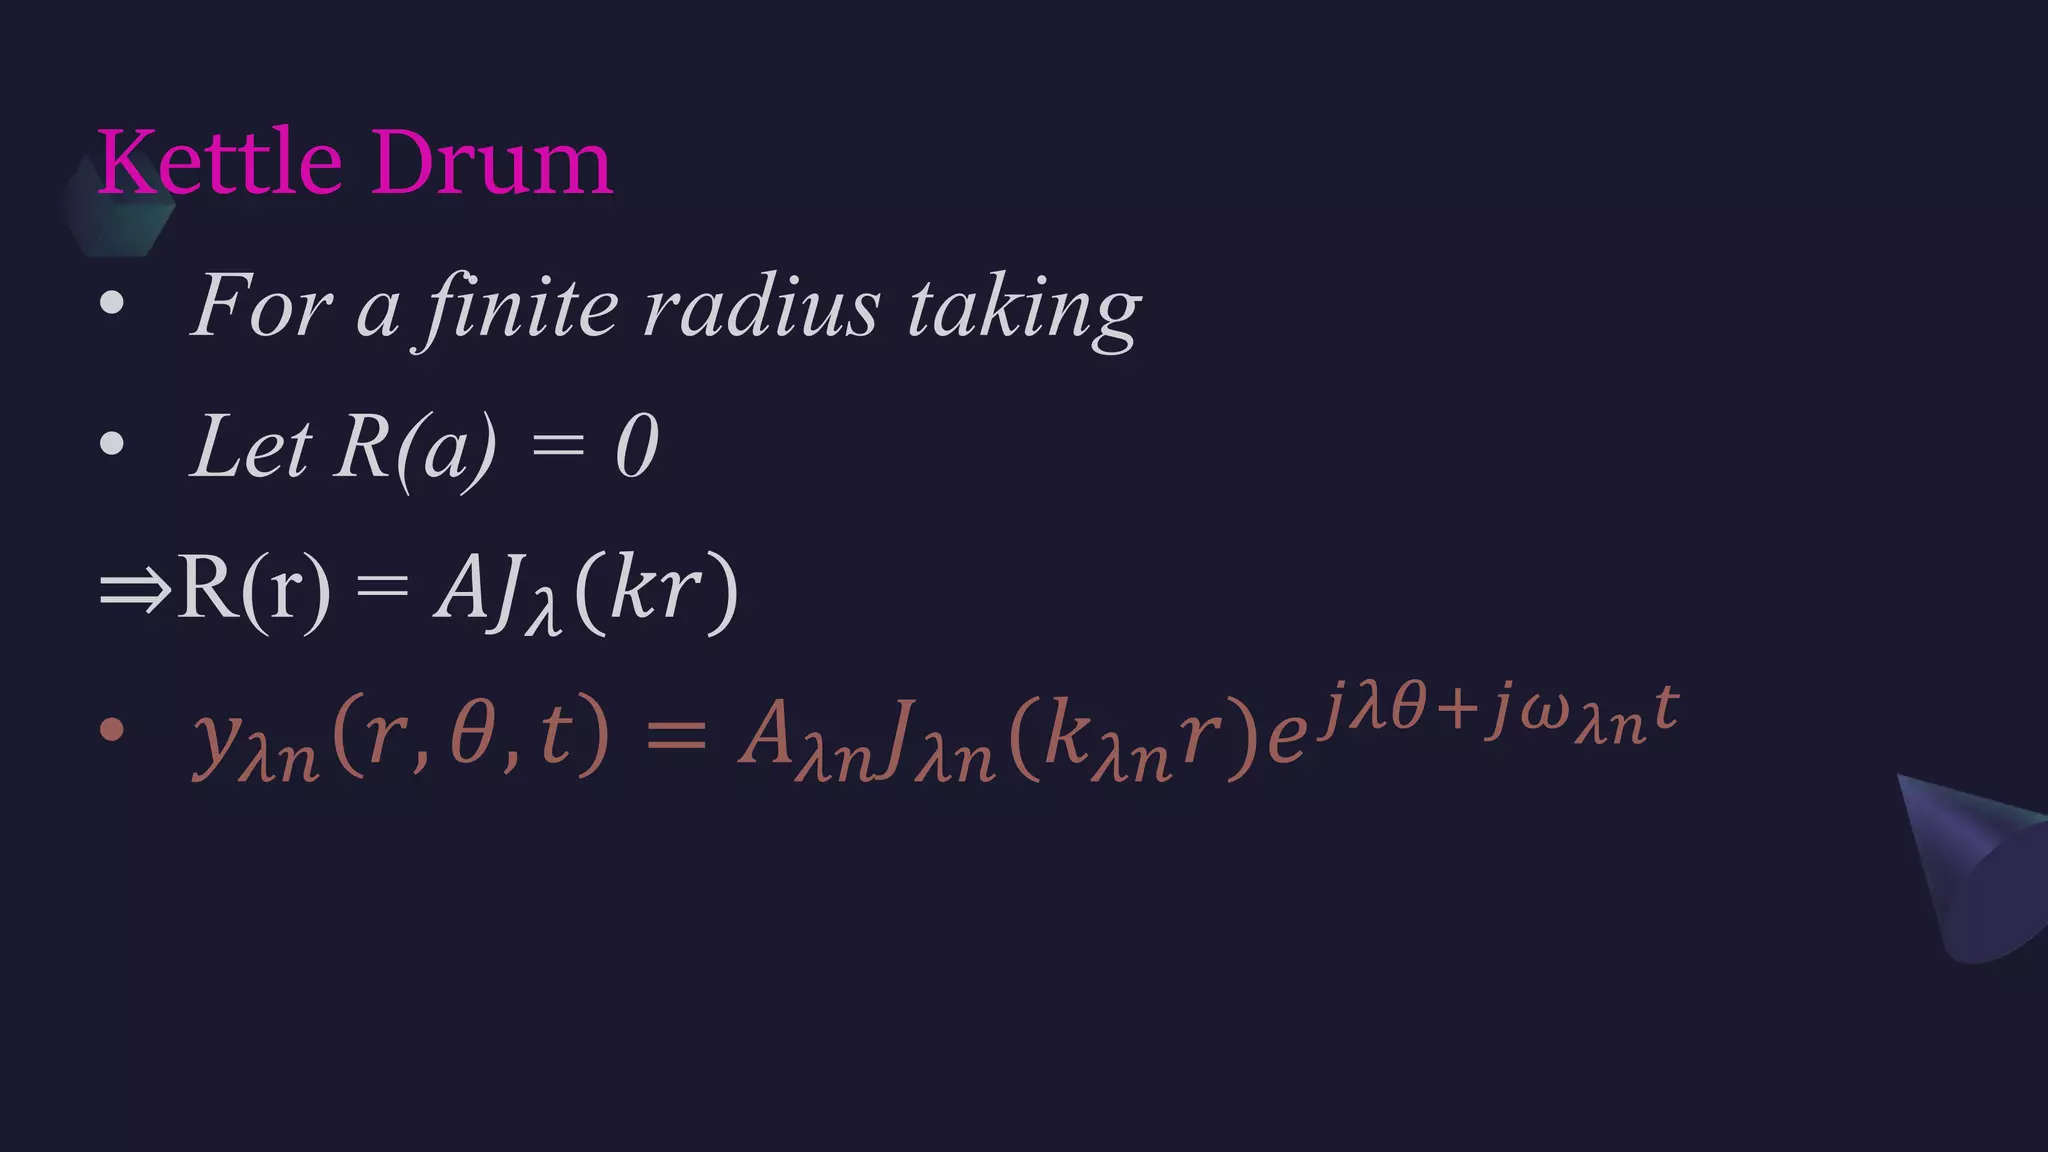
>Kettle Drum.
>Application of Bessel’s function in daily
life.
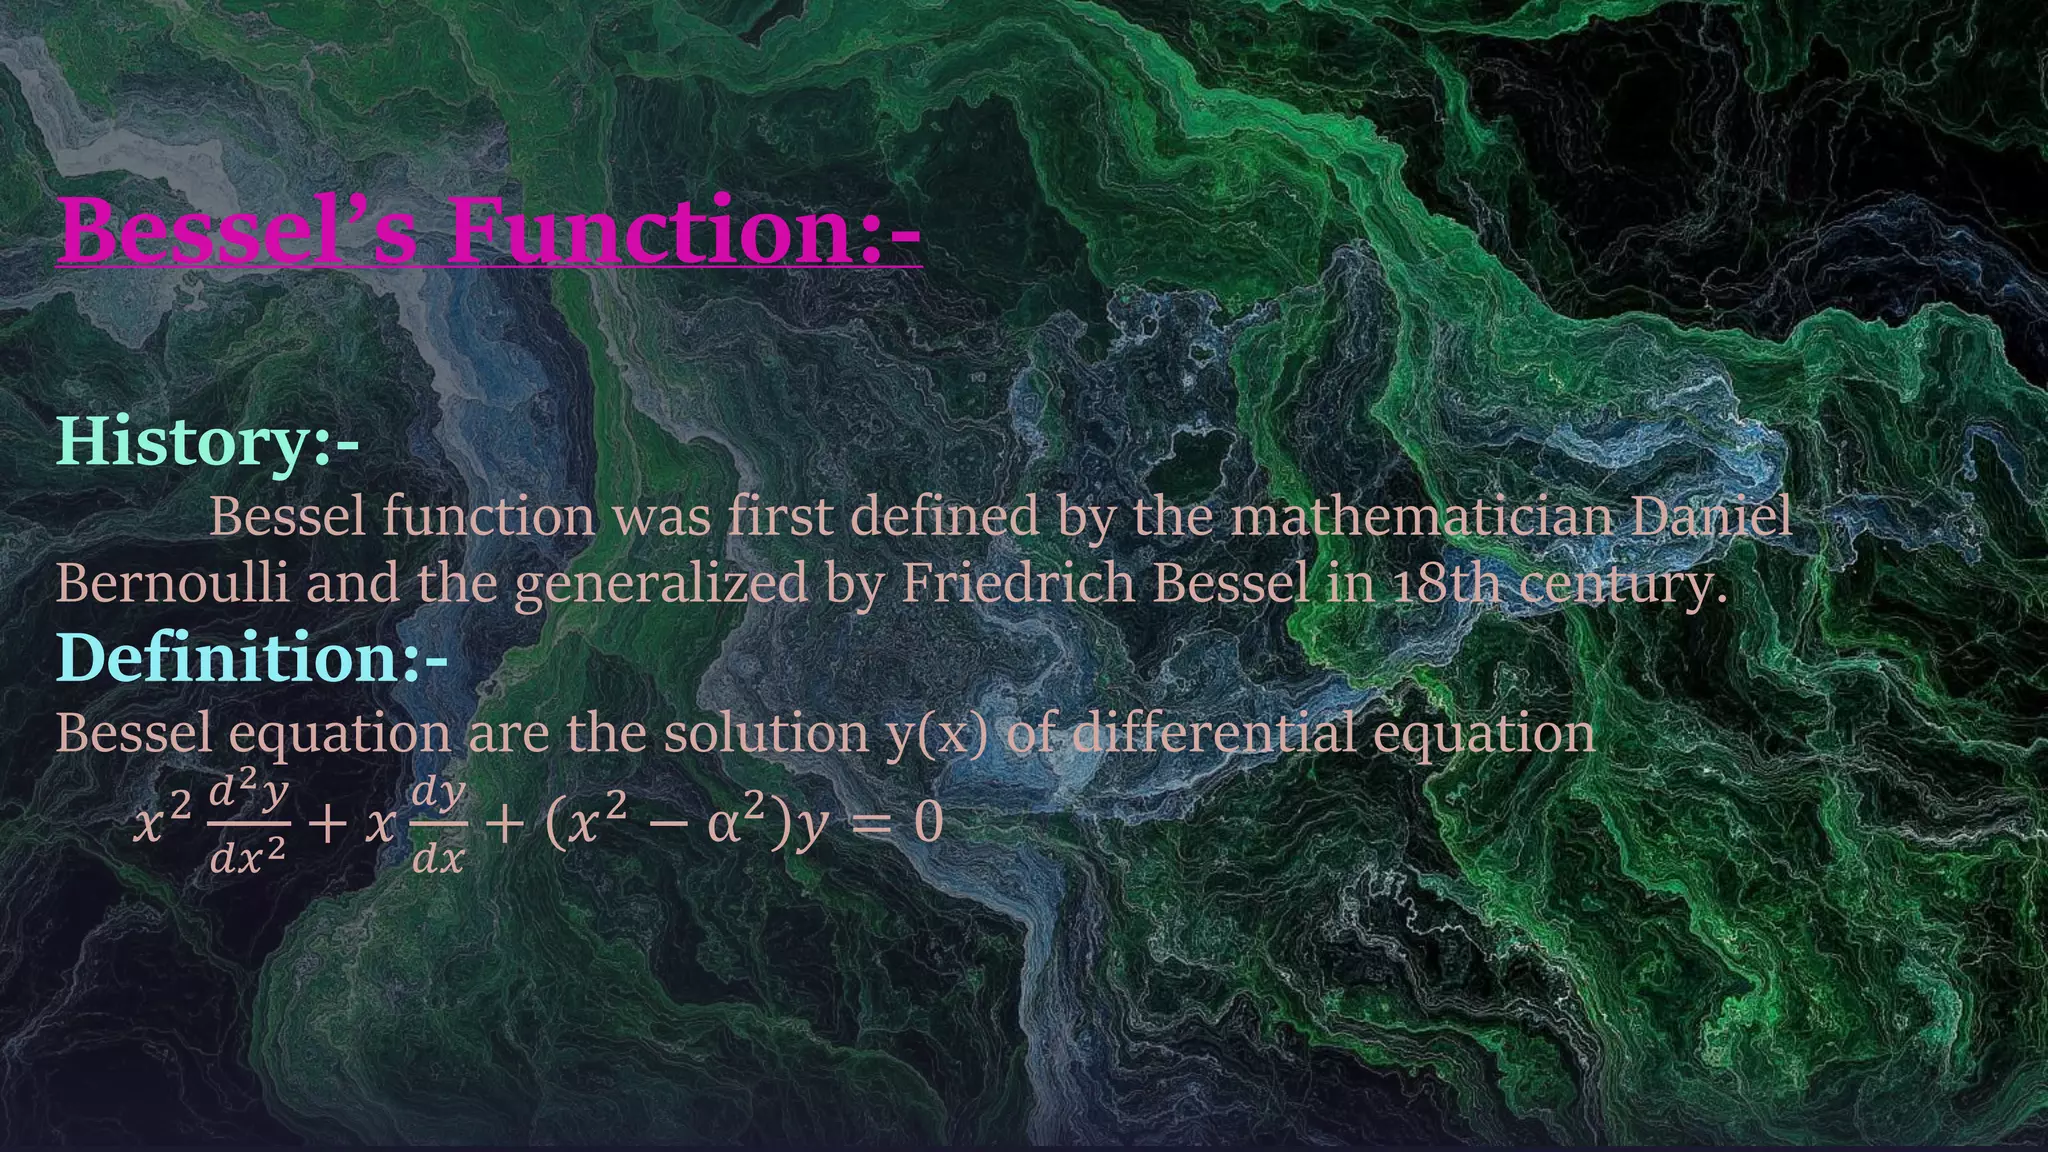
Bessel’s Function:-
History:-
Bessel functionwas first defined by the mathematician Daniel
Bernoulli and the generalized by Friedrich Bessel in 18th century.
Definition:-
Bessel equation are the solution y(x) of differential equation
𝑥2 𝑑2𝑦
𝑑𝑥2 + 𝑥
𝑑𝑦
𝑑𝑥
+ 𝑥2
− α2
𝑦 = 0
Bessel function inthe structure of DNA
Bessel's function is given by:
𝐽𝛼 = 𝐽𝛼(𝑥) =
(−1)𝑛
𝑛!
(𝑛 + 𝛼)! × (
𝑥
2
)(2𝑛 + 𝛼)𝐽𝛼 = 𝐽𝛼(𝑥)
=
(−1)𝑛
𝑛!
(𝑛 + 𝛼)! × (
𝑥
2
)(2𝑛 + 𝛼)
Where, variable α is called the order of the function, and the
values of n are integers.
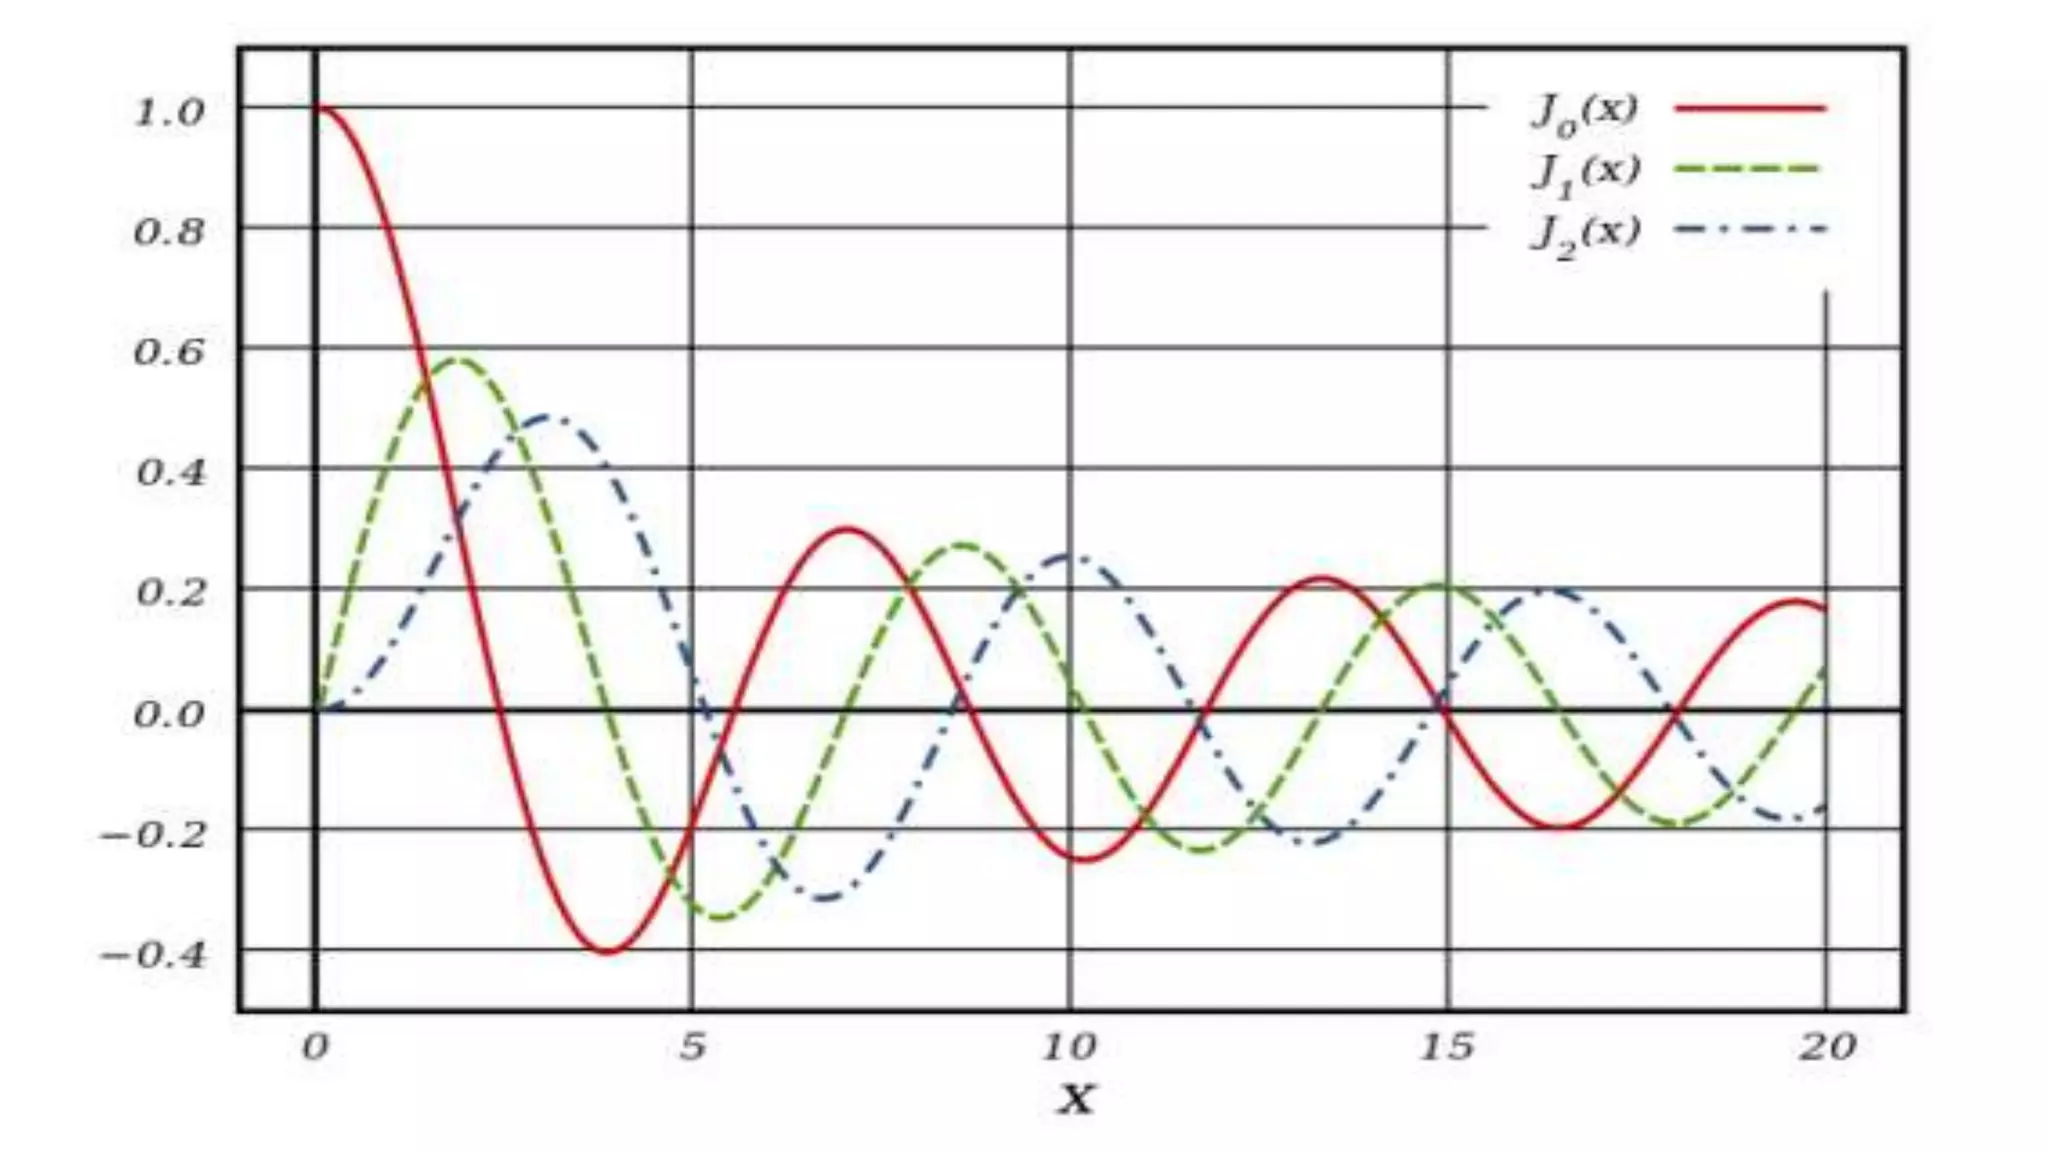
So, now how does one plot the Bessel function? Simple, if you
want to plot the Bessel function of order zero, you plug in the
values 𝛼 = 0 and 𝑛 = 0 and then plot J as a function of 𝑥 over
some range −𝑥 to +𝑥. Next you plug in 𝛼 = 0 and 𝑛 = 1, plot
again, and add the resulting curve to the one for which n = 0, just
as curves were added together to give the Fourier sum:
19.
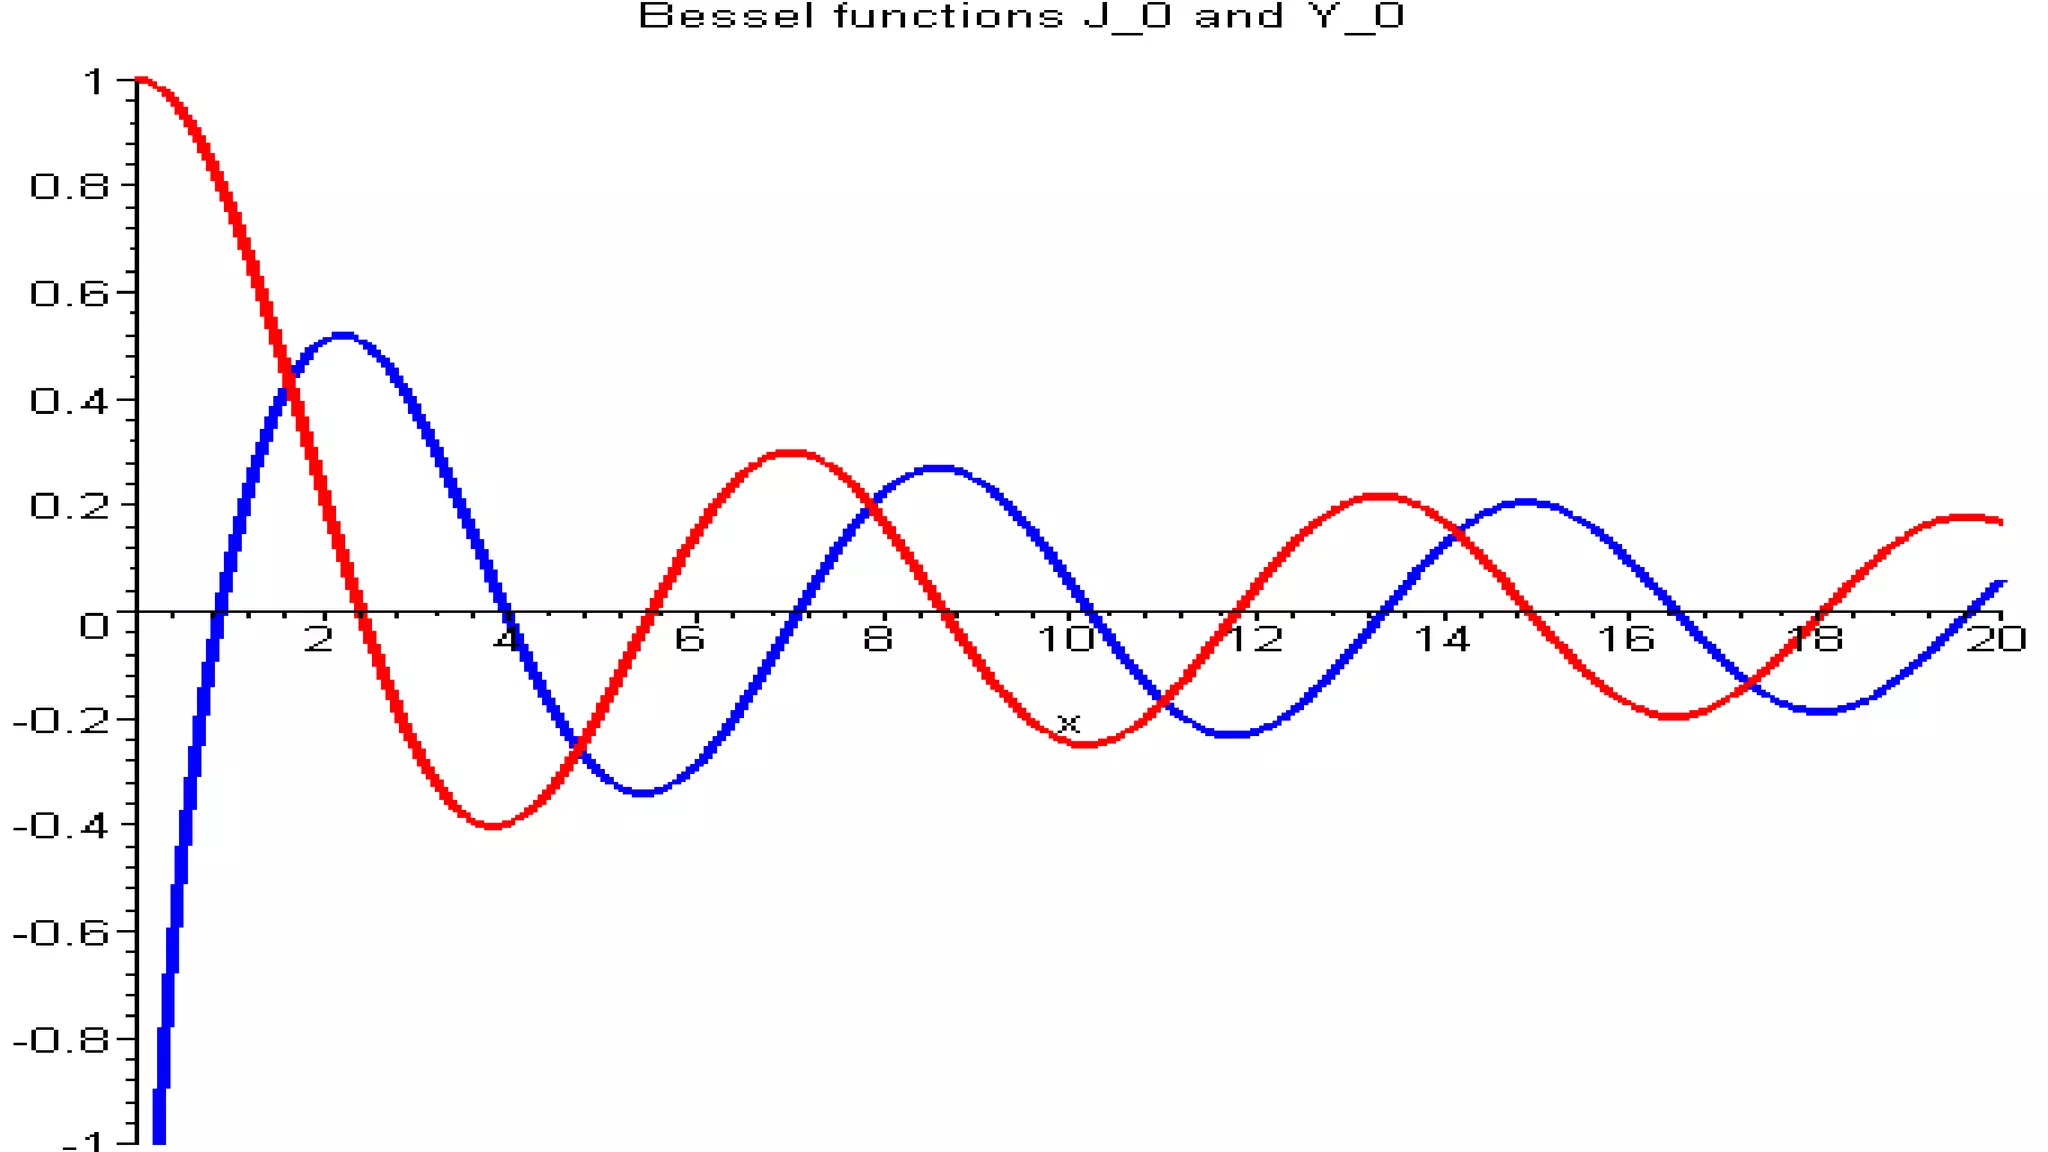
Thus, as theorder increases, the position of
the first peak of the function occurs farther
from the origin.
Francis Crick showed in his doctoral
dissertation that in the transform of a
continuous helix, the intensity along a layer
line is described by the square of the Bessel
function whose order α equals the number l
of the layer line..
Thus, the intensity of the central line,
layer line zero, varies according
to J0(x)]2J0(x)]2, which is the square
of the above equation, α = 0 (red). The
intensity of the first line above (or
below) center varies according
to J1(x)]2J1(x)]2(green), and so on..


![Thus, as the order increases, the position of
the first peak of the function occurs farther
from the origin.
Francis Crick showed in his doctoral
dissertation that in the transform of a
continuous helix, the intensity along a layer
line is described by the square of the Bessel
function whose order α equals the number l
of the layer line..
Thus, the intensity of the central line,
layer line zero, varies according
to J0(x)]2J0(x)]2, which is the square
of the above equation, α = 0 (red). The
intensity of the first line above (or
below) center varies according
to J1(x)]2J1(x)]2(green), and so on..](https://image.slidesharecdn.com/m-210404182949/75/Applications-of-Bessel-s-Function-19-2048.jpg)