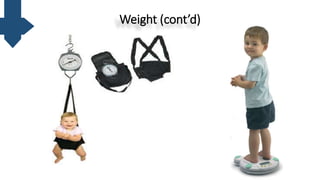
ANTHROPOMETRY
Prepared by
Group A
Roll No. 9- 15
BNS 2nd Year
Introduction
Anthropometry = anthropo + metry
 Anthropo means ‘human’ and metry means ‘measurement’.
It is the measurement of physical dimensions such as the fat
mass, composition of human body.
It is a convenient and reliable technique whereby changes in
the nutritional status can be evaluated easily.
Introduction (cont’d)
Anthropometric measurements are now regarded as
important indicators of an individual’s nutritional status which
are given below:
• Height/ length
• Weight
• Mid-arm circumference
• Head circumference
Introduction (cont’d)
• Chest circumference
• Triceps skin fold thickness
• Waist-hip ratio
• Body mass index
• Abdominal girth
Anthropometric Measurements
for Infant
Head Circumference
 Routinely measured until 5 years of
age.
 Measured by placing the tape over
the occipital protuberance at the
back and just over the supraorbital
ridge and the glabella in front.
Head Circumference (cont’d)
Age Head circumference (cm)
At birth 33-35
2 months 38
3 months 40
4 months 41
6 months 42-43
1 year 45-46
2 years 47-48
5 years 50-51
Expected Head Circumference in Children
Chest Circumference
Usually measured at the level
of nipples.
In children
•<=5 years: lying down
position
•>5 years: standing position
Chest Circumference (cont’d)
At birth head circumference is more than chest
circumference by up to 3 cm.
At around 9 months to 1 year of age head circumference is
equal to chest circumference but there after chest grows
more rapidly compared to the brain.
Chest Circumference (cont’d)
The head circumference is greater than chest
circumference by more than 3 cm in:
• preterm
• small for date and
• hydrocephalus infants
Chest Circumference (cont’d)
In malnourished children chest size may be
significantly smaller than head circumference because
growth of brain is less affected by undernutrition.
Therefore there will be considerable delay before
chest circumference overtakes head circumference.
Weight
The measurement of weight is most
reliable criteria of assessment of
health and nutritional status of
children.
The periodic recording of weight on a
growth chart is essential for
monitoring the growth of under five
children.
Weight (cont’d)
Birth weight is double at 4-5 months and triple at 1 year of age.
Weight measurement help to identify acute malnutrition and it is
measured in kilogram
Standard calibrated weighing machine (saltier scale) used for
weighing the child. Machine can weight one to 25 kg.
Weight (cont’d)
Weight for Age Grade of Malnutrition
>80% Normal
71-80% Grade 1 (Mild)
61-70% Grade 2 (Moderate)
51-60% Grade 3 (severe)
<50% Grade 4 (very severe)
Classification of Malnutrition by Indian Academy of
Pediatrics
Length or Height
 Up to 2 years of age recumbent length
is measured with the help of an
Infantometer.
 Normal length of child at birth is 50 cm
and 25 cm length is increase during 1
year of age.
Length or Height (cont’d)
Age Approximate Rate of Increase in
Stature
Birth to 3 months 3.5 cm/month
3-6 months 2.0 cm/month
6-9 months 1.5 cm/month
9-12 months 1.3 cm/month
Height Velocity
Anthropometric Measurements
for
Under 5 Children
Height
 Height is the distance from the bottom of the feet to the top of
the head in a human body standing erect which is stable
measurement of growth.
It is measured in child and adults too in which either a
stadiometer or portable anthropometer is used.
Measurements are recorded to the nearest millimeter.
Height (cont’d)
Stadiometer Portable Anthropometer
Height (cont’d)
Height for age is an index used for assessing stunting (chronic
malnutrition in children).
Stunting is defined as low height for age of child as
compared to the standard child of the same age.
Stunting has direct effect in linear growth.
Weight
Weight for age is most sensitive and best method for assessing
physical growth and nutritional status of children.
Growth should be monitored every month for up to the age of
24 months using a weighing sling known as “Saltar Scale”.
For children above 2 years digital weighing machine can be used
to assess weight.
Weight (cont’d)
Weight (cont’d)
 Weight for age is an index used in growth monitoring for assessing
children who may be underweight.
 Weight for age =
weight of the child
weight of the reference child of same age
*100
 Weight for height is an index used for assessing wasting (acute
malnutrition).
 Weight for height =
weight of the child
weight of the normal child at same height
*100
Weight (cont’d)
Mean weight (kg) Mean height( cm)
Boys Girls Boys Girls
1 year 9.5 8.7 73.4 72.1
2 years 11.7 10.6 84.5 82.1
3 years 13.6 12.6 92.7 90.0
4 years 14.9 14.3 98.1 98.0
5 years 17.0 16.0 106.7 104.4
Weight (cont’d)
Index Cut off value based on SD/ % Indicates
Weight for age <-2 to >=-3 Moderate underweight
Weight for age <-3 Severe underweight
Height for age <-2 to >= -3/70-79.99% of the normal Moderate acute malnutrition
Height for age <-3/<70% of the normal or bilateral pitting
edema
Severe acute malnutrition
Indicators of underweight and malnutrition derived from the
weight and height of children relative to their age.
Mid Upper Arm Circumference
The mid-upper arm circumference( MUAC) is the circumference
of the upper arm at the midway between the shoulder tip and
the elbow tip on the left arm.
It cannot be used before the age of one year.
Used for screening target children for moderate and severe acute
malnutrition.
A special tape “Shakir’s tape” is used for measuring the MUAC.
Mid Upper Arm Circumference (cont’d)
Results are interpreted as:
MUAC (in cm) Colour Code Interpretation
<11.5 Red Severe malnutrition
11.6-12.4 Yellow Mild moderate
malnutrition
>12.5 Green Normal nutritional status
Mid Upper Arm Circumference (cont’d)
Head Circumference
It is useful in assessing chronic nutritional problems in
children under 2 years old as the brain grows faster during
the first 2 years of life.
But after 2 years the growth of brain is more sluggish and
head circumference is not useful.
Current Status of Malnutrition in Nepal
(NDHS 2016)
Underweight 27%
Wasting 10%
Stunting 36%
Anthropometric Measurements
for
Pregnancy
Pregnancy
During pregnancy following measurements are made at the
time of woman’s first contact with health care system
Height
Weight
Mid upper arm circumference
Weight for height
Pregnancy (cont’d)
Body mass index (BMI)
Preeclampsia is a major cause of maternal death and
morbidity. Body mass index (BMI) predicts an increased risk of
developing hypertensive disorders and preeclampsia.
Pregnancy (cont’d)
Waist circumference
Pregnancy (cont’d)
Hip circumference
Pregnancy (cont’d)
The waist-hip ratio or waist-to-hip ratio (WHR) is the
dimensionless ratio of the circumference of the waist to that
of the hips. This is calculated as waist measurement divided
by hip measurement (W ÷ H).
Anthropometric Measurements
for
Adolescence
Adolescence
Anthropometric measurements are very important in
adolescents as maximum increase in height and weight occur
in this period.
The growth spurt begins earlier in girls usually between age
9.5 to 14.5 years and in boys at 10.5 to 16.5 year.
Adolescence (cont’d)
Common anthropometric measurements in adolescents are:
Height
• Average height a boy gains during this period is 10-30 cm
and average height gained by girls is 5-20 cm.
• The diagnostic criteria for defining stunting in adolescence is
height for age less than third percentile of NCHS/WHO
reference data.
Adolescence (cont’d)
Weight
• The average weight gain in boys is 7-30 kg in boys and 7-25
kg in girls.
• Under nutrition is characterized by low weight and obesity is
characterized by over weight in this period.
Adolescence (cont’d)
BMI (Basal Metabolic Index)
• A BMI lesser than 5th percentile indicates under nutrition or
thinness and more than 85th percentile indicates obesity.
Anthropometric Measurements
for
Elderly
Elderly
Anthropometric measurement is an important component of
nutritional assessment in the elderly.
The anthropometric standards derived from adult
populations may not be appropriate for the elderly because
of body composition changes that occurs during ageing.
Specific anthropometric reference data for the elderly are
necessary.
Elderly (cont’d)
Weight and height significantly decreased with age.
BMI is significantly higher in women than in men but lower
in the elderly than in the young people
According to BMI values, the prevalence of malnutrition is
lower than 5 % in both genders, whereas obesity is shown to
have a higher prevalence in women than in men.
Elderly (cont’d)
 Waist circumference and waist hip ratio
• It decreases with age in men, but increases higher in old
women, suggesting that visceral redistribution in old age
predominantly affects females.
• Elderly people show a thinner body frame than the young
people of both genders
• There is a more marked fat redistribution in women than in
men.
References
Adhikari,T.(2015).Essentials of Pediatric Nursing(2nd edition). Bhotahity, Kathmandu: Vidhyarthi
Pustak Bhandar
Park,K.(2007).Park’s Textbook of Preventive and Social Medicine(18th edition). Jabalpur, India: M/S
Banarsidas Bhanot
Ministry of Health - MOH/Nepal, New ERA/Nepal, and ICF. 2017. Nepal Demographic and Health
Survey 2016. Kathmandu, Nepal: MOH/Nepal, New ERA, and ICF. Retrieved from
http://dhsprogram.com/pubs/pdf/FR336/FR336.pd on 2020/07/22.
NEPAL Integrated Management of Acute Malnutrition (IMAM) Guideline Retrieved from
https://km.mohp.gov.np/document/nepal-integrated-management-of-acute-malnutrition-imam-
guideline on 2020/07/22.
(1995) Physical Status: The Use and Interpretation of Anthropometry - Report of a WHO Expert
Committee. WHO Retrieved from http://helid.digicollection.org/en/d/Jh0211e/5.2.2.html on
2020/07/22
Perissinotto,E., Pisent, C., Sergi, G., Grigoletto, F.,& ILSA Working Group (Italian Longitudinal Study
on Ageing) (2002).Anthropometry measurements in the elderly: age and gender differences. The
British Journal of Nutrition,87(2), 177186.https://doi.org/10.1079/bjn2001487 Retrieved from
https://pubmed.ncbi.nlm.nih.gov/11895170/ on 2020/07/22.
Thank You

Anthropometry measurement

  • 1.
  • 2.
    Introduction Anthropometry = anthropo+ metry  Anthropo means ‘human’ and metry means ‘measurement’. It is the measurement of physical dimensions such as the fat mass, composition of human body. It is a convenient and reliable technique whereby changes in the nutritional status can be evaluated easily.
  • 3.
    Introduction (cont’d) Anthropometric measurementsare now regarded as important indicators of an individual’s nutritional status which are given below: • Height/ length • Weight • Mid-arm circumference • Head circumference
  • 4.
    Introduction (cont’d) • Chestcircumference • Triceps skin fold thickness • Waist-hip ratio • Body mass index • Abdominal girth
  • 5.
  • 6.
    Head Circumference  Routinelymeasured until 5 years of age.  Measured by placing the tape over the occipital protuberance at the back and just over the supraorbital ridge and the glabella in front.
  • 7.
    Head Circumference (cont’d) AgeHead circumference (cm) At birth 33-35 2 months 38 3 months 40 4 months 41 6 months 42-43 1 year 45-46 2 years 47-48 5 years 50-51 Expected Head Circumference in Children
  • 8.
    Chest Circumference Usually measuredat the level of nipples. In children •<=5 years: lying down position •>5 years: standing position
  • 9.
    Chest Circumference (cont’d) Atbirth head circumference is more than chest circumference by up to 3 cm. At around 9 months to 1 year of age head circumference is equal to chest circumference but there after chest grows more rapidly compared to the brain.
  • 10.
    Chest Circumference (cont’d) Thehead circumference is greater than chest circumference by more than 3 cm in: • preterm • small for date and • hydrocephalus infants
  • 11.
    Chest Circumference (cont’d) Inmalnourished children chest size may be significantly smaller than head circumference because growth of brain is less affected by undernutrition. Therefore there will be considerable delay before chest circumference overtakes head circumference.
  • 12.
    Weight The measurement ofweight is most reliable criteria of assessment of health and nutritional status of children. The periodic recording of weight on a growth chart is essential for monitoring the growth of under five children.
  • 13.
    Weight (cont’d) Birth weightis double at 4-5 months and triple at 1 year of age. Weight measurement help to identify acute malnutrition and it is measured in kilogram Standard calibrated weighing machine (saltier scale) used for weighing the child. Machine can weight one to 25 kg.
  • 14.
    Weight (cont’d) Weight forAge Grade of Malnutrition >80% Normal 71-80% Grade 1 (Mild) 61-70% Grade 2 (Moderate) 51-60% Grade 3 (severe) <50% Grade 4 (very severe) Classification of Malnutrition by Indian Academy of Pediatrics
  • 15.
    Length or Height Up to 2 years of age recumbent length is measured with the help of an Infantometer.  Normal length of child at birth is 50 cm and 25 cm length is increase during 1 year of age.
  • 16.
    Length or Height(cont’d) Age Approximate Rate of Increase in Stature Birth to 3 months 3.5 cm/month 3-6 months 2.0 cm/month 6-9 months 1.5 cm/month 9-12 months 1.3 cm/month Height Velocity
  • 17.
  • 18.
    Height  Height isthe distance from the bottom of the feet to the top of the head in a human body standing erect which is stable measurement of growth. It is measured in child and adults too in which either a stadiometer or portable anthropometer is used. Measurements are recorded to the nearest millimeter.
  • 19.
  • 20.
    Height (cont’d) Height forage is an index used for assessing stunting (chronic malnutrition in children). Stunting is defined as low height for age of child as compared to the standard child of the same age. Stunting has direct effect in linear growth.
  • 21.
    Weight Weight for ageis most sensitive and best method for assessing physical growth and nutritional status of children. Growth should be monitored every month for up to the age of 24 months using a weighing sling known as “Saltar Scale”. For children above 2 years digital weighing machine can be used to assess weight.
  • 22.
  • 23.
    Weight (cont’d)  Weightfor age is an index used in growth monitoring for assessing children who may be underweight.  Weight for age = weight of the child weight of the reference child of same age *100  Weight for height is an index used for assessing wasting (acute malnutrition).  Weight for height = weight of the child weight of the normal child at same height *100
  • 24.
    Weight (cont’d) Mean weight(kg) Mean height( cm) Boys Girls Boys Girls 1 year 9.5 8.7 73.4 72.1 2 years 11.7 10.6 84.5 82.1 3 years 13.6 12.6 92.7 90.0 4 years 14.9 14.3 98.1 98.0 5 years 17.0 16.0 106.7 104.4
  • 25.
    Weight (cont’d) Index Cutoff value based on SD/ % Indicates Weight for age <-2 to >=-3 Moderate underweight Weight for age <-3 Severe underweight Height for age <-2 to >= -3/70-79.99% of the normal Moderate acute malnutrition Height for age <-3/<70% of the normal or bilateral pitting edema Severe acute malnutrition Indicators of underweight and malnutrition derived from the weight and height of children relative to their age.
  • 26.
    Mid Upper ArmCircumference The mid-upper arm circumference( MUAC) is the circumference of the upper arm at the midway between the shoulder tip and the elbow tip on the left arm. It cannot be used before the age of one year. Used for screening target children for moderate and severe acute malnutrition. A special tape “Shakir’s tape” is used for measuring the MUAC.
  • 27.
    Mid Upper ArmCircumference (cont’d) Results are interpreted as: MUAC (in cm) Colour Code Interpretation <11.5 Red Severe malnutrition 11.6-12.4 Yellow Mild moderate malnutrition >12.5 Green Normal nutritional status
  • 28.
    Mid Upper ArmCircumference (cont’d)
  • 29.
    Head Circumference It isuseful in assessing chronic nutritional problems in children under 2 years old as the brain grows faster during the first 2 years of life. But after 2 years the growth of brain is more sluggish and head circumference is not useful.
  • 30.
    Current Status ofMalnutrition in Nepal (NDHS 2016) Underweight 27% Wasting 10% Stunting 36%
  • 31.
  • 32.
    Pregnancy During pregnancy followingmeasurements are made at the time of woman’s first contact with health care system Height Weight Mid upper arm circumference Weight for height
  • 33.
    Pregnancy (cont’d) Body massindex (BMI) Preeclampsia is a major cause of maternal death and morbidity. Body mass index (BMI) predicts an increased risk of developing hypertensive disorders and preeclampsia.
  • 34.
  • 35.
  • 36.
    Pregnancy (cont’d) The waist-hipratio or waist-to-hip ratio (WHR) is the dimensionless ratio of the circumference of the waist to that of the hips. This is calculated as waist measurement divided by hip measurement (W ÷ H).
  • 37.
  • 38.
    Adolescence Anthropometric measurements arevery important in adolescents as maximum increase in height and weight occur in this period. The growth spurt begins earlier in girls usually between age 9.5 to 14.5 years and in boys at 10.5 to 16.5 year.
  • 39.
    Adolescence (cont’d) Common anthropometricmeasurements in adolescents are: Height • Average height a boy gains during this period is 10-30 cm and average height gained by girls is 5-20 cm. • The diagnostic criteria for defining stunting in adolescence is height for age less than third percentile of NCHS/WHO reference data.
  • 40.
    Adolescence (cont’d) Weight • Theaverage weight gain in boys is 7-30 kg in boys and 7-25 kg in girls. • Under nutrition is characterized by low weight and obesity is characterized by over weight in this period.
  • 41.
    Adolescence (cont’d) BMI (BasalMetabolic Index) • A BMI lesser than 5th percentile indicates under nutrition or thinness and more than 85th percentile indicates obesity.
  • 42.
  • 43.
    Elderly Anthropometric measurement isan important component of nutritional assessment in the elderly. The anthropometric standards derived from adult populations may not be appropriate for the elderly because of body composition changes that occurs during ageing. Specific anthropometric reference data for the elderly are necessary.
  • 44.
    Elderly (cont’d) Weight andheight significantly decreased with age. BMI is significantly higher in women than in men but lower in the elderly than in the young people According to BMI values, the prevalence of malnutrition is lower than 5 % in both genders, whereas obesity is shown to have a higher prevalence in women than in men.
  • 45.
    Elderly (cont’d)  Waistcircumference and waist hip ratio • It decreases with age in men, but increases higher in old women, suggesting that visceral redistribution in old age predominantly affects females. • Elderly people show a thinner body frame than the young people of both genders • There is a more marked fat redistribution in women than in men.
  • 46.
    References Adhikari,T.(2015).Essentials of PediatricNursing(2nd edition). Bhotahity, Kathmandu: Vidhyarthi Pustak Bhandar Park,K.(2007).Park’s Textbook of Preventive and Social Medicine(18th edition). Jabalpur, India: M/S Banarsidas Bhanot Ministry of Health - MOH/Nepal, New ERA/Nepal, and ICF. 2017. Nepal Demographic and Health Survey 2016. Kathmandu, Nepal: MOH/Nepal, New ERA, and ICF. Retrieved from http://dhsprogram.com/pubs/pdf/FR336/FR336.pd on 2020/07/22. NEPAL Integrated Management of Acute Malnutrition (IMAM) Guideline Retrieved from https://km.mohp.gov.np/document/nepal-integrated-management-of-acute-malnutrition-imam- guideline on 2020/07/22. (1995) Physical Status: The Use and Interpretation of Anthropometry - Report of a WHO Expert Committee. WHO Retrieved from http://helid.digicollection.org/en/d/Jh0211e/5.2.2.html on 2020/07/22 Perissinotto,E., Pisent, C., Sergi, G., Grigoletto, F.,& ILSA Working Group (Italian Longitudinal Study on Ageing) (2002).Anthropometry measurements in the elderly: age and gender differences. The British Journal of Nutrition,87(2), 177186.https://doi.org/10.1079/bjn2001487 Retrieved from https://pubmed.ncbi.nlm.nih.gov/11895170/ on 2020/07/22.
  • 47.