
More Related Content
What's hot
What's hot (20)
Viewers also liked
Similar to Pc12 sol c03_ptest
Similar to Pc12 sol c03_ptest (20)
More from Garden City
More from Garden City (20)
Pc12 sol c03_ptest
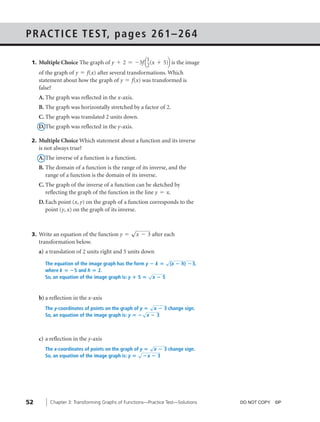
- 1. 04_ch03b_pre-calculas12_wncp_solution.qxd 5/17/12 7:49 PM Page 52 Home Quit P R AC T I C E T E S T, p a g e s 2 6 1 – 2 6 4 1. Multiple Choice The graph of y + 2 = -3f a2(x + 5)b is the image 1 of the graph of y = f(x) after several transformations. Which statement about how the graph of y = f(x) was transformed is false? A. The graph was reflected in the x-axis. B. The graph was horizontally stretched by a factor of 2. C. The graph was translated 2 units down. D. The graph was reflected in the y-axis. 2. Multiple Choice Which statement about a function and its inverse is not always true? A. The inverse of a function is a function. B. The domain of a function is the range of its inverse, and the range of a function is the domain of its inverse. C. The graph of the inverse of a function can be sketched by reflecting the graph of the function in the line y = x. D. Each point (x, y) on the graph of a function corresponds to the point (y, x) on the graph of its inverse. √ 3. Write an equation of the function y = x - 3 after each transformation below. a) a translation of 2 units right and 5 units down √ The equation of the image graph has the form y ؊ k ( ؍x ؊ h) ؊3, where k 5؊ ؍and h .2 ؍ √ So, an equation of the image graph is: y ؉ 5 ؍x ؊ 5 b) a reflection in the x-axis √ The y-coordinates of points on the graph of y ؍x ؊ 3 change sign. √ So, an equation of the image graph is: y ؊ ؍x ؊ 3 c) a reflection in the y-axis √ The x-coordinates of points on the graph of y ؍x ؊ 3 change sign. √ So, an equation of the image graph is: y ؊ ؍x ؊ 3 52 Chapter 3: Transforming Graphs of Functions—Practice Test—Solutions DO NOT COPY. ©P
- 2. 04_ch03b_pre-calculas12_wncp_solution.qxd 5/17/12 7:49 PM Page 53 Home Quit d) a vertical stretch by a factor of 2 and a horizontal compression by 1 a factor of 3 √ The equation of the image graph has the form y ؍a bx ؊ 3, where a 2 ؍and b .3 ؍ √ So, an equation of the image graph is: y 3 2 ؍x ؊ 3 4. Here is the graph of y = f(x). y y ϭ f(x) On the same grid, use 4 transformations to sketch the 2 graph of y - 5 = -3f(2x). x Describe the transformations. Ϫ4 Ϫ2 0 2 4 Compare: y ؊ k ؍af (b(x ؊ h)) to Ϫ2 y Ϫ 5 ϭ Ϫ3f(2x ) y ؊ 5 3؊ ؍f(2x) Ϫ4 k ,5 ؍a ,3؊ ؍b ,2 ؍and h 0 ؍ A point (x, y) on y ؍f(x) corresponds Ϫ6 to the point a ؉ h, ay ؉ kb on x b y ؊ k ؍af (b(x ؊ h)). Substitute the values above. A point on y ؊ 5 3؊ ؍f(2x) has coordinates a , ؊3y ؉ 5b . x 2 Transform some points on the lines. Point on Point on y ؍f(x) y ؊ 5 3؊ ؍f(2x) (؊4, 4) (؊2, ؊7) (0, 0) (0, 5) (4, 4) (2, ؊7) Draw 2 lines through the points for the graph of y ؊ 5 3؊ ؍f(2x). 1 The graph of y ؍f(x) was compressed horizontally by a factor of , 2 stretched vertically by a factor of 3, reflected in the x-axis, then translated 5 units up. ©P DO NOT COPY. Chapter 3: Transforming Graphs of Functions—Practice Test—Solutions 53
- 3. 04_ch03b_pre-calculas12_wncp_solution.qxd 5/17/12 7:49 PM Page 54 Home Quit √ 5. Here is the graph of y = x. √1 a) Use this graph to sketch a graph of y - 1 = -2 2(x - 4). y √ yϭ x 2 x 0 2 4 6 8 10 Ϫ2 Ί1 y Ϫ 1 ϭ Ϫ2 2 (x Ϫ 4) Compare: y ؊ k ؍af (b(x ؊ h)) to √1 y ؊ 1 2؊ ؍ (x ؊ 4) 2 1 k ,1 ؍a ,2؊ ؍b , ؍and h 4 ؍ 2 A point (x, y) on y ؍f(x) corresponds to the point a ؉ h, ay ؉ kb x b on y ؊ k ؍af (b(x ؊ h)). Substitute the values above. √1 A point on y ؊ 1 2؊ ؍ (x ؊ 4) has coordinates: (2x ؉ 4, ؊2y ؉ 1) 2 √ Transform some points on y ؍x. Point on √ Point on √1 y ؍x y ؊ 1 2؊ ؍ (x ؊ 4) 2 (0, 0) (4, 1) (1, 1) (6, ؊1) (4, 2) (12, ؊3) √1 Join the points with a smooth curve for the graph of y ؊ 1 2؊ ؍ (x ؊ 4). 2 b) Write the domain and range of the function in part a. From the graph, the domain is x » 4; and the range is y ◊ 1. 54 Chapter 3: Transforming Graphs of Functions—Practice Test—Solutions DO NOT COPY. ©P
- 4. 04_ch03b_pre-calculas12_wncp_solution.qxd 5/17/12 7:49 PM Page 55 Home Quit 6. a) Determine an equation of the inverse of y = (x - 4)2 + 5. Interchange x and y in the equation. x ( ؍y ؊ 4)2 ؉ 5 Solve for y. (y ؊ 4)2 ؍x ؊ 5 √ y؊4 —؍x؊5 √ y —؍x؊5؉4 b) Sketch the graph of the inverse. Is the inverse a function? Explain. y y ϭ (x Ϫ 4)2 ϩ5 8 √ y ϭ x Ϫ5ϩ4 6 4 2 √ y ϭϪ x Ϫ5ϩ4 x 0 2 4 6 8 Graph y ( ؍x ؊ 4)2 ؉ 5. This is the graph of y ؍x2 after a translation of 4 units right and 5 units up. Interchange the coordinates of points on this graph, then plot the new √ points to get the graph of y — ؍x ؊ 5 ؉ 4. No, the inverse is not a function because its graph does not pass the vertical line test. c) If your answer to part b is yes, explain how you know. If your answer to part b is no, determine a possible restriction on the domain of y = (x - 4)2 + 5 so its inverse is a function, then write the equation of the inverse function. The domain can be restricted by considering each part of the graph of y ( ؍x ؊ 4)2 ؉ 5 to the right and left of the vertex. So, one restriction is x » 4 and the equation of the inverse function is: √ y ؍x؊5؉4 Another restriction is x ◊ 4 and the equation of the inverse function √ is: y ؊ ؍x ؊ 5 ؉ 4 ©P DO NOT COPY. Chapter 3: Transforming Graphs of Functions—Practice Test—Solutions 55