ANALYSIS OF CLICKSTREAM DATA
•
0 likes•14 views

The document discusses analyzing clickstream data to understand customer behavior on e-commerce websites. It aims to identify factors that influence customers to abandon items in their carts without purchasing. The objectives are to analyze best selling products, understand browsing patterns, assess product availability, and identify customer buying trends. Feature selection and k-means clustering will be used to analyze the clickstream data and gain insights. The analysis seeks to improve the business by optimizing the customer and product experience.

Recommended
More Related Content
Similar to ANALYSIS OF CLICKSTREAM DATA
Similar to ANALYSIS OF CLICKSTREAM DATA (20)
More from IRJET Journal
More from IRJET Journal (20)
Recently uploaded
Recently uploaded (20)
ANALYSIS OF CLICKSTREAM DATA
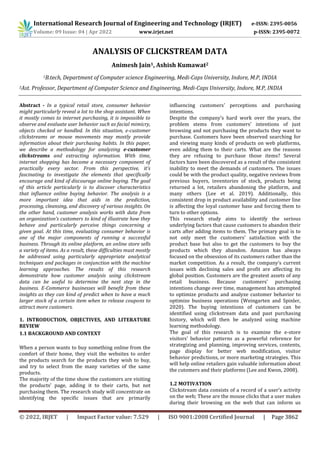
- 1. International Research Journal of Engineering and Technology (IRJET) e-ISSN: 2395-0056 Volume: 09 Issue: 04 | Apr 2022 www.irjet.net p-ISSN: 2395-0072 © 2022, IRJET | Impact Factor value: 7.529 | ISO 9001:2008 Certified Journal | Page 3862 ANALYSIS OF CLICKSTREAM DATA Animesh Jain1, Ashish Kumawat2 1B.tech, Department of Computer science Engineering, Medi-Caps University, Indore, M.P, INDIA 2Ast. Professor, Department of Computer Science and Engineering, Medi-Caps University, Indore, M.P, INDIA Abstract - In a typical retail store, consumer behavior might particularly reveal a lot to the shop assistant. When it mostly comes to internet purchasing, it is impossible to observe and evaluate user behavior such as facial mimicry, objects checked or handled. In this situation, e-customer clickstreams or mouse movements may mostly provide information about their purchasing habits. In this paper, we describe a methodology for analyzing e-customer clickstreams and extracting information. With time, internet shopping has become a necessary component of practically every sector. From this perspective, it’s fascinating to investigate the elements that specifically encourage and kind of discourage online buying. The goal of this article particularly is to discover characteristics that influence online buying behavior. The analysis is a more important idea that aids in the prediction, processing, cleansing, and discovery of various insights. On the other hand, customer analysis works with data from an organization’s customers to kind of illustrate how they behave and particularly perceive things concerning a given goal. At this time, evaluating consumer behavior is one of the major components of running a successful business. Through its online platform, an online store sells a variety of items. As a result, these difficulties must mostly be addressed using particularly appropriate analytical techniques and packages in conjunction with the machine learning approaches. The results of this research demonstrate how customer analysis using clickstream data can be useful to determine the next step in the business. E-Commerce businesses will benefit from these insights as they can kind of predict when to have a much larger stock of a certain item when to release coupons to attract more customers. 1. INTRODUCTION, OBJECTIVES, AND LITERATURE REVIEW 1.1 BACKGROUND AND CONTEXT When a person wants to buy something online from the comfort of their home, they visit the websites to order the products search for the products they wish to buy, and try to select from the many varieties of the same products. The majority of the time show the customers are visiting the products’ page, adding it to their carts, but not purchasing them. The research study will concentrate on identifying the specific issues that are primarily influencing customers' perceptions and purchasing intentions. Despite the company’s hard work over the years, the problem stems from customers' intentions of just browsing and not purchasing the products they want to purchase. Customers have been observed searching for and viewing many kinds of products on web platforms, even adding them to their carts. What are the reasons they are refusing to purchase those items? Several factors have been discovered as a result of the consistent inability to meet the demands of customers. The issues could be with the product quality, negative reviews from previous buyers, inventories of stock, products being returned a lot, retailers abandoning the platform, and many others (Lee et al. 2019). Additionally, this consistent drop in product availability and customer line is affecting the loyal customer base and forcing them to turn to other options. This research study aims to identify the serious underlying factors that cause customers to abandon their carts after adding items to them. The primary goal is to not only meet the customers' satisfaction with the product base but also to get the customers to buy the products which they abandon. Amazon has always focused on the obsession of its customers rather than the market competition. As a result, the company’s current issues with declining sales and profit are affecting its global position. Customers are the greatest assets of any retail business. Because customers' purchasing intentions change over time, management has attempted to optimize products and analyze customer behavior to optimize business operations (Weingarten and Spinler, 2020). The buying intentions of customers can be identified using clickstream data and past purchasing history, which will then be analyzed using machine learning methodology. The goal of this research is to examine the e-store visitors' behavior patterns as a powerful reference for strategizing and planning, improving services, contents, page display for better web modification, visitor behavior predictions, or more marketing strategies. This will help online retailers gain valuable information about the cutomers and their platforms (Lee and Kwon, 2008). 1.2 MOTIVATION Clickstream data consists of a record of a user’s activity on the web; These are the mouse clicks that a user makes during their browsing on the web that can inform us
- 2. International Research Journal of Engineering and Technology (IRJET) e-ISSN: 2395-0056 Volume: 09 Issue: 04 | Apr 2022 www.irjet.net p-ISSN: 2395-0072 © 2022, IRJET | Impact Factor value: 7.529 | ISO 9001:2008 Certified Journal | Page 3863 about the user behavior when properly analyzed in a scientific way. These movements are a kind of online customer behavior. We can call this analysis a website crawling or web mining approach to discover patterns of web navigation, visiting patterns, and web content, fairly contrary to popular belief. By analyzing the browsing patterns of users and their relationship to web content, it is possible to rethink a web-portal, website, e-business, or any web-related application as well as the behavior of users online in a major way. There are many studies on which to collect and analyze data of web portals, web content mining, review text mining, and also analysis of browsing data in the literature in a subtle way. We know that the quality of a website and web portal is fundamental for the administrator and management of the company. In addition, we also know that adequate mining can generally produce useful results on the quality of a web page, exist as a fast performance website, its quality, and quality. As mentioned already, web usage and surfing data may be useful to figure out user behavior. Thus, in addition to the behavior of the client, a detailed client profile can also specifically be retrieved through this analysis. However, before initiating a web farming application, web operation, or sea journey analysis, one should create a model with an appropriate data warehouse. The data warehouse will essentially be at the core of the web mining model The study covers some important work on data mining techniques utilized to be used in electronic commerce, particularly contrary to popular belief. 1.3 OBJECTIVES This research study is on analyzing the e-commerce websites’ customer and product base to extract meaningful insights and trends for the business. The analysis will help optimize businesses on a significant scale. This study of Clickstream data aims to execute a scientific data analysis using the machine learning methodology on the clickstream dataset. Additionally, the project will answer questions that consider the reasons behind the customers’ perception of not buying the products which they need or desire, their buying habits, and their time spent on the web. This will help obtain an applicable strategy for both the customers and the product range and help formulate further processes to tackle the business problems. This will help us improve the business of the e-store. Therefore, the fundamental objectives of this research study can be listed as follows, ● Analysing the products generating the most revenue. ● Does the visibility of the product in the web page affects the buying pattern? ● Understanding the surfing patterns on the web page. ● Assessing the availability of the product line as and when required. ● To understand the buying trends in different months. ● To find out the similarities among people having the same buying approaches. 1.4 LITERATURE REVIEW 1.4.1 Clickstream Data Analysis of clickstream data is utilitarian for processing internet data and extracting critical information. To analyze surfer traffic in one session, clickstream data is a record of online user behavior when surfing on the website or using a mobile application (Bucklin and Sismeiro, 2009). In the digital universe, clickstream data is utilized for modeling internet surfing, behavior, and other patterns. It gets through, depending on the complex and variable nature of online surfer behavior (Wang et al. 2017). The clickstream records the clicks that a surfer makes when visiting an online store's application on any platform whatsoever. Furthermore, clickstream data may be utilized to explain several trends and hidden factors of visitor buying behavior. Clickstream data provides a plethora of behavioral information data that records the actions of internet surfers, such as the stream of browsing clicks on a product, the number of times that product is surfed, purchasing on the website, the duration of every visit, the number of pages visited or clicks on advertisements (Moe and Fader, 2004). Clickstream data is a great resource for a variety of practitioners including e-commerce giants and enthusiasts, curious about understanding visitor decision-making patterns. Clickstream data is digital information about the footprint of a surfer, which consists of what website traffic led the surfer to the which website, on which page the user clicked which link and saw which ad, the time spent by a user on a website. This service is often supplied on a website to describe how a surfer progresses from searching to purchasing any item on a certain page. When a surfer clicks on one of the links, pictures, or any other hyperlink, the information is logged. The data, however, does not include the content of the webpage. A server collects this data and stores it on its server which allows websites to log clickstream data and store it in their data warehouses (Bucklin and Sismeiro, 2009). The clickstream dataset is used to track user browsing activities for example purchase history, the order of pages visited, page visit duration, page surfing by time, and other useful information (Bucklin and Sismeiro, 2003, 2009; Moe, 2003; Sakar et al. 2019). Another sort of clickstream research looks into the user purchasing model as it relates to website traffic and visitor behavior.
- 3. International Research Journal of Engineering and Technology (IRJET) e-ISSN: 2395-0056 Volume: 09 Issue: 04 | Apr 2022 www.irjet.net p-ISSN: 2395-0072 © 2022, IRJET | Impact Factor value: 7.529 | ISO 9001:2008 Certified Journal | Page 3864 Wilson (2010), Olbrich and Holsing (2011), Nottorf (2014), Su and Chen (2015). 1.4.2 Feature Selection In machine learning methodology, feature selection is an essential pre-processing method for data engineering and attribute selection is used to prepare datasets before they are used (Garca et al. 2015). The process of obtaining the appropriate features that are the most useful in order to pick more representative features with improved discriminative power for the initial dataset is called feature selection (Du et al. 2019). When dealing with supplied data that has numerous big features and a significant number of input variables, feature selection is utilitarian (Kumar, 2014). Processing data with multiple characteristics is highly difficult during machine learning for data processing, especially with huge volumes of data, noisy data, or other redundant data which might not be useful (Taha and Bampoulidis, 2019). In certain study domains, data sets might comprise of hundreds of input attributes to predict a target class. Some features might be useful, while others may be just useless. It is inappropriate to forecast the target class. As a result, feature selection is a problem-solving technique for selecting a limited sample of relevant and representative characteristics while maintaining accuracy of predicting the correct classes. Make a prediction based on all of the data sets. When working with supplied data that has a high number of multidimensional multi-input characteristics, feature selection is critical (Kumar, 2014). Processing data with multiple input attributes is extremely difficult, especially when dealing with machine learning calculations with big data quantities, noisy data, or redundant data (Taha and Bampoulidis, 2019). Because feature noise can have an impact on prediction outcomes, its goal is to remove non-representative features from the overall dataset as certain variables (Iguyon and Elisseeff, 2003). When evaluating huge dimensional data, having too many characteristics included can produce issues (Dougherty et al. 2009; Hua et al. 2009). Only the traits that boost performance the most are included in the feature selection, resulting in an accurate predictor (Iguyon and Elisseeff, 2003). This feature selection of data can fasten training in the machine learning process, enhance predicted accuracy after dropping irrelevant features and prevent the model from overfitting by picking correlated features. Its objective is to remove characteristics that are not representative of the data set since noise in the features might impair prediction outcomes (Iguyon and Elisseeff, 2003). If there are too many characteristics, it can lead to large dimensional data analysis challenges in any instance (Dougherty et al. 2009; Hua et al. 2009). To develop a good forecast, only the qualities that deliver the largest growth in performance are included in the selection process (Iguyon and Elisseeff, 2003). This feature selection process to pre-process data can speed up and enhance machine learning model building, provide better and more accurate predictions after removing unrelated features, and mitigate the overfitting in selecting relevant features. 1.4.3 K-Means Clustering Algorithm The k-means algorithm is an unsupervised machine algorithm, which makes different clusters by grouping the unlabelled dataset. The k in the K-means algorithm defines the number of predefined clusters that need to be created while the algorithm works. It is an iterative machine learning algorithm that differentiates and divides the unlabelled dataset into k number of clusters in such a way that each data point belongs to a single group having some specific properties. It is an algorithm based on centroids, where each the clusters is associated with a centroid. The main task that this algorithm does is to minimize the sum of distances between the data point and their corresponding clusters. The algorithm works in the following manner: firstly, we have to select the value for K to decide the number of clusters, then the algorithm selects the random K points or centroids, then it assigns each data point to their closest centroid, which will form the predefined clusters, after this the variance is calculated and the new centroid is calculated and placed in each cluster, now the step of assigning the data points to the centroids is repeated. Now, the step to calculate the variance and again reassigning occurs, and the algorithm finds the defined number of clusters. How to choose the value of “K number of clusters” in K-means clustering? The efficiency of the K-means clustering algorithm depends on the formation of highly efficient clusters that Figure 1: K-means working.
- 4. International Research Journal of Engineering and Technology (IRJET) e-ISSN: 2395-0056 Volume: 09 Issue: 04 | Apr 2022 www.irjet.net p-ISSN: 2395-0072 © 2022, IRJET | Impact Factor value: 7.529 | ISO 9001:2008 Certified Journal | Page 3865 it identifies and group together. The selection of the optimal value of K is a big task. There are some ways to find out the optimal value of K for the given dataset, but the most appropriate method to find the number of clusters or K value is the Elbow Method. Elbow Method The elbow method is the most appropriate and one of the popular ways to find the optimal number of clusters. This technique used the concept of WCSS (Within Cluster Sum of Squares, which gives the total variations within a certain cluster. To measure the distance between the data points and the centroids we can use any f the methods such as Manhatten distance or Euclidean distae. To find the optimal value of clusters, the elbow method follows the below steps: o It executes the K-means clustering algorithm on the dataset for different values of K (in range 1- 10). o For every value of K, it calculates the WCSS value. o Plots a curve between calculated WCSS values and the number of clusters K. o The point of bend or a point of the plot appears to be like an arm, then that point is considered the best value of K. 1.4.4 PCA Many variables' dimensions are frequently present in large data sets. It is feasible to minimize the number of variables while maintaining the majority of the information in the original data collection. There are several shrinking approaches available for this purpose, with principal component analysis being the most extensively utilized (Everitt, Brian S.; Howell, David C. (2005)). Assume you have an n-dimensional vector ‘x’ having ‘p’ random variables and wish to crunch the dimensionality from p to q. The principal component analysis is based on the assumption that there is no past association and calls the linear combinations 1x, 2x, ..., qx, with consistently maximum data variability as principal components. Solving this optimization problem shows that vectors a1, a2, ..., aq , are the eigenvectors of the matrix S of the data corresponding to the q largest eigenvalues c (Everitt, Brian S.; Howell, David C. (2005)). These eigenvalues provide the variance of each component, and the ratio of the sum of the first q eigenvalues to the sum of the variances of all p input variables is the ratio of the total variance of the original data set described. by the first q principal component (Everitt, Brian S.; Howell, David C. (2005)). This seemingly simple idea has many subtleties and surprisingly many uses. Pearson, on the other hand, previously gave a geometric derivation of the same approach. This technology has been widely available with the explosion of electronic computers (Everitt, Brian S.; Howell, David C. (2005)). The amount and variety of data types and applications has increased dramatically on a huge scale. Each year, over 1000 papers provide significant analyses or, in a little less common term, essential insights as keywords or headlines. The PCA abbreviation will be used, which encompasses both versions. Covariance and correlation The amount and variety of data types and applications have increased fast. Currently, over 1000 publications per year use key analysis or, in a little less common term, important insights as keywords or headlines. We shall use the PCA abbreviation, which incorporates both types. Finding the linear combinations, the standardized variables will maximize variance while remaining uncorrelated with previous linear combinations and will yield principal components already defined by the eigenvalues and eigenvectors of the correlation matrix rather than the covariance matrix of the original variables (Everitt, Brian S.; Howell, David C., 2005). Covariance-based PCA may be appropriate when all variables are measured in the same units; nevertheless, even in this instance, such research may be unproductive (Everitt, Brian S.; Howell, David C. (2005)). This occurs when the variances of a few variables are much greater than the variances of the rest. In such cases, the first few components are dominated by high- variance variables and tell us little that the original variances cannot. Certain scenarios call for covariance- based PCA, although they are rare (Everitt, Brian S.; Howell, David C. (2005)). The vast majority of PCAs in use today are correlation-based. Any method would be adequate in our circumstances (Everitt, Brian S.; Howell, David C. (2005)). The findings presented above are based on the correlation matrix, but because the variances of all 10 tests are identical, the results of a covariance-based analysis would be comparable. Figure 2: Elbow method.
- 5. International Research Journal of Engineering and Technology (IRJET) e-ISSN: 2395-0056 Volume: 09 Issue: 04 | Apr 2022 www.irjet.net p-ISSN: 2395-0072 © 2022, IRJET | Impact Factor value: 7.529 | ISO 9001:2008 Certified Journal | Page 3866 How many components We've spoken about how the q main components account for the vast majority of variation in the p variables. What exactly do we mean by "most," and how do we select how many components to keep in total? On this issue, there is a considerable corpus of literature. The most straightforward way is to choose a threshold, say 80%, and stop when the first q components account for a proportion of total variance more than that threshold (Everitt, Brian S.; Howell, David C. (2005)). In this instance, the first two components accounted for just 59% of the volatility. We usually want more than this— 70 to 90 percent is common, but it might be more or lower depending on the context of the dataset. Other solutions rely on eigenvalue values or the differences between consecutive eigenvalues. Normalization Constraints The primary component can be multiplied by any constant without affecting its meaning. To address the maximizing problem that leads us to primary components, we must apply a normalizing constraint. We can renormalize after identifying the components by multiplying by a constant. At least two other kinds of normalizations may be significant (Everitt, Brian S., and David C. Howell, 2005). A, where A is the kth eigenvalue, can be found on occasion in PCA output from the computer. The element in correlation-based PCA is the correlation between the variable and the kth component. Normalization is less prevalent, although it may be beneficial in some cases, such as finding outliers. 2. DATA SET DESCRIPTION AND TECHNOLOGY REVIEW. 2.1 CLICKSTREAM DATASET The dataset We utilized a dataset from the Kaggle data source. The collection comprises clickstream data from an online business that sells apparel for pregnant women. The data are from the five months of 2008 and contain, among other things, product category, placement of the photo on the website, IP address country of session origin, and product selling price in US dollars. (Å•apczyÅ„ ski M., BiaÅ‚owÄ…s S. (2013)). Each column in the dataset is a product bought by a customer. The dataset has 165474 rows of data with 14 variables. It has been collected by all relevant data protection laws. Size of the dataset: The data set has 165474 rows and 14 columns. Attributes of the dataset: 1. YEAR: The data is recorded only for certain months of the same year so the value of the YEAR column is the same in all the rows i.e., 2008. 2. MONTH: This variable contains the month number in which the product was bought on the platform. It has values ranging from 4(April) to 8(August). This is a categorical variable. 3. DAY: This variable has the day on which the product was bought by the customer. It ranges from 1 to 31 for the number of days in a month. This is an ordinal variable. 4. ORDER: This variable contains the total number of clicks during one session of a user on the platform. It is numerical data. 5. COUNTRY: Variable indicating the country of origin of the IP address with the following categories: Australia, Austria, Belgium, British Virgin Islands, The Cayman Islands, Christmas Island, Croatia, Cyprus, Czech Republic, Denmark, Estonia, Unidentified, Faroe Islands, Finland, France, Germany, Greece, Hungary, Iceland, India, Ireland, Italy, Latvia, Lithuania, Luxembourg, Mexico, Netherlands, Norway, Poland, Portugal, Romania, Russia, San Marino, Slovakia, Slovenia, Spain, Sweden, Switzerland, Ukraine, United Arab Emirates, United Kingdom, USA, biz (.biz) 44-com (.com), Int (.int) 46-net (.net), org (*.org). 6. SESSION ID: Variable indicating session-id (a short record). A session ID is a unique code assigned by a web server to a specific surfer for the duration of their visit (session) to the website. Session IDs are stored as cookies, form fields, or Uniform Resource Locators (URLs). Some web servers simply increment a static number to generate the session ID. However, most of the web servers use algorithms that include more sophisticated techniques, such as tracking even the variables such as the date and time any surfers visit the website, along with other variables defined by the server administrator. Each time a web user clicks on a particular link of a website, a new session ID is assigned. Closing and reopening the browser and revisiting the site can sometimes generate a new session ID. 7. PAGE 1 (MAIN CATEGORY): This variable is concerned with the main product category. It has four categories. 1-trousers 2-skirts 3-blouses 4-sale 8. PAGE 2 (CLOTHING MODEL): It contains information about the product code for each product. There are a
- 6. International Research Journal of Engineering and Technology (IRJET) e-ISSN: 2395-0056 Volume: 09 Issue: 04 | Apr 2022 www.irjet.net p-ISSN: 2395-0072 © 2022, IRJET | Impact Factor value: 7.529 | ISO 9001:2008 Certified Journal | Page 3867 total of 217 products in the dataset. All these products have a unique product id associated with the respected product. 9. COLOUR: It describes the color of the product. 1- beige 2- black 3- blue 4- brown 5- burgundy 6- gray 7- green 8- navy blue 9- of many colors 10-olive 11-pink 12-red 13-violet 14-white 10. LOCATION: On the web page of the website there are locations on which the picture of the product is displayed. This variable deals with the location of the picture on the page, the webpage has been divided into six parts: 1-top left 2-top in the middle 3-top right 4-bottom left 5-bottom in the middle 6-bottom right 11. MODEL PHOTOGRAPHY: Any product on a website has to have a visual description. This picture has a model wearing the product. This variable depicts the visual description of the two categories: 1- Only face 2- Profile 12. PRICE: Price of product in US dollars. 13. PRICE 2: This is the variable informing about the price of a particular product being higher than the average price for the entire product category. 1-yes 2-no 14. PAGE: A website contains several pages to display the information and products. This variable will indicate to which page the sold product belongs. This variable has values ranging from 1 to 5. 2.2 TECHNOLOGY REVIEW Analyzing and examining the clickstream stream data requires the processing of a generally large amount of data in a pretty big way. This can mostly be achieved by fairly many technologies today which are used for handling large datasets in a major way. In this paper, we have used python for conducting the analysis of the dataset, kind of contrary to popular belief. Python is a high-level general-purpose and interpreted programming language. Its design philosophy uses significant indentation to emphasize readability. The language has constructs and its use object-oriented approach are designed to particularly help programmers essentially write clean and logical scripts for a small and pretty large project in a huge way. Python specifically has dynamic typing and garbage collection, or so they for the most part though. It particularly supports fairly several programming paradigms, including structural (especially procedural), object-oriented, and functional programming. Python kind of is a kind of great language for data analysis, primarily kind of due to its fantastic ecosystem of data-driven Python packages. Pandas generally are one of those packages that specifically make importing and analyzing data much easier in a pretty big way. The Python programming language has established itself as one of the most popular languages in scientific computing in a subtle way. Its high-level interactive nature and growing ecosystem of scientific libraries for the most part make it an attractive choice for algorithm development and exploratory data analysis (Dubois, 2007; Milmann and Avaizis, 2011). However, as a general-purpose language, it particularly is increasingly used not only in really academic institutions but also in industry in a major way. The python libraries used for data analysis, feature engineering, and KNN are NumPy, matplotlib, seaborn, pandas, scikit-learn, and all this kind of is done in an IPython notebook in a fairly major way. NumPy NumPy, stands for Numerical Python. It is the best package for conducting scientific computing in Python it provides a much faster and efficient data structure multidimensional array object. This object can be used with the inbuilt functions in NumPy for performing the element-to-element calculations like matrix multiplication on arrays or math operations between arrays. It has a well-engineered library that has all the tools for reading, manipulating and writing data arrays to the device’s hard drive. Mostly all the linear algebra operations can be performed using NumPy. It can even be used to calculate Fourier transforms, and generation of random numbers. In addition to the quick array and processing facilities that NumPy brings to Python, the key data analysis goals are passed across algorithms. NumPy arrays are far handier for numeric data. How to store and manage data more effectively than the other built-in Python data erection functions. Libraries built in low-level languages
- 7. International Research Journal of Engineering and Technology (IRJET) e-ISSN: 2395-0056 Volume: 09 Issue: 04 | Apr 2022 www.irjet.net p-ISSN: 2395-0072 © 2022, IRJET | Impact Factor value: 7.529 | ISO 9001:2008 Certified Journal | Page 3868 such as C or Fortran may easily work with data stored in NumPy arrays without having to transfer data. Pandas Pandas has within itself many rich data structures and features built to work with Structured data is fast, easy, and expressive. The pandas have methods to describe manipulate, import, analyse, and even visualise the data. As you can see, it’s one of the important components that generally make Python a powerful and high-performing data mining environment in a self-sufficient way. The main object in pandas used for the most part, is a DataFrame, a two-dimensional, column-oriented, tabular data structure with row and column labels in a subtle way. pandas provide really rich data structures and features designed to work with: Structured data is fast, easy, and expressive in a kind of big way. As you can see, it's one of the important components that make Python a powerful and high-performing data mining environment, or so they specifically thought. The main object in pandas used throughout this book kind of is a DataFrame, which is a two-dimensional, column- oriented, tabular data structure having rows and column, similar to a Microsoft excel sheet. Matplotlib Matplotlib is most widely used and most popular library in python for creating graphs and other 2D data visualizations. It is perfect for creating such stories that are well suited for publication. It integrates pretty well with IPython to provide a much user-friendly, interactive environment for building visualisations and perform exploratory data analysis. Seaborn Seaborn is a Python package for generating statistical graphs. It has a high-level interface with matplotlib and is tightly integrated with pandas’ inbuilt data structures. The Seaborn library functions provide a declarative data- oriented API that converts data requests into graphs of their responses. Seaborn mechanically maps information values with visual characteristics such as colour, size or style after running datasets and plotting specifications, generating internal transformation statistics and plotting decorations with useful axis labels and annotations. Many sea functions can generate numbers by comparing conditional subsets of information or concatenating completely separate variables in a data set. The purpose of seaborn is to be useful throughout the life of a scientific enterprise. Seaborn supports rapid prototyping and exploratory data analysis by building complete graphs from a single function call with the fewest parameters. It can also be used to generate high quality polishing figures by providing a variety of customization options as well as rendering the underlying matplotlib objects. The Seaborn package provides an interface to matplotlib that enables rapid visual prototyping and statistical exploration while maintaining most of the power and balance required for graphic post-production. Great quality. It is commonly used in the field and can be used to display many types of data sets that can be saved as tables. IPython IPython is a part of the standard Python scientific toolkit for research that interconnects everything together. It provides a quite reliable and efficient environment for interactive and exploratory computing. IPython is a modified Python wrapper to speed up code generation, testing, and debugging, especially convenient for interactive work. Matplotlib is used for data visualization. IPython is commonly used in most Python operations, such as code execution, debugging, and testing. Aside from the standard terminal-based IPython shell, the project also provides • A HTML notebook for connecting to IPython through a command line and a web browser. • A Qt-based GUI framework console with inline plotting, multiline editing, and syntax highlighting • An infrastructure for efficient, accurate, and interactive parallel and distributed computing Due to all these qualities, we have chosen a jupyter notebook to serve the purpose of IPython for this paper. Scikit-learn Scikit-learn is a Python module that integrates a great range of modern machine learning algorithms, and methods for supervised and unsupervised medium-scale problems. This package focuses primarily on bringing machine learning to non-experts using high-level general-purpose languages. Particular attention is paid to its easy nature of use, its high performance, rich documentation, and high API consistency. It has minimal to zero dependencies and is distributed under a simplified BSD license, making it suitable for both academic and commercial purposes (arXiv:1201.0490 [cs.LG]). Scikit-learn leverages its rich Python environment to provide modern implementations of many widely used machine learning algorithms and methods while maintaining a very user-friendly interface integrated tightl y within the Python language libraries. It meets the growing demand for statistical data analysis through descriptive and beautiful visualizations by non- specialists as well as specialists in the software and web industries as well as non-computer science fields such as chemistry, biology, or physics.
- 8. International Research Journal of Engineering and Technology (IRJET) e-ISSN: 2395-0056 Volume: 09 Issue: 04 | Apr 2022 www.irjet.net p-ISSN: 2395-0072 © 2022, IRJET | Impact Factor value: 7.529 | ISO 9001:2008 Certified Journal | Page 3869 Scikit-learn is different from all the other machine learning tools in Python for many reasons: i) it contains compiled code for efficiency, unlike MDP (Zito et al., 2008) and My Brain (Schaul et al., 2010), iii) unlike pymvpa (Hanke et al., 2009), which has optional dependencies like R and shogun, easy deployment only relies on NumPy and scipy and focuses on imperative programming as opposed to my brain working with data flow framework. 3. ANALYSIS 3.1 FEATURE SELECTION AND ENGINEERING The columns which we will use for this analysis are: 1. MONTH: This variable contains the month number in which the product was bought on the platform. It has values ranging from 4(April) to 8(August). This is a categorical variable. 2. DAY: This variable has the day on which the product was bought by the customer. It ranges from 1 to 31 as for the number of days in a month. This is an ordinal variable. 3. PAGE 1 (MAIN CATEGORY): This variable is concerned with the main product category. It has four categories. 1-trousers 2-skirts 3-blouses 4-sale 4. PRICE: Price of product in US dollars. 5. PAGE: A website contains several pages to display the information and products. This variable will indicate to which page the sold product belongs. This variable has values ranging from 1 to 5. Why these 5 features? The features were selected on the basis of the objectives and the usability of the features to answer the questions. Selecting features such as year, order, session ID, colour, location, price 2 and model photography did not help in extracting any kind of useful insights that may help in the business optimization. These features contain information that is not useful for this analysis. The feature column year has the year of the sale of that particular product, but all the data is from a single year, that is, 2008. Hence, this feature is not usable.The feature column order contains the number of clicks per session before buying the product which does not provide any substantial information that can be used. Similarly, the features session ID, location, price 2 and model photography have information that cannot be used to serve the purpose if this analysis. PCA Principal component analysis is a statistical approach used to reduce the dimensionality of the dataset. It uses something called orthogonal transformation to convert a set of datapoints of possibly correlated features to a set of values that is linearly uncorrelated variables. These variables are called principal components. It is preferably used as a dimensionality reduction technique. Working PCA performs component analysis on a scaled dataset. To apply PCA to our dataset we have to pre-process our data and make it scaled. Scaling crunches all the features’ values into a range of 0 to 1. After performing scaling on our dataset, we start by instantiating a PCA model object, then find the principal components by using the fit method on the object, then apply the rotation to it and then finally dimensionality reduction by applying transform () on the same object. We can also specify how many components to have in the initialization of the PCA object. We have selected to have only two components from the main dataset. Figure 3: The selected dataset. Figure 5: Applying PCA on the data.
- 9. International Research Journal of Engineering and Technology (IRJET) e-ISSN: 2395-0056 Volume: 09 Issue: 04 | Apr 2022 www.irjet.net p-ISSN: 2395-0072 © 2022, IRJET | Impact Factor value: 7.529 | ISO 9001:2008 Certified Journal | Page 3870 Number of Principal Components An indispensable part of using PCA is the ability to estimate the number of components that are needed to describe the data. The number of components can be described by looking at the plot of cumulative explained variance as the function of the number of components. This curve in figure 4 indicates the quantification of how much of the total ,14-dimensional variance is contained within the first N components. Here, we can see that first 6 components contain approximately 80% of the variance, while we need around 9 components to describe close to 100% variance. Conclusion After conducting the PCA we found that our dataset can be differentiated into a smaller number of components successfully. We have successfully reduced the number of feature variables. This reduced-dimension dataset has 2 features but we cannot differentiate the data points on these two components and hence it cannot be used to make clusters. The Scree plot indicates the number of components should be 6 or 7 but we cannot realise 7 components in a 3D space, we need 7 dimensions to realise it. We can see that we have not extracted any useful results from the PCA we have performed on our data. This may be because of the reason that the principal component analysis works better when the features are highly correlated and we don’t have much high correlation between any of the variables, therefore pca is not useful to reduce the dimensions of the dataset. 3.2 EXPLORATORY DATA ANALYSIS To explore the data, we have to find out the trends by looking at the big picture of the trends in the data. After looking at the big picture we can dive deeper into the features modifying them and using them to serve our purpose. To look at the trends from a wider perspective we have to perform aggregate descriptive analysis on the dataset. once we have the big picture we can move further in our analysis. Firstly, we analyzed data on an aggregate level to check out for any correlations that we can use to extract meaningful insights and use them to serve our purpose of business optimization. This correlation heatmap tells us all about the inter- dependability of the feature variables in the dataset. Session ID and month are strongly correlated. Model photography and price are negatively correlated. The year feature is of no use as it has a single value. Price and page are slightly negatively correlated. Price 2 and price are showing a strong negative correlation. Other features show no such correlation. We now have to have a closer look at the different trends and try to analyse the trends they may follow to make the best use of the data available to us. Composition of sales by month April has the highest slice in our pie chart. This means that most items were sold in April. May follows April and has a 21.6% share in the total sales on the website. June, July, and May have a minute difference in the percentage of sales. They are in the descending order May, July than June. Figure 4: Scree plot. Figure 7: Pie chart of the composition of sales by month. Figure 6: Correlation Heatmap
- 10. International Research Journal of Engineering and Technology (IRJET) e-ISSN: 2395-0056 Volume: 09 Issue: 04 | Apr 2022 www.irjet.net p-ISSN: 2395-0072 © 2022, IRJET | Impact Factor value: 7.529 | ISO 9001:2008 Certified Journal | Page 3871 April particularly has the most sales, while August has the fewest; August, though, appears to be unusually low - may the statistics for that month be incomplete in a pretty big way. Finally, it’s worth checking each month just to make sure we have a complete list of dates and to track sales trends as they develop, kind of contrary to popular belief. So, it appears that August generally is missing data, as just roughly 70% month’s data is missing. This data cannot be imputed and we cannot afford to randomize our data because it may introduce some anomalies in the trends that we are working to find out. Sales and months by days. When we tried to analyze the sales on each day in April by grouping the data on the aggregate values. In the first 4 days of the month, the sales are high, and then the trend is similar throughout the month. A trend is repeated in a fixed interval of days this may be due to the delay in restocking the products in the company warehouse and using this analysis the company will be able to predict when to restock to make the maximum sales. April may have either sort of confusing or incomplete data - perhaps cumulative data from March mostly spilled into April, which is fairly significant. Then we built a similar plot for the next month. The month of May has a similar trend as of April after neglecting the first four days. However, the average number of sales is less than that of the same. The highest number of sales in May is about 1400 and that of August is about 1900. Figure 8: Distribution of products sold each month. Figure 9: Distribution of sales in April. Figure 10: Distribution of sales in May. Figure 11: Distribution of sales in June.
- 11. International Research Journal of Engineering and Technology (IRJET) e-ISSN: 2395-0056 Volume: 09 Issue: 04 | Apr 2022 www.irjet.net p-ISSN: 2395-0072 © 2022, IRJET | Impact Factor value: 7.529 | ISO 9001:2008 Certified Journal | Page 3872 Conducting the same analysis on the next months we can conclude that it seems that sales peak at the beginning of each month and significant drop as the month continues. However, April is the only month that follows this general trend exactly, with the rest of the months remaining relatively for all intents and purposes stable in a major way. When the data of the month of august was visualized, it made possible outliers visible. The data for the month of august is missing so we are not able to strongly comment on any trend. Although it may seem like the month of august will follow a similar trend as its available data is showing. We can see that till the 12th day of the month the data is available and suddenly on the 13th day it abruptly stopped, having too few values. When someone has to buy something, they have that product in mind more than 90% of the time. We can use this feature to understand which kind of clothing do people prefer to wear from April to August. This can help in restocking and availability of more varieties of the product based on customer preference. Product and sales When the plot of the cost is grouped by the items and visualized on a count plot, we see that Skirts have the greatest average cost, whilst goods on sale have the lowest price. How many of each item sells, and how much money do they bring in? Figure 14: Average cost of each clothing item To answer our questions, we tried to look deeply into the correlations between the type of product and different categories. As skirts have the greatest price, they are the least sold item, albeit by a little margin. Skirts are the second most profitable item in terms of sales dollars. Trousers sell the most pieces and create the most Figure 15: Distributions of items sold and total sales by type of item. Figure 12: Distribution of sales in July Figure 13: Distribution of sales in August.
- 12. International Research Journal of Engineering and Technology (IRJET) e-ISSN: 2395-0056 Volume: 09 Issue: 04 | Apr 2022 www.irjet.net p-ISSN: 2395-0072 © 2022, IRJET | Impact Factor value: 7.529 | ISO 9001:2008 Certified Journal | Page 3873 revenue, with substantially more sales and dollars separating trousers from the next closest item. People may be looking at skirts and not buying them due to the average high price. The price of skirts should be reduced or some coupons should be released for the item-specific type to make people buy more skirts. This may have two outcomes. If the skirts are bought in the same number even after decreasing the cost, it may result in a loss for the business. On the other hand, if our prediction is true and people buy more skirts, we will sell more skirts than any other product. Sale items sell significantly more than blouses or skirts but produce the fewest dollars in sales because of the lower average price. Skirts, on average, have the highest price, whereas items on sale, intuitively, have the lowest price, or so they essentially thought. How many of each item essentially do they sell, and how generally much profit do they bring in in a particularly big way. Page and sales. In terms of average price per item, page 5 is the median page, with pages 1 and 2 having a higher average price per item and pages 3 and 4 having a pretty much lower sort of average price per item, which generally is quite significant. Page 2 has almost the best kind of average price per item, rather than page 1, whereas page 3 for the most part has generally had the lowest average price per item, which is quite significant. Was this done on purpose, basically contrary to popular belief? Is this to kind of persuade customers to buy on page 1 because page 2 is a sort of little sort of more expensive in a major way? Should they literally reap the benefits of the page 3 bargains before the prices kind of go up or do they generally lose interest, or so they thought? Instead, product placement could essentially have been more arbitrary. We can suggest the company make proper use of the website and introduce more products on the website which may make people look at the pages which come later. These pages might have better products than the other pages but people tend to buy products early on due to laziness or may be due to the deteriorating quality of the products on subsequent pages. The general overall number of sales by page and the money earned per page seems to have a similar distribution - let's mostly take a kind of deeper look: Page 1 accounts for the kind of the largest share of revenue and sales, with the first page accounting for well over half of all sales and pages 1 and 2 accounting for over 80% of each, which mostly is fairly significant. Customers who encounter an item they like and generally decide to particularly buy it rather than specifically continue exploring, for the most part, are two possible explanations that may contribute to this, which generally is fairly significant. To optimize sales, the more Figure 18: Average price of item on every page. Figure 19: Distribution of total dollars’ worth of items sold per page. Figure 17: Distribution of sales of products by the page they are displayed on. Figure 16: Composition of sales per page and price of items per page
- 13. International Research Journal of Engineering and Technology (IRJET) e-ISSN: 2395-0056 Volume: 09 Issue: 04 | Apr 2022 www.irjet.net p-ISSN: 2395-0072 © 2022, IRJET | Impact Factor value: 7.529 | ISO 9001:2008 Certified Journal | Page 3874 popular an item is, the pretty much closer it travels to page 1. 3.3 CLUSTERING To find some of the insights using K-means clustering which is an unsupervised algorithm we take the variable page1 and apply the algorithm to find out clusters and plot them to visually interpret the results. The first step in this process is to standardize the data which is done using the standard scaler function of the scikit learn library. Standard scaler standardizes the features by removing the mean and scaling to unit variance. Then we fit the model and then predict the possible clusters in the data. To find the correct value of the K in the K means clustering we need to plot the elbow graph which is nothing but the within cluster sum of squares against the number of clusters. In the figure 20 we can clearly see that at the value 3 on the x-axis the plot has a sudden bend, this value is the optimal value for K in our dataset. Using this K value, we will fit the data in the K means clustering algorithm and then predict the clusters in the data. We have successfully identified the clusters based on the price of the products and the products. We can see in figure 20 that there are 3 clusters formed on the feature page1. These three clusters imply that there are 3 buying patterns-based on the products and the price of the products. 4. CONCLUSION According to the data and statistical analysis we can infer several important findings of patterns of sales of products and customer buying trends on the E- commerce website: The trends in sales observed according to months is that a peak in sales occurs in April, and then it declines slightly in the following months. The data for August is incomplete, but as observed, there is an evident decline in selling trends with and without the data for August month included. The observable trends in sales infer that there is a peak in the sales at the beginning of the month, and then it declines slightly over the month. Once we make amendments to the incomplete data and possible confounders, the trend of sales is found to be more stable over a month. If we look at the price at which each product is sold, it has been observed that skirts have the highest average price out of all goods. While looking at which product sells the most, it is found that trousers sell the highest number of units and generate the most dollars in sales by a significant margin. Sales items bring in the least money but generate more sales than either blouses or skirts. Page listing is as follows- Pages 1 and 2 have the highest-priced items and account for over 80% of all sales and dollars. Page 5 accounts for the fewest sales, but it is unknown if it has as many items shown as pages 1-4. Page 3 has the least expensive items of all pages. 5. REFERENCES [1]. Apichottanakul, A., Goto, M., Piewthongngam, K., and Pathumnakul, S., 2021. Customer behavior analysis based on buying-data sparsity for multi-category products in pork industry: A hybrid approach. Cogent Engineering, 8(1), p.1865598. [2]. Barari, M., Ross, M., Thaichon, S. and Surachartkumtonkun, J., 2021. A meta‐analysis of customer engagement behavior. International Journal of Consumer Studies, 45(4), pp.457-477. [3]. Chalupa, S. and Petricek, M., 2020. Using Technology and Customer Behavior Characteristics to Improve Hotel Sales Performance. TEM Journal, 9(2), p.573. [4]. Kanavos, A., Iakovou, S.A., Sioutas, S. and Tampakas, V., 2018. Large scale product recommendation of supermarket ware based on customer behavior analysis. Big Data and Cognitive Computing, 2(2), p.11. [5]. Kumar, A., Salo, J., and Li, H., 2019. Stages of user engagement on social commerce platforms: Analysis with the navigational clickstream data. International journal of electronic commerce, 23(2), pp.179-211. [6]. Lee, C.K.H., Tse, Y.K., Zhang, M. and Ma, J., 2019. Analyzing online reviews to investigate customer Figure 20: WCSS plot for the elbow method Figure 21: Clusters from the K means clustering.
- 14. International Research Journal of Engineering and Technology (IRJET) e-ISSN: 2395-0056 Volume: 09 Issue: 04 | Apr 2022 www.irjet.net p-ISSN: 2395-0072 © 2022, IRJET | Impact Factor value: 7.529 | ISO 9001:2008 Certified Journal | Page 3875 behavior in the sharing economy: The case of Airbnb. Information Technology & People. [7]. Micu, A., Micu, A.E., Geru, M., Căpățînă, A. and Muntean, M.C., 2021. THE IMPACT OF ARTIFICIAL INTELLIGENCE USE ON E-COMMERCE IN ROMANIA. The AMFITEATRU ECONOMIC journal, 23(56), pp.137-137. [8]. Noviantoro, T. and Huang, J.P., 2021. APPLYING DATA MINING TECHNIQUES TO INVESTIGATE ONLINE SHOPPER PURCHASE INTENTION BASED ON CLICKSTREAM DATA. Review of Business, Accounting, & Finance, 1(2), pp.130-159. [9]. Sharma, S. and Rai, M., 2017. Customer Behavior Analysis using Web Usage Mining. Int J Sci Res Comput Sci Eng, 5(6), pp.47-50. [10]. Weingarten, J. and Spinler, S., 2020. Shortening Delivery Times by Predicting Customers’ Online Purchases: A Case Study in the Fashion Industry. Information Systems Management, pp.1-22. [11]. Å•apczyÅ„ ski M., BiaÅ‚owÄ…s S. (2013) Discovering Patterns of Users' Behaviour in an E- shop - Comparison of Consumer Buying Behavior in Poland and Other European Countries, “Studia Ekonomiczne―, nr 151, “La société de information: perspective européenne et global: Les usages et les risques d'Internet pour Les citoyens et Les consommateurs―, p. 144-153 [12]. Everitt, Brian S.; Howell, David C. (2005). Encyclopedia of Statistics in Behavioral Science || Principal Component Analysis. , (), – . doi:10.1002/0470013192.bsa501 [13]. Dennis Koehn, Stefan Lessmann, Markus Schaal, Predicting Online Shopping Behaviour from Clickstream Data using Deep Learning, Expert Systems With Applications (2020), DOI: https://doi.org/10.1016/j.eswa.2020.113342 [14]. Gökhan SøLAHTAROöLU, Hale DÖNERTAùLI, Analysis and Prediction of E-Customers’ Behavior by Mining Clickstream Data, 2015 IEEE International Conference on Big Data (Big Data). [15]. Tri Noviantoro, Jen-Peng Huang, APPLYING DATA MINING TECHNIQUES TO INVESTIGATE ONLINE SHOPPER PURCHASE INTENTION BASED ON CLICKSTREAM DATA. College of Business, Southern Taiwan University of Science and Technology Tainan City, Taiwan [16]. Apăvăloaie, E. I. (2014). The impact of the internet on the business environment. Procedia Economics and Finance, 15, 951-958. [17]. Baati, K., & Mohsil, M. (2020). Real-Time Prediction of Online Shoppers’ Purchasing Intention Using Random Forest. In IFIP International Conference on Artificial Intelligence Applications and Innovations (pp. 43-51). Springer, Cham. [18]. Chen, D., Sain, S. L., & Guo, K. (2012). Data mining for the online retail industry: A case study of RFM model-based customer segmentation using data mining. Journal of Database Marketing & Customer Strategy Management, 19(3), 197-208. [19]. Chung, H. M., & Gray, P. (1999). Data mining. Journal of management information systems, 16(1), 11-16. [20]. Clifton, B. (2012) Advanced Web Metrics with Google Analytics. Available at: http://www.amazon.com/Advanced-Web-Metrics- Google-Analytics/dp/1118168445. Dougherty, E. R., Hua, J., and Sima, C. (2009). Performance of feature selection methods. Current genomics, 10(6), 365- 374. Du, J., Rong, J., Michalska, S., Wang, H., & Zhang, Y. (2019). Feature selection for helpfulness prediction of online product reviews: An empirical study. PloS One, 14(12), 1–26. [21]. Fawcett, T. (2006). An introduction to ROC analysis, Pattern Recognition Letters, 27(8), 861– 874. [22]. Fernández, A., García, S., Luengo, J., Bernadó- Mansilla, E., & Herrera, F. (2010). Genetics-based machine learning for rule induction: state of the art, taxonomy, and comparative study. IEEE Transactions on Evolutionary Computation, 14(6), 913-941. [23]. Karegowda, A. G., Manjunath, A., S. & Jayaram, M. A. (2010). Feature subset selection problem using wrapper approach in supervised learning. International Journal of Computer Applications, 1(7), 13–17. [24]. Ketjie, Mawardi, C. V., & Perdana, J. N. (2020). Prediction of credit cards using the Naïve Bayes method and C4.5 algorithm. IOP Conference Series: Materials Science and Engineering, 1007(1), 012161. [25]. Premchaiswadi, Wichian; Romsaiyud, Walesa, 2012. Extracting WebLog of Siam University for Learning User Behavior on MapReduce, Proceedings of 4th International Conference on Intelligent and Advanced Systems (ICIAS) and A Conference of World Engineering, Science and Technology Congress. [26]. Senecal, S., Kalczynski, P. J., & Nantel, J., 2005. Consumers Decision making process and their online shopping behavior: A clickstream analysis. Journal of Business Research, 58, 1599 – 1608. [27]. Hu, Jia, Zhong, Ning, 2008. Web farming with clickstream International Journal Of Information Technology & Decision Making, 7(2), 291-308. [28]. Ting, I-Hsien; Kimble, Chris; Kudenko, 2009. Daniel, Finding Unexpected Navigation Behaviour In Clickstream Data For Website Design Improvement, Journal Of Web Engineering, 8(1), 71-92. [29]. Detlor B.,2000. The corporate portal as information structure: Towards a framework for portal design. International Journal of Information Technology. [30]. Graniü A., Mitroviü I.& Maranguniü N., 2011. Exploring the usability of web portals: A Croatian
- 15. International Research Journal of Engineering and Technology (IRJET) e-ISSN: 2395-0056 Volume: 09 Issue: 04 | Apr 2022 www.irjet.net p-ISSN: 2395-0072 © 2022, IRJET | Impact Factor value: 7.529 | ISO 9001:2008 Certified Journal | Page 3876 case study. International Journal of Information Technology. [31]. Lin, C.J. & Lu, H.,2000. Towards an understanding of the behavioral intention to use a web site. . International Journal of Information Technology. [32]. Domingues, Marcos Aurelio; Soares, Carlos; Jorge, Alipio Mario.2013. Using Statistics, Visualization And Data Mining For Monitoring The Quality Of Meta-Data In Web portals, Information Systems And E-Business Management, 11(4), 569- 595. [33]. Randolph E. Bucklina, Catarina Sismeirob, a Peter W. Mullin Professor. Click Here for Internet Insight: Advances in Clickstream Data Analysis in Marketing. UCLA Anderson School, 110 Westwood Plaza, Los Angeles, CA 90095, USA b Senior Lecturer, Imperial College Business School, Imperial College, London, UK. [34]. Taha A.A., Bampoulidis A., Lupu M. (2019) Chance influence in datasets with a large number of features. In: Haber P., Lampoltshammer T., Mayr M. (eds) Data Science – Analytics and Applications. Springer Vieweg, Wiesbaden. [35]. Isabelle Guyon, Andre Elisseeff. An Introduction to Variable and Feature Selection. Journal of Machine Learning Research 3 (2003) 1157-1182. 6. APPENDICES APPENDIX I – The dataset used in this paper. Size of the data set: The data set has 165474 rows and 14 columns. Attributes of the dataset: 1. YEAR: The data is recorded only for certain months for the same year so the value of the YEAR column is the same in all the rows i.e., 2008. 2. MONTH: This variable contains the month number in which the product was bought on the platform. It has values ranging from 4(April) to 8(August). This is a categorical variable. 3. DAY: This variable has the day on which the product was bought by the customer. It ranges from 1 to 31 as for the number of days in a month. This is an ordinal variable. 4. ORDER: This variable contains the total number of clicks during one session of a user on the platform. It is numerical data. 5. COUNTRY: Variable indicating the country of origin of the IP address with the following categories: Australia, Austria, Belgium, British Virgin Islands, The Cayman Islands, Christmas Island, Croatia, Cyprus, Czech Republic, Denmark, Estonia, Unidentified, Faroe Islands, Finland, France, Germany, Greece, Hungary, Iceland, India, Ireland, Italy, Latvia, Lithuania, Luxembourg, Mexico, Netherlands, Norway, Poland, Portugal, Romania, Russia, San Marino, Slovakia, Slovenia, Spain, Sweden, Switzerland, Ukraine, United Arab Emirates, United Kingdom, USA, biz (.biz) 44-com (.com), Int (.int) 46-net (.net), org (*.org). 6. SESSION ID: Variable indicating session-id (a short record). A session ID is a unique code assigned by a web server to a specific surfer for the duration of their visit (session) on the website. Session IDs are stored as cookies, form fields, or Uniform Resource Locators (URLs). Some web servers simply increment a static number to generate the session ID. However, most of the web servers use the algorithms that include more sophisticated techniques, such as tracking even the variables such as date and time any surfers visit on the website, along with other variables defined by the server administrator. Each time a web user clicks on a particular link of website, a new session ID is assigned. Closing and reopening the browser and revisiting the site can sometimes generate a new session ID. 7. PAGE 1 (MAIN CATEGORY): This variable is concerned with the main product category. It has four categories. 1-trousers 2-skirts 3-blouses 4-sale 8. PAGE 2 (CLOTHING MODEL): It contains information about the product code for each product. There are a total of 217 products in the dataset. All these products have a unique product id associated with the respected product. 9. COLOUR: It describes the colour of the product. 1- beige 2- black 3- blue 4- brown 5- burgundy 6- gray
- 16. International Research Journal of Engineering and Technology (IRJET) e-ISSN: 2395-0056 Volume: 09 Issue: 04 | Apr 2022 www.irjet.net p-ISSN: 2395-0072 © 2022, IRJET | Impact Factor value: 7.529 | ISO 9001:2008 Certified Journal | Page 3877 7- green 8- navy blue 9- of many colors 10-olive 11-pink 12-red 13-violet 14-white 10. LOCATION: On the web page of the website there are locations on which the picture of the product is displayed. This variable deals with the location of the picture on the page, the webpage has been divided into six parts: 1-top left 2-top in the middle 3-top right 4-bottom left 5-bottom in the middle 6-bottom right 11. MODEL PHOTOGRAPHY: Any product on a website has to have a visual description. This picture has a model wearing the product. This variable depicts the visual description of the with two categories: 1- Only face 2- Profile 12. PRICE: Price of product in US dollars. 13. PRICE 2: This is the variable informing about the price of a particular product being higher than the average price for the entire product category. 1-yes 2-no 14. PAGE: A website contains several pages to display the information and products. This variable will indicate to which page the sold product belongs. This variable has values ranging from 1 to 5. Why these 5 features? The features were selected on the basis of the objectives and the usability of the features to answer the questions. Selecting features such as year, order, session ID, colour, location, price 2 and model photography did not help in extracting any kind of useful insights that may help in the business optimization. These features contain information that is not useful for this analysis. The feature column year has the year of the sale of that particular product, but all the data is from a single year, that is, 2008. Hence, this feature is not usable. The feature column order contains the number of clicks per session before buying the product which does not provide any substantial information that can be used. Similarly, the features session ID, location, price 2 and model photography have information that cannot be used to serve the purpose if this analysis. APPENDIX II - The source code. import pandas as pd import numpy as np import seaborn as sns import matplotlib.pyplot as plt %matplotlib inline df=pd.read_csv("e-shop clothing 2008.csv",sep=';') df.head(10) sns.displot(data=df,x='price',kind='hist',bins=10) df.shape df.info() csdf = df[['month', 'day', 'page 1 (main category)', 'price', 'page']] csdf = csdf.rename(columns={'month':'Month', 'day':'Day', 'page 1 (main category)':'Type', 'price':'Price', 'page':'Page'}) csdf.Type = csdf.Type.replace({1: 'Trousers', 2: 'Skirts', 3: 'Blouses', 4: 'Sale'}) csdf.Month = csdf.Month.replace({4: 'April', 5: 'May', 6: 'June', 7:'July', 8: 'August'}) csdf.head() by_month=csdf.Month.value_counts() by_month.plot(kind='bar',color=['purple','black','black',' black','orange']) plt.xlabel('Months') plt.ylabel('Number of products sold') plt.title('Number of products sold each month') plt.show() aug=csdf.loc[csdf['Month']=='August'] april=csdf.loc[csdf['Month']=='April'] may=csdf.loc[csdf['Month']=='June'] june=csdf.loc[csdf['Month']=='June'] july=csdf.loc[csdf['Month']=='July'] aug_day=aug['Day'].value_counts() april_day=april['Day'].value_counts() may_day=may['Day'].value_counts() june_day=june['Day'].value_counts() july_day=july['Day'].value_counts()
- 17. International Research Journal of Engineering and Technology (IRJET) e-ISSN: 2395-0056 Volume: 09 Issue: 04 | Apr 2022 www.irjet.net p-ISSN: 2395-0072 © 2022, IRJET | Impact Factor value: 7.529 | ISO 9001:2008 Certified Journal | Page 3878 april=pd.DataFrame(april_day) april.reset_index(inplace=True) may=pd.DataFrame(may_day) may.reset_index(inplace=True) june=pd.DataFrame(june_day) june.reset_index(inplace=True) july=pd.DataFrame(july_day) july.reset_index(inplace=True) aug=pd.DataFrame(aug_day) aug.reset_index(inplace=True) fig, axs = plt.subplots(nrows=3, ncols = 2, figsize=[14,18]) # sns.lineplot(x=april['index'],y=april['Day']) axs[0,0].bar(april['index'],april['Day'],color='slateblue') axs[0,0].set_title('Sales per day in april') axs[0,1].bar(may['index'],may['Day'],color='teal') axs[0,1].set_title('Sales per day in may') axs[1,0].bar(june['index'],june['Day'],color='cadetblue') axs[1,0].set_title('Sales per day in june') axs[1,1].bar(july['index'],july['Day'],color='brown') axs[1,1].set_title('Sales per day in july') axs[2,0].bar(aug['index'],aug['Day'],color='wheat') axs[2,0].set_title('Sales per day in august') by_month_4=by_month['April':'June'] axs[2,1].bar(by_month_4.index,by_month_4.values,color =['tan','black','black','black']) axs[2,1].set_title('sales per month April to July') plt.show() df_grp_mnth=csdf[['Month','Price']].groupby('Month').su m() df_grp_mnth.head() plt.pie(df_grp_mnth.Price,explode=[0.1,0,0,0,0],shadow= True, startangle=90, colors=['olive', 'khaki', 'salmon', 'lightseagreen', 'springgreen'],autopct='%1.1f%%') plt.legend(df_grp_mnth.index,title='Months',loc=(1,.5)) plt.show() df_grp_type_avg=csdf[['Type','Price']].groupby('Type').m ean() df_grp_type_avg fig, ax = plt.subplots(figsize = [14,6]) ax.bar(df_grp_type_avg.index, df_grp_type_avg.Price, color = ['dimgrey', 'dimgrey', 'orangered', 'dimgrey'], alpha = .8) ax.set_title('Average Cost of Clothing Type', fontsize=18) plt.show() total_types = csdf.Type.value_counts() df_grp_type_sum=csdf[['Type','Price']].groupby('Type').s um() df_type = df_grp_type_sum df_type['Total'] = total_types df_type['Average'] = df_grp_type_avg['Price'] df_type = df_type.rename(columns={'Price' : 'Value'}) df_type fig, axs = plt.subplots(nrows=2, ncols = 2, figsize=[14, 12]) axs[0,0].bar(df_type.index, df_type.Total, color=['gray', 'gray', 'gray', 'crimson'], alpha=.8) axs[0,0].set_title('Items Sold by Type', fontsize=18) axs[0,1].bar(df_type.index, df_type.Value, color=['gray', 'gray', 'gray', 'mediumspringgreen'], alpha=.8) axs[0,1].set_title('Total Sales Amount by Type', fontsize=18) axs[0,1].set_ylabel('USD, in Millions') axs[1,0].pie(df_type.Total, explode=(0, 0, 0, 0.05), autopct='%1.1f%%', shadow=True, startangle=90, colors=['lightgray', 'gray', 'dimgray', 'crimson']) axs[1,0].axis('equal') axs[1,0].set_title("Share of Sales per Type", fontsize=18) axs[1,0].legend(df_type.index, title="Clothing Type", loc="upper right") axs[1,1].pie(df_type.Value, explode=(0, 0, 0, 0.05), autopct='%1.1f%%', shadow=True, startangle=90, colors=['lightgray', 'gray', 'dimgray', 'mediumspringgreen']) axs[1,1].axis('equal') axs[1,1].set_title("Share of Total Sales in Dollars per Type", fontsize=18) axs[1,1].legend(df_type.index, title="Clothing Type", loc="upper right") plt.show() csdf.corr() page_count=csdf.Page.value_counts() df_grp_page_avg=csdf[['Price','Page']].groupby('Page').m ean() df_grp_page_sum=csdf[['Price','Page']].groupby('Page').s um() df_page=df_grp_page_sum df_page['Average']=df_grp_page_avg df_page['Pages']=page_count df_page sns.barplot(x=df_page.index,y='Average',data=df_page) plt.title('Average Price of items per Page') plt.show() sns.barplot(x=df_page.index,y='Price',data=df_page) plt.title('Total Dollars worth of items sold per page')
- 18. International Research Journal of Engineering and Technology (IRJET) e-ISSN: 2395-0056 Volume: 09 Issue: 04 | Apr 2022 www.irjet.net p-ISSN: 2395-0072 © 2022, IRJET | Impact Factor value: 7.529 | ISO 9001:2008 Certified Journal | Page 3879 plt.show() sns.barplot(x=df_page.index,y='Pages',data=df_page) plt.title('No of items sold per page') plt.show() fig,ax=plt.subplots(nrows=1,ncols=2,figsize=[14,7]) ax[0].pie(df_page.Pages, explode=(0.1, 0, 0, 0, 0), autopct='%1.1f%%', shadow=True, startangle=90, colors=['steelblue','green','limegreen','lightgreen', 'gold']) ax[0].legend(df_page.index) ax[0].set_title('Composotion of sales per page',fontsize=20) ax[1].pie(df_page.Price, explode=(0.1, 0, 0, 0, 0), autopct='%1.1f%%', shadow=True, startangle=90, colors=['steelblue','green','limegreen','lightgreen', 'gold']) ax[1].legend(df_page.index) ax[1].set_title('Composotion of price per page',fontsize=20) plt.show() from sklearn.preprocessing import StandardScaler scaler=StandardScaler() df_pca=df.drop(['year','page 2 (clothing model)','price_cat','price'],axis=1) scaler.fit(df_pca) df_pca.head() scaled_df=scaler.transform(df_pca) scaled_df from sklearn.decomposition import PCA pca = PCA().fit(scaled_df) plt.plot(np.cumsum(pca.explained_variance_ratio_)) plt.xlabel('number of components') plt.ylabel('cumulative explained variance') pca=PCA(n_components=2) pca.fit(scaled_df) x_pca=pca.transform(scaled_df) y=df['price_cat'].values y=np.array([int(i) for i in y]) fig, axes = plt.subplots(1,2) axes[0].scatter(scaled_df[:1000,0], scaled_df[:1000,1], c=y[0:1000]) axes[0].set_xlabel('x1') axes[0].set_ylabel('x2') axes[0].set_title('Before PCA') axes[1].scatter(x_pca[:1000,0], x_pca[:1000,1], c=y[0:1000]) axes[1].set_xlabel('PC1') axes[1].set_ylabel('PC2') axes[1].set_title('After PCA') plt.show() from sklearn.datasets import make_blobs from sklearn.cluster import KMeans scaleddf=pd.DataFrame(scaled_df) scaleddf=scaleddf.rename({0:'month', 1:'day', 2:'order',3: 'country', 4:'session ID', 5:'page1', 6:'colour', 7:'location',8:'model photography', 9:'price', 10:'price2', 11:'page'},axis=1) scaleddf.head() x = scaleddf.iloc[:, [5, 6]].values y=scaleddf['price'] wcss_list= [] for i in range(2, 10): kmeans = KMeans(n_clusters=i, init='k-means++', random_state= 42) kmeans.fit(X) wcss_list.append(kmeans.inertia_) plt.plot(range(2, 10), wcss_list) plt.title('The Elobw Method Graph') plt.xlabel('Number of clusters(k)') plt.ylabel('wcss_list') plt.show() kmeans = KMeans(n_clusters=3, init='k-means++', random_state= 42) y_kmeans= kmeans.fit_predict(x) x, y_kmeans = make_blobs(n_samples=600, centers=3, cluster_std=0.60, random_state=0) plt.scatter(x[y_kmeans == 0, 0], x[y_kmeans == 0, 1], s = 100, c = 'blue', label = 'Cluster 1') #for first cluster plt.scatter(x[y_kmeans == 1, 0], x[y_kmeans == 1, 1], s = 100, c = 'green', label = 'Cluster 2') #for second cluster plt.scatter(x[y_kmeans== 2, 0], x[y_kmeans == 2, 1], s = 100, c = 'red', label = 'Cluster 3') #for third cluster # plt.scatter(x[y_kmeans == 3, 0], x[y_kmeans == 3, 1], s = 100, c = 'cyan', label = 'Cluster 4') #for fourth cluster plt.title('Clusters of customers') plt.xlabel('Products') plt.ylabel('Price') plt.legend() plt.show()