Aggregate Demand (AD)
or
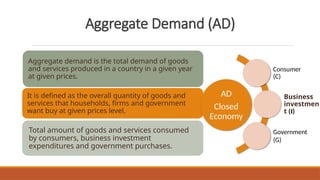
Aggregatedemand is the total demand of goods
and services produced in a country in a given year
at given prices.
It is defined as the overall quantity of goods and
services that households, firms and government
want buy at given prices level.
Total amount of goods and services consumed
by consumers, business investment
expenditures and government purchases.
AD
Closed
Economy
Consumer
(C)
Business
investmen
t (I)
Government
(G)
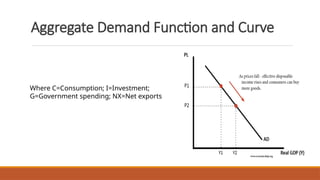
Why AD curveis downward sloping?
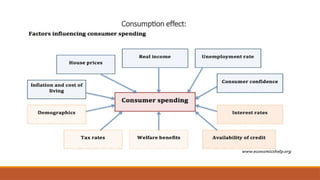
Consumption effect
Nominal of
money value is
not fixed that you
hold
(1)
Real value of
money is fixed
(2)
Change in
prices
(3)
Change
consumption
(4)
Change
in Demand
of Goods &
Services
(5)
Price and Investment:
Interestrate effect
Fall in
Price
The Less
money
households
need to hold
Households
lends some
part of it
Lower the
rate of
interest
Cost of
borrowing
will decline
for firms
Encourage
the firms’
investment
Leads to
greater
investment
spending
12.
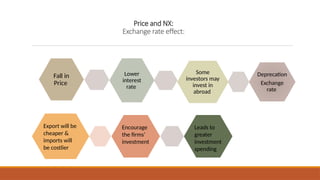
Price and NX:
Exchangerate effect:
Fall in
Price
Lower
interest
rate
Some
investors may
invest in
abroad
Deprecation
Exchange
rate
Export will be
cheaper &
imports will
be costlier
Encourage
the firms’
investment
Leads to
greater
investment
spending
13.
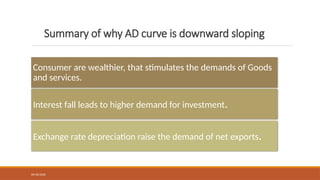
Summary of whyAD curve is downward sloping
09/30/2020
Consumer are wealthier, that stimulates the demands of Goods
and services.
Interest fall leads to higher demand for investment.
Exchange rate depreciation raise the demand of net exports.
14.
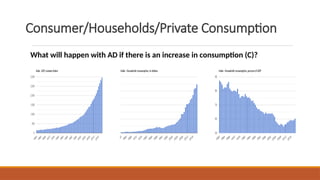
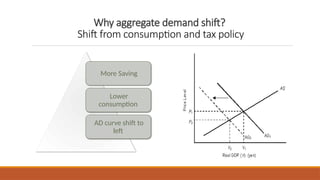
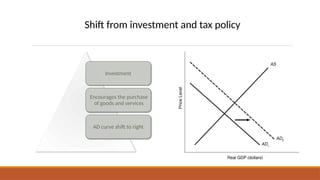
Why aggregate demandshift?
Shift from consumption and tax policy
More Saving
Lower
consumption
AD curve shift to
left
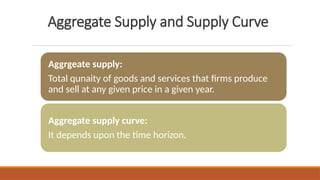
Aggregate Supply andSupply Curve
Aggrgeate supply:
Total qunaity of goods and services that firms produce
and sell at any given price in a given year.
Aggregate supply curve:
It depends upon the time horizon.
20.
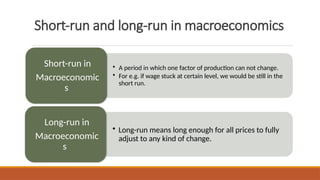
Short-run and long-runin macroeconomics
• A period in which one factor of production can not change.
• For e.g. if wage stuck at certain level, we would be still in the
short run.
Short-run in
Macroeconomic
s
• Long-run means long enough for all prices to fully
adjust to any kind of change.
Long-run in
Macroeconomic
s
22.
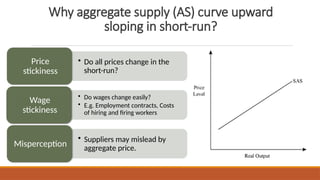
Why aggregate supply(AS) curve upward
sloping in short-run?
• Do all prices change in the
short-run?
Price
stickiness
• Do wages change easily?
• E.g. Employment contracts, Costs
of hiring and firing workers
Wage
stickiness
• Suppliers may mislead by
aggregate price.
Misperception
23.
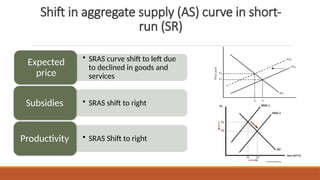
Shift in aggregatesupply (AS) curve in short-
run (SR)
• SRAS curve shift to left due
to declined in goods and
services
Expected
price
• SRAS shift to right
Subsidies
• SRAS Shift to right
Productivity
24.
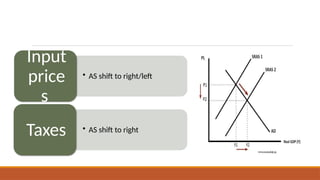
• AS shiftto right/left
Input
price
s
• AS shift to right
Taxes
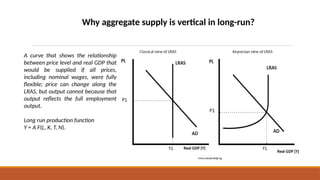
Why aggregate supplyis vertical in long-run?
A curve that shows the relationship
between price level and real GDP that
would be supplied if all prices,
including nominal wages, were fully
flexible; price can change along the
LRAS, but output cannot because that
output reflects the full employment
output.
Long run production function
Y = A F(L, K, T, N).
27.
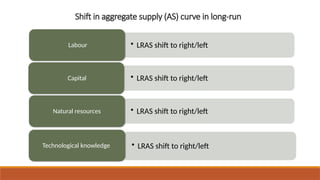
Shift in aggregatesupply (AS) curve in long-run
• LRAS shift to right/left
Labour
• LRAS shift to right/left
Capital
• LRAS shift to right/left
Natural resources
• LRAS shift to right/left
Technological knowledge