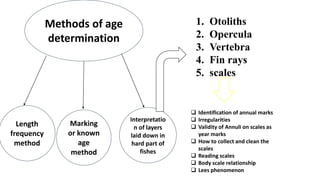
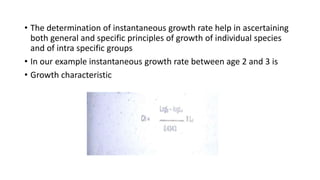
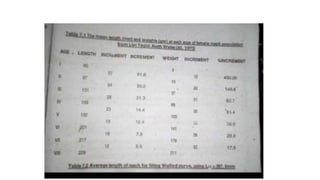
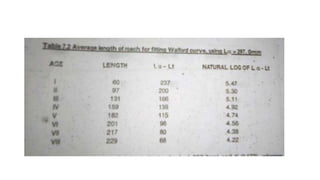
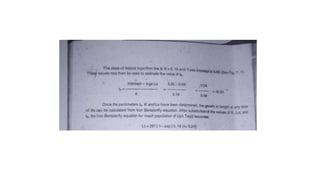
At what age does a fish attain a maturity
What is the perfect catchable or mark able size of the fish
It helps to calculate the life span and longevity of fish
It enables to estimate and compare growth rates of fish in different waters.
Good or bad growth can point out the suitability for rearing and stocking purposes
The timing of spawning migration of given species can be worked out .
Modern developments in transport technology are from two levels; one is from an understanding of internal physiological mechanisms of the fish and the optimal requirements, ensuring maximum survival of fish under transport and the other is from a study of the environmental parameters of the medium in which fish are transported. Under anaesthesia fish can be transported without water even, provided the skin and gills are kept moist under low temperature. The cryopreservation of fish sperm for use at any convenient time can be referred to here, though this would concern seed production more directly than live seed transport.
it is about the length and weight relationship of fish , growth, length, weight, absolute growth, isometric growth, relative growth, allometric growth,
Nutritional requirement of cultivable fin fish: larvae, juveniles and adultsDebiprasad1997
Fish is among the healthiest foods on the planet. It is loaded with important nutrients, such as protein and vitamin D. Fish is also the world's best source of omega-3 fatty acids, which are incredibly important for human body and brain.
Manufactured feeds are an important part of modern commercial aquaculture, providing the balanced nutrition needed by farmed fish.
In the development of modern aquaculture, starting in the 1970s, fishmeal and fish oil were key components of the feeds for these species. They are combined with other ingredients such as vegetable proteins, cereal grains, vitamins and minerals and formed into feed pellets.
The global supply of fish meal and fish oil is finite and fully utilized. Alternative or nontraditional feedstuffs may differ in terms of taste, smell, texture, and color, as well as nutrient composition, from the traditional feedstuffs, which are produced largely from the natural prey of the fish being raised. Alternative feedstuffs may also contain compounds and antinutritional factors that affect digestive or sensory physiology.
Another important area of fish nutrition for the next 20 years will be larval fish nutrition. Currently, the cost and difficulty of rearing a great number of species from the first feeding to the juvenile stage are the most severe bottlenecks to the development of aquaculture production of nontraditional species.
what is Fish blood.reading this you will know about fish blood.a short description about fish blood
source:<a>bd tips tech</a> the best bangla tech site http://www.bdtipstech.com
DETERMINATION OF AGE AND GROWTH OF FISH.pptxMalayDuyari
In this topic we all know about the age and growth of the fish and also know how to determine the growth and age of a live fish. what are the factor that influences the growth of the fish
Lobster breeding seedproduction and rearing and fattening in CagesB. BHASKAR
Commercially important exploited Lobster species of India, Breeding, seed production, larval rearing and nursery rearing, pit culture and open sea cage culture of lobsters, cost economic of lobster Aquaculture, water quality & feeding management, SWOT Analysis in experimental lobster farming. Constraints and Recommendations
Flatfishes are the common name of the order Pleuronectiformes. The characteristic features of flatfishes are their asymmetry, mainly their eyes, both eyes on the same side of the head in juveniles and adults.
this presentation deals with the Flat fishes and their fisheries in India.
Polymerase chain reaction (PCR) is a laboratory technique used to make multiple copies of a segment of DNA. PCR is very precise and can be used to amplify, or copy, a specific DNA target from a mixture of DNA molecules. ... The mixture is then cooled (eg, 60-65°C) so that the primers anneal (bind) to the DNA template.
The polymerase chain reaction (PCR) was originally developed in 1983 by the American biochemist Kary Mullis. He was awarded the Nobel Prize in Chemistry in 1993 for his pioneering work.
Organ culture is defined as the description and development in vitro of any organ or in the portion of organs where many tissue constituents like Parenchyma and Stroma, and there structural correlation and function are protected in culture. For what the explanted tissue narrowly look like its parent tissue in vitro.
Obesity is a complex disease involving an excessive amount of body fat. Obesity isn't just a cosmetic concern. It is a medical problem that increases your risk of other diseases and health problems, such as heart disease, diabetes, high blood pressure and certain cancers.
There are many reasons why some people have difficulty avoiding obesity. Usually, obesity results from a combination of inherited factors, combined with the environment and personal diet and exercise choices.
Renewable energy
A renewable resource is a resource which can be used repeatedly and replaced naturally
Hydro energy
Wind energy
Geothermal energy-process
Geothermal plants and heat pump
Biomass energy -process
Biofuels
What is virus History of viruses Virus components How viruses act on genetic material Basic principles What is cancer TWO BASIC MECHANISMS Normal cell cycle ONCOGENES AND TUMOR SUPPRESSORGENES CONTROL THE CELL CYCLE Proto ontogenesis and normal cell division CONCEPT OF ONCOGENES
chinji zone:
by these slides you will know about the chinji zone location in siwalik hills
fossil fuels of the chinji zone
how chinji zone formation occurs
FEldspar etc...
Resources and ecological management of agricultureuog
Resources and ecological management of agriculture
Natural resources management
Agriculture resources conjoint with environment Management of agriculture
Weed management and resources
Physical factors:Temperature Rainfall Soil
Economic factors: CULTIVATED AREAS Areas having abundant production
Areas having moderate production
Less productive areas
Sugar management and resources
Physical factors: Temperature Rain fallSoil
Cultivation areas: Areas having moderate cultivation
Less productive areas
Cotton management and resources Cotton management and resources
rain fall
Soil
Economic factors
cultivation areas
TO FOLLOW THESE SLIDES you will learn about the adaptive radiations involve in evolution .
yo will learn about the parallel adaptations and its types
speciation role in the evolution
factors
key innvations
to imrove the article involving examples
Founder events
Adaptive plasticity
process of adaptive radiation
Factors promote adaptive radiations
Factors underlying adaptive radiations
defined by 0.S OSBORN
ecological space
geological
climatological
Islands
examplrs: 1.Darwin Finches 2.Cichlid fish genome -adaptive evolution, Stanford scientists
3.Anolis Lizards
Factors promote adaptive radiations
1.Generally speaking, adaptive radiations occur when new, unoccupied ecological niches become accessible to a founder population.
This can happen after a mass extinction during which the previous occupiers of those niches died out.
t can also happen when a colonizing species arrives at an island. (For instance the ancestor of the honeycreepers in Hawaii, or of Darwin's "finches" in the Galapagos)
Honey creeper
Change feeding habitat
At least 56 species of Hawaiian honeycreepers known to have existed, although all but 18 of them are now extinct.
Lack of competition. When a species enters an adaptive zone, it is poorly equipped to compete with species that have become adapted to the same niche.
For example, mudskippers are fish that are making a living on land, but they are marine fish and they don't have to compete against frogs and salamanders, which are restricted to fresh water. That is why we don't see freshwater mudskippers.
process of adaptive radiation
Ecological Release Colonization of species.
Taxon cycle
Habitat varying as population expand- species dispersal.
Adaptive plasticity Phenotypic plasticity(behavior change)
Property of an individual or genotype that may be adaptive, maladaptive or neutral with regard to an individual's fitness.
The particular way an individual's (or genotype's) phenotype varies across environments can be described as a reaction norm (Single genotype-phenotypic expression)
Speciation in adaptive radiation Founder events
in this presentation we learn about the mass spectrometery principal and its mass to charge ratio.
components of mass spectrometers .
sample inoculation and its processing. i feel these are very good slides.
I describe about what is a pollution. and what is air pollutans. Air primary pollutants.
primary pollutants how cause pollution.
primary pollutants cauiise pollution in different manners. pollution caused by these pollutants ius very svere.
these pollutants effects are very adverse on health of humans.
tomados( anything in svere condition) and man made sources causes pollution more and more.
human interrupt natural sources and cause pollution.
A brief information about the SCOP protein database used in bioinformatics.
The Structural Classification of Proteins (SCOP) database is a comprehensive and authoritative resource for the structural and evolutionary relationships of proteins. It provides a detailed and curated classification of protein structures, grouping them into families, superfamilies, and folds based on their structural and sequence similarities.
What is greenhouse gasses and how many gasses are there to affect the Earth.moosaasad1975
What are greenhouse gasses how they affect the earth and its environment what is the future of the environment and earth how the weather and the climate effects.
Slide 1: Title Slide
Extrachromosomal Inheritance
Slide 2: Introduction to Extrachromosomal Inheritance
Definition: Extrachromosomal inheritance refers to the transmission of genetic material that is not found within the nucleus.
Key Components: Involves genes located in mitochondria, chloroplasts, and plasmids.
Slide 3: Mitochondrial Inheritance
Mitochondria: Organelles responsible for energy production.
Mitochondrial DNA (mtDNA): Circular DNA molecule found in mitochondria.
Inheritance Pattern: Maternally inherited, meaning it is passed from mothers to all their offspring.
Diseases: Examples include Leber’s hereditary optic neuropathy (LHON) and mitochondrial myopathy.
Slide 4: Chloroplast Inheritance
Chloroplasts: Organelles responsible for photosynthesis in plants.
Chloroplast DNA (cpDNA): Circular DNA molecule found in chloroplasts.
Inheritance Pattern: Often maternally inherited in most plants, but can vary in some species.
Examples: Variegation in plants, where leaf color patterns are determined by chloroplast DNA.
Slide 5: Plasmid Inheritance
Plasmids: Small, circular DNA molecules found in bacteria and some eukaryotes.
Features: Can carry antibiotic resistance genes and can be transferred between cells through processes like conjugation.
Significance: Important in biotechnology for gene cloning and genetic engineering.
Slide 6: Mechanisms of Extrachromosomal Inheritance
Non-Mendelian Patterns: Do not follow Mendel’s laws of inheritance.
Cytoplasmic Segregation: During cell division, organelles like mitochondria and chloroplasts are randomly distributed to daughter cells.
Heteroplasmy: Presence of more than one type of organellar genome within a cell, leading to variation in expression.
Slide 7: Examples of Extrachromosomal Inheritance
Four O’clock Plant (Mirabilis jalapa): Shows variegated leaves due to different cpDNA in leaf cells.
Petite Mutants in Yeast: Result from mutations in mitochondrial DNA affecting respiration.
Slide 8: Importance of Extrachromosomal Inheritance
Evolution: Provides insight into the evolution of eukaryotic cells.
Medicine: Understanding mitochondrial inheritance helps in diagnosing and treating mitochondrial diseases.
Agriculture: Chloroplast inheritance can be used in plant breeding and genetic modification.
Slide 9: Recent Research and Advances
Gene Editing: Techniques like CRISPR-Cas9 are being used to edit mitochondrial and chloroplast DNA.
Therapies: Development of mitochondrial replacement therapy (MRT) for preventing mitochondrial diseases.
Slide 10: Conclusion
Summary: Extrachromosomal inheritance involves the transmission of genetic material outside the nucleus and plays a crucial role in genetics, medicine, and biotechnology.
Future Directions: Continued research and technological advancements hold promise for new treatments and applications.
Slide 11: Questions and Discussion
Invite Audience: Open the floor for any questions or further discussion on the topic.
Observation of Io’s Resurfacing via Plume Deposition Using Ground-based Adapt...Sérgio Sacani
Since volcanic activity was first discovered on Io from Voyager images in 1979, changes
on Io’s surface have been monitored from both spacecraft and ground-based telescopes.
Here, we present the highest spatial resolution images of Io ever obtained from a groundbased telescope. These images, acquired by the SHARK-VIS instrument on the Large
Binocular Telescope, show evidence of a major resurfacing event on Io’s trailing hemisphere. When compared to the most recent spacecraft images, the SHARK-VIS images
show that a plume deposit from a powerful eruption at Pillan Patera has covered part
of the long-lived Pele plume deposit. Although this type of resurfacing event may be common on Io, few have been detected due to the rarity of spacecraft visits and the previously low spatial resolution available from Earth-based telescopes. The SHARK-VIS instrument ushers in a new era of high resolution imaging of Io’s surface using adaptive
optics at visible wavelengths.
(May 29th, 2024) Advancements in Intravital Microscopy- Insights for Preclini...Scintica Instrumentation
Intravital microscopy (IVM) is a powerful tool utilized to study cellular behavior over time and space in vivo. Much of our understanding of cell biology has been accomplished using various in vitro and ex vivo methods; however, these studies do not necessarily reflect the natural dynamics of biological processes. Unlike traditional cell culture or fixed tissue imaging, IVM allows for the ultra-fast high-resolution imaging of cellular processes over time and space and were studied in its natural environment. Real-time visualization of biological processes in the context of an intact organism helps maintain physiological relevance and provide insights into the progression of disease, response to treatments or developmental processes.
In this webinar we give an overview of advanced applications of the IVM system in preclinical research. IVIM technology is a provider of all-in-one intravital microscopy systems and solutions optimized for in vivo imaging of live animal models at sub-micron resolution. The system’s unique features and user-friendly software enables researchers to probe fast dynamic biological processes such as immune cell tracking, cell-cell interaction as well as vascularization and tumor metastasis with exceptional detail. This webinar will also give an overview of IVM being utilized in drug development, offering a view into the intricate interaction between drugs/nanoparticles and tissues in vivo and allows for the evaluation of therapeutic intervention in a variety of tissues and organs. This interdisciplinary collaboration continues to drive the advancements of novel therapeutic strategies.
Seminar of U.V. Spectroscopy by SAMIR PANDASAMIR PANDA
Spectroscopy is a branch of science dealing the study of interaction of electromagnetic radiation with matter.
Ultraviolet-visible spectroscopy refers to absorption spectroscopy or reflect spectroscopy in the UV-VIS spectral region.
Ultraviolet-visible spectroscopy is an analytical method that can measure the amount of light received by the analyte.
THE IMPORTANCE OF MARTIAN ATMOSPHERE SAMPLE RETURN.Sérgio Sacani
The return of a sample of near-surface atmosphere from Mars would facilitate answers to several first-order science questions surrounding the formation and evolution of the planet. One of the important aspects of terrestrial planet formation in general is the role that primary atmospheres played in influencing the chemistry and structure of the planets and their antecedents. Studies of the martian atmosphere can be used to investigate the role of a primary atmosphere in its history. Atmosphere samples would also inform our understanding of the near-surface chemistry of the planet, and ultimately the prospects for life. High-precision isotopic analyses of constituent gases are needed to address these questions, requiring that the analyses are made on returned samples rather than in situ.
Earliest Galaxies in the JADES Origins Field: Luminosity Function and Cosmic ...Sérgio Sacani
We characterize the earliest galaxy population in the JADES Origins Field (JOF), the deepest
imaging field observed with JWST. We make use of the ancillary Hubble optical images (5 filters
spanning 0.4−0.9µm) and novel JWST images with 14 filters spanning 0.8−5µm, including 7 mediumband filters, and reaching total exposure times of up to 46 hours per filter. We combine all our data
at > 2.3µm to construct an ultradeep image, reaching as deep as ≈ 31.4 AB mag in the stack and
30.3-31.0 AB mag (5σ, r = 0.1” circular aperture) in individual filters. We measure photometric
redshifts and use robust selection criteria to identify a sample of eight galaxy candidates at redshifts
z = 11.5 − 15. These objects show compact half-light radii of R1/2 ∼ 50 − 200pc, stellar masses of
M⋆ ∼ 107−108M⊙, and star-formation rates of SFR ∼ 0.1−1 M⊙ yr−1
. Our search finds no candidates
at 15 < z < 20, placing upper limits at these redshifts. We develop a forward modeling approach to
infer the properties of the evolving luminosity function without binning in redshift or luminosity that
marginalizes over the photometric redshift uncertainty of our candidate galaxies and incorporates the
impact of non-detections. We find a z = 12 luminosity function in good agreement with prior results,
and that the luminosity function normalization and UV luminosity density decline by a factor of ∼ 2.5
from z = 12 to z = 14. We discuss the possible implications of our results in the context of theoretical
models for evolution of the dark matter halo mass function.
4. 1. At what age does a fish attain a
maturity
2. What is the perfect catchable or
mark able size of the fish
3. It helps to calculate the life span and
longevity of fish
4. It enables to estimate and compare
growth rates of fish in different
waters.
5. Good or bad growth can point out
the suitability for rearing and
stocking purposes
6. The timing of spawning migration of
given species can be worked out
Age and rate of
growth of fishes
dependence
5. Methods of age
determination
Length
frequency
method
Marking
or known
age
method
Interpretatio
n of layers
laid down in
hard part of
fishes
1. Otoliths
2. Opercula
3. Vertebra
4. Fin rays
5. scales
Identification of annual marks
Irregularities
Validity of Annuli on scales as
year marks
How to collect and clean the
scales
Reading scales
Body scale relationship
Lees phenomenon
7. 1.Length frequency method
• Peterson method by C.G Peterson 1892
• Fact
• This method is basically depends on the fact that in population
of having single spawning season the individual length of fish
of each age group tends to form a normal distribution and the
that modes of length frequency distribution of successive age
groups are separated along the length axis.
• The length frequency distribution are produced by plotting the
length of individual sampled from a population against the
number of fish( frequency of each length caught).
• Age are determined by counting the peaks.
8.
9. • The difference between age group 0 fish and age 1 fish is (49.0-
20.0)=29.0mm.
• In simply the growth in length during first year of life is 29.0mm. The
amount of growth decreases with increase in age during second year of
life from 29.0 mm to 24.0 mm.
• As seen from the graph the modal values of all three age groups of July
sample show a respective progressive trend in months of September as
well.
10. Lengths are easier to record and obtain than weights and are less
affected by length are less affected by environmental and biological
factors.
Basic requirements
1. Sample should be composed of large number of individuals
2. Sample should be good representative of all size and classes
3. Sampling should be done in restricted period of time.
But these conditions are seldom fulfilled especially most frequent
drawback in the selectivity of gear.
If we use a non-selective gear then this method fails to give a good
estimation or reliable data about older age groups because of their
increasing overlap in length distribution.
11. Disadvantage
1. Method is not suitable for small samples
2. Length frequency peaks correspond with fish up to first
two or three years only. For older fish the correlation is
very low and peaks are less distinct.
3. Many fish population particularly in tropical waters spawn
throughout years distinct years classes are therefore
difficult to be recognized in such settings
4. One or more year classes may be poorly represented or
may be absent.
12. • Satisfied for routine fisheries
• Satisfied for 2-3 years old fish and is best limited to species of
temperate waters with seasonal spawning activities.
• This method is also applied on scale less or other hard parts
where scales are not readable
• Poly modal length frequency distribution of older age groups
by normal curves by use of probability paper.
13. 2. Marking or known age method
• Basic requirements for most accurately and in positive manner
1. Keeping hatchlings or larvae of fish under under observation till
desired period in hatcheries rearing ponds tanks or aquaria.
2. Introducing fish of known age in water where the species was not
previously present
3. The growth history may be followed up
4. Marking and releasing fish in their natural environment like river
lake etc. after making its initial length and weight measurements.
5. Recaptured at intervals of time and growth.
14. Disadvantage
1. Laborious time consuming and expensive
2. Waiting for years to follow up the growth rates
3. This method is only done in confined water areas where fishes are
under control
4. Most marking and tagging methods are not applicable to young fish
5. Most of the marked fish may not be recaptured.
6. Marking affects the growth of fishes . It may decrease the growth of
fishes.
15. 3.Interpretation of layers laid down in hard parts of
fishes
• Counting annual layers(growth zones) in the hard part of fishes
• Year marks or annual rings
• These are formed in alternate slower and faster growth rates .The
faster growth rings are wider and dark in reflected light and pale in
direct light.
• While the slower growth rings are pale in reflected light while dark in
indirect light.
16. • In temperate water fishes the rings formation occur in spring season
when rapid growth is followed up after cessation period of winter so
their annual contrast of summer and winter are different.
• While in tropics , water temperature fluctuate rapidly so their rings
are not satisfied but many workers find annual rings on scales or on
hard parts. But many other estimates that these are not annual rings
these are due to fluctuation in chemical composition due to flood
supply or due to winter and summer temperature changes.
• But however they successfully find the age through scales or other
hard parts in different waters of tropical areas.
17. 1.Otolith (determine age of fishes)
• It is the calcareous part also called earstones.
• Jones (1954)
• Hynes(1964)
• Scale less
• Three pairs of otoliths in all fishes three on each side of internal ear
• Largest three Otolith called saggita used for age reading
18. Major handicaps with Otolith
• Dissection of head
• Require great skills
• Very laborious
• Great skill expertise
• Time consuming
• May need to killing fish having irregular or small Otolith
19. Method
1. Removed by pair of forceps
2. Preserved in the mixture of 90 % alcohol and 10% glycerin.
3. Rounsefell and Everhart recommend 3% solution of trisodium phosphate
as preservative.
4. To obtain translucent section it is mounted with Canada balsam on slide.
5. When Canada balsam is hardened the Otolith are grounded and polished
and wash with benzene and place coverslip after put a fresh drop of
Canada balsam to examine.
6. Transparent zones appears light while opaque zones are dark while
examine in transmitted light.
20. 2.Opercula
• The opercula bones are used for age determination by many workers like
Bardach (1955).
• Successful method
• Removed easily by twisted by figures. And put it into water and boiled for
2-3 minutes then remove body flesh and skin by cloth.
• Dry it and observe under the binocular microscope.
• Alternate opaque and translucent zones are determined.
• To observe by reflected light against dark background soak it into the xyol
in petri dish
• The opercula is obtained from freshly killed fishes because the opercula in
formalin may become disvolored.
21. Relationship between the growth and opercula
bone
• Measurement from the origin to each succeeding annulus can be
made along a imaginary line from its apical articulation to its
posterior margin .
• The origin of measurement is the Centre of articular apex and
imaginary line cut the various annular growth lines.
22.
23. 3.vertebra
• Aikawa and smith 1951
• There is concentric mark on the vertebral centra
• Ring is defined as the narrowest kind of concentric mark observed
and a band as wider concentric mark is a group of rings.
• These bands are thought to be annual in many fishes.
24. 4.Fin Rays
• Cross sections of fin rays and spines have also been found useful in
age determination.
• Boiko 1950
• Deelder and Willimse 1973
25. Method
• Cut the fin ray from near the base exactly transversely
• Polish the plane of section using a smooth hone
• Dry fin at room temperature for few days
• Embed it upside down in a piece of plasticine attached to side
examine under a microscope
• Using a low power objective and suitable source of illumination
• Alternate light and dark ring may be seen depicting periods of
summer and winter growths respectively.
26. 5.Scales
• 99 % bony fishes having cycloid and ctenoid scales used for age
determination
27. Structure of scales
• Ctenoid scales differ from cycloid scales in having ctenii ( small spines)
on the posterior margin.
• Ctenoid scales are usually found in spiny ray finned fishes
• Cycloid scales present in soft ray finned fishes
• Both has similar type of arrangement in bony fishes a typical scale
consist of outer bony striated layer gives it flexibility and elasticity
• The focus near the centre of scale is a small area which represent the
original scale of young fish
• Ridges or circulii are more or less concentric around the focus
represent the margin of which the scale is made up of.
28. Advantages
• Of all the hard structures scales are most trustworthy means of
estimating age and growth calculation
• Transparency of scales the ease of sampling them and minimal
damage to fish make them desirable to work with.
• Almost a huge amount of work has been done with scales during past
250 years .
29. Identification of annual marks
• The use of scale to identified growth depends on the formation of
growth rings called annuli.
• Its appearance is different in different species
• These are identified by change in external figure of scale
30. Identification characters
1. A zone of closely spaced ridges is followed by a zone of widely
spaced ridges
• Annulus is regarded to be the outer margin of closely spaced
ridges
• Closely spaced ridges showed slower growth
• While spaced ridges showed faster growth
2. A discontinuous ridge between two continuous ones is also
one of the criterion which identifies annual mark
31.
32. 3. Crossing over
One of the most important character which helps
identification of annual mark present on ctenoid scale formed
when cutting one or two ridges appear to cut across several
others and is usually seen on lateral side of scale more
prominently
33.
34. • 4. In some species during spawning season erosion of scales provide a
guideline for the location of annulus
• 5. when growth rings are numerous and reading age is find to get the
evidence from the transverse radii present on the anterior region of the
scale e.g. Tenualosa ilisha
35. Irregularities
• Some abnormalities or facts which makes difficult to age readings.
False annuli
Overlapping annuli
Skipped annuli
Closely spaced annuli
Fri or larval annulus
Regenerated scales
36. • 1. False annuli
In many cases accessory growth checks of false annuli have been
reported in addition to true ones. They are sometimes difficult to
distinguish from true annuli and make age determination less
accurate. Van Oosten in 1957 attribute these accessory annuli to
growth cessation due to fluctuation of temperature, food, drought,
disease, injury, spawning, starvation etc.
2. Overlapping annuli
Growth in length through one growing season is very small thus the
annulus for any given year coincides in part with that of next. One is
likely to commit error by considering the second component of double
ring as false annuli
37. • 3.Skipped annuli
The position of the annulus for one year coincides with that of
preceding year e.g. the fish does not grow during one growing season .
4. Closely spaced annuli
Growth for any given season is small and two annuli are very closed
spaced separated by only few circulii. Without growth formation one is
liable to commit mistake in identifying the outer annulus as false
annuli.
5.Fry or larval annulus
In some fishes like Roach there appears an additional ring (the so called
fry or larval) very closed and inside the first annual ring. This may be
ascribed to the event of larva changing over from planktonic to benthic
food.
38. • 6. Regenerated scales
The most common irregularly encountered during the study of scales is
regenerated scale in which clear well defined focus is replaced by an
expanded central area without any circulii or mark.
39. Validity of annuli on scales as year marks
• The reliability of age and growth information from scales or other
hard parts of body must be checked before accepting it.
• This annuli may be regarded as year mark if,
a. There is regular increase in body size correlated with an increased
number of growth rings
b. Length frequency peaks of small fish should coincide with modal
length of corresponding age groups based on scale readings
c. Scale remain constant in number and identity throughout life
d. There is constant ratio between the annual increment in the radius
of scale and the annual increment in body length
e. The annulus is formed yearly at the same time each year
40. How to collect and cleans the scales
• Envelops are used to keep scales or for recording data
Date of capture
Name of fish
Length
Weight
State of gonad
Name of collector
Type of gear used
Record
41. Key scales
• A key scale is the one which is taken from the same point on each fish
•Point
•The point is determined by count along lateral line
and then again count above and below the lateral line.
42. Method
to clean
scales
If it is spiny ray-finned fish then the scales are taken from the region of
the tip of pectoral fin
If it is soft ray-finned fish they are taken from the area between dorsal
fin and lateral line
About 10 scales from each fish are
enough and these can be removed by
the help of forceps
The scales are then temporarily stored in
envelopes
Scales may be cleaned by first soaking in
water and then by rubbing them
between two palms
43. Dry temporary mount
• Placed the scales between two slides
• The ends of slide may be pressed down with cellophane tape
• Permanent slides if desired can be made with euparol
• Wallin in 1957 has suggested that the appearance of scale can be
improved by treating with cobalt nitrate and ammonium sulphate by
staining with Alizarin red.
• Laborious method by stain
44. Reading scale
• Age determination is done by back calculations of lengths can be
accomplished most efficiently by projector or a binocular microscope
fitted with an ocular microscope.
• The age is ascertained by reading and counting annuli or year marks,
age, as determined from scales are usually expressed in Roman
numerals corresponding to number of annuli.
• So a fish having two annulus belonging to age group one annuli
belonging to group 2 and so on.
45. •Age group
•Age group refers to age in years while.
•Year class identifies the year of hatching
46. Year class can be determined by subtracting age from the
year of capture
• Example
• A fish of age group 3 captured in year 1970 belongings to 1967 year
class( the year of hatching).
47. Error
• Annulus formation dealing often extending from 2-3 months
• Particularly if fish sampling at time of annulus formation because
some fishes will have second annulus on the margin of scale while
others have not.
• So the same age fishes divided into two age groups
48. Body-scale relationship and back calculation
• From scales one can deduce the following information
1. The age of fish
2. Mean length of each age group
3. The past growth history by back calculation method
49. Scale-length relationship
• From the sample of mounted scale for each fish select a non-
regenerated scale or preferably use only key-scale
• With the help of binocular microscope fitted with ocular micrometer
measure the radius of scale which is from the centre of focus to the
margin of the scale
• Also record length the same radius from centre of each annulus
51. • The accuracy of back-calculation depends on body-scale length
relationship so that’s establish firstly
• When length of fish plotted on X against the radius on y
• Result
• (4 cases)
A. Linear with origin of zero
B. Linear but not passing through the zero but the graph cuts the
abscissa at some positive point
C. Curve linear
D. Graph may show a sigmoid curve
53. • Case A
• Scale growth is directly proportional to body growth i.e. isometric. The
length of fish corresponding to any length of scale can then by Leas
formula below
54. Case b
body length and scale length relationship is linear but not directly
proportional because graph cuts the abscissa at some positive scale
radius.
56. Case d
• If a sigmoid curve or S shaped curve is obtained by plotting the
empirical values of body length against scale radius . It may be
necessary to derive two formulae one to fit the data below the
inflection point. The formulae suggested for curve c is employed.
57. Lee phenomenon
• Character discrepancy called lees phenomenon
• This phenomenon shows that calculated lengths at the end of each
year of life decrease with each successive increase of age of the fish
upon which the calculation was based.
58. Causes for discrepancy
• Use of incorrect techniques of back calculation
• Differential natural mortality i.e. faster growing fish tend to mature
earlier than the slower growing individuals which thus constitute
most of the fish in the older age groups
• Selective sampling i.e. gears such as gill nets are selective and tend to
capture only the larger members of any given year class
• Non random sampling of the population e.g. if the sampling tends to
make more of the larger representatives the younger age groups
59. GROWTH
Types of
growth
1. Absolute growth
2. Relative growth
3. Instantaneous
growth
Factors affecting
growth factors
Walford growth
transformation
Estimation of ultimate
length from Walford
plot
Estimation of expected
length
Von bertalanffy
growth model
Length-weight
relationship
60. What is growth
• Growth is defined as increase in size over a time
• Increase in length or weight over a time
Growth
change in calories stored as somatic and reproductive
tissue
I=E+G
I=ingested food M=metabolism
E=excretion G=growth
61. Three processes encountered in energy
ingested
1. Variable amount of energy is excreted
2. Consuming during metabolism
3. Rest of stored as caloric growth
62. Factors affecting growth rate
• Temperature
• Photoperiod
• Dissolved oxygen
• Salinity
• Predation
• Parasitism
• State of maturity
• Maturation of gonads
63. Types of Growth
• Once the age is decided then the growth rate is described in number
of ways in terms of length or weight depends upon purposes of
study.
• 1. Absolute growth
• 2. Relative growth
• 3. Instantaneous growth
65. 1.Absolute growth
• When average total size of fish is plotted against each age the curve
described absolute growth.
• This curve rises slowly at first with increasing slope followed by
decreasing slope during the remainder of curve
• The point at which at which growth curve changes from increasing to
a decreasing rate is known as inflection point
• In a slightly different manner the absolute growth rate may be
demonstrated by plotting the annual increments a differences
between successive total length against age this type of curve is
known as first differential of absolute growth curve.
67. • In graph the line A represent absolute growth plotted as regression of
length on age or average length of each age group
• The line B is drawn by plotting the annual increments or differences
between the successive length against age
70. Difference between absolute and relative growth
• The relative growth may also be demonstrated by either of the two
curves
• The line A exhibits the logarithm of lengths against age while line B is
drawn by plotting percentage yearly increase against time or age.
• When logarithm of length is plotted the curve rises sharply but the
slope continually declines throughout life.
71. • The main difference in absolute and relative treatment of growth
comes in early life since the slow growth of old age differs very little
weather regarded from absolute or relative point of view
• The absolute growth of young fish is slow in early part of life but it
increases constantly up to inflection point after which it gradually and
constantly decline whereas relative growth is most rapid at the
youngest ages and afterwards drop constantly like absolute growth as
seen from examples above absolute growth from age 1 to age 2 in 37
mm
• While from age 2-3 it is 34 mm
72. • Thus as regards absolute growth two values are practically the same
but from the view point of the relative growth there is a vast
difference
• On the first case it is 61.0 % while in later it is 35.0%
• The most important difference between the two view points
therefore relates to the rate of growth
73. 3.Instantaneous growth
• Measure the growth rate of fish by measuring its length or weight at
regular intervals the difference over a given time being measure of its
growth.
• It is not able to compare the growth of two fishes
74. It is mostly used in connection with weights because
weights tend to increase exponentially.
75. • The determination of instantaneous growth rate help in ascertaining
both general and specific principles of growth of individual species
and of intra specific groups
• In our example instantaneous growth rate between age 2 and 3 is
• Growth characteristic
76. Walford growth transformation
• 1964
• Graphical representation of length at age n and along X axis with
length at age n+1 along Y-axis yielded a straight line for several
species of fish studied by him
• He regards this line as transformation of growth curves or WALFORD
PLOTT
•
77. Advantages
• The Walford plot is useful in number of ways
• It provides means for estimating growth parameters
• It can yield an estimate of ultimate length or weight
• it can be used to generate growth information to ages which may not
be readable from scales or other bones
80. Estimation of ultimate length from Walford plot
• The length at which there is no further growth
• Called Length of infinity
• Denoted by Lα
• That is the theoretical length beyond which no further growth of
fishes occur
• Asymptotic or ultimate length is
Lα=intercept1-slope
82. Estimation of expected length
• For used to unfold growth information to the future ages
• Which may not readable from scales or bony parts
• Thus if length at age 1 and 2are known but scales of fish beyond 3 years not
readable the same can be generated from walford plots the walford line may be
drawn taking two points taking the length at age 3 as the point on x axis drop a
perpendicular line on walford line and then on y axis the point on y axis provide
length at age 4 similarly the estimated length at age 4 may be taken as a point on
x axis and the expected length at age 5 may be read on y axis
83. Van bertalanffy model
• Fishery management
• Know the growth rates of fishes
The fish grows towards some theoretical maximum
length or weight and the growth rate declines as the fish
reaches its ultimate length.
84.
85. • Straight graph with a slope less than 1.0 Von Bnertalanffy fit the data
best
• Slope=e*
• Natural log with Walford plot with sign changed provide an estimate
of growth coefficient K
• The ultimate length or weight point is determined where growth
curve intersect at 45 degree through the zero point
Lα=intercept1-slope
86. • The 𝑡0 may be estimated from the growth equation after estimation
of K and Lα have been made