Download as PDF, PPTX
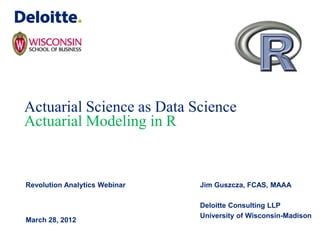


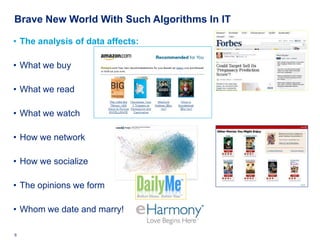
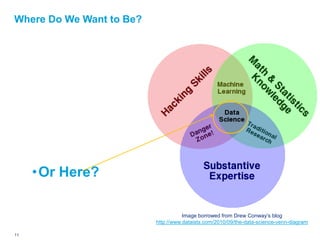
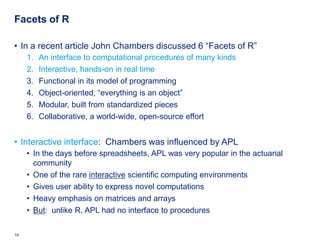
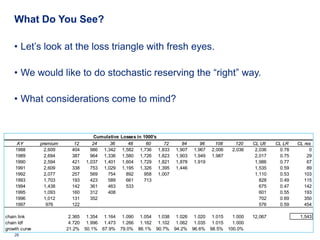
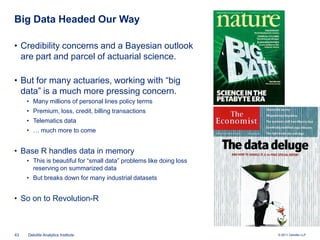
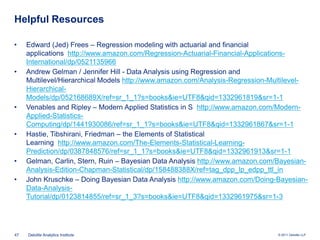
![At the Center of It All: Data Science
Or: “The Collision between Statistics and Computation”
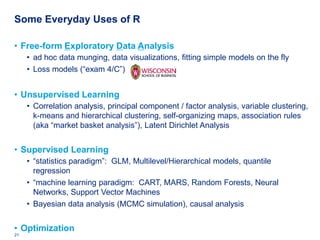
• Today the analytics world is
different largely due to
exponential growth in
computing power.
• The skill set underlying
business analytics is
increasingly called
data science.
• Data science goes beyond:
• Traditional statistics
• Business intelligence [BI]
Image borrowed from Drew Conway’s blog
• Information technology http://www.dataists.com/2010/09/the-data-science-venn-diagram
9 Deloitte Analytics Institute © 2010 Deloitte LLP](https://image.slidesharecdn.com/actuarialmodelinginrguszczafinal-120328160626-phpapp02/85/Actuarial-Analytics-in-R-9-320.jpg)
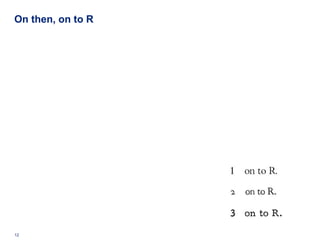

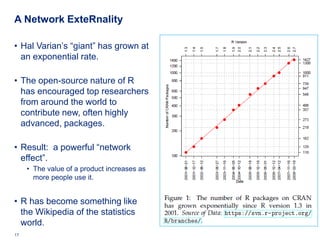

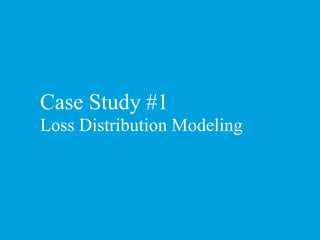

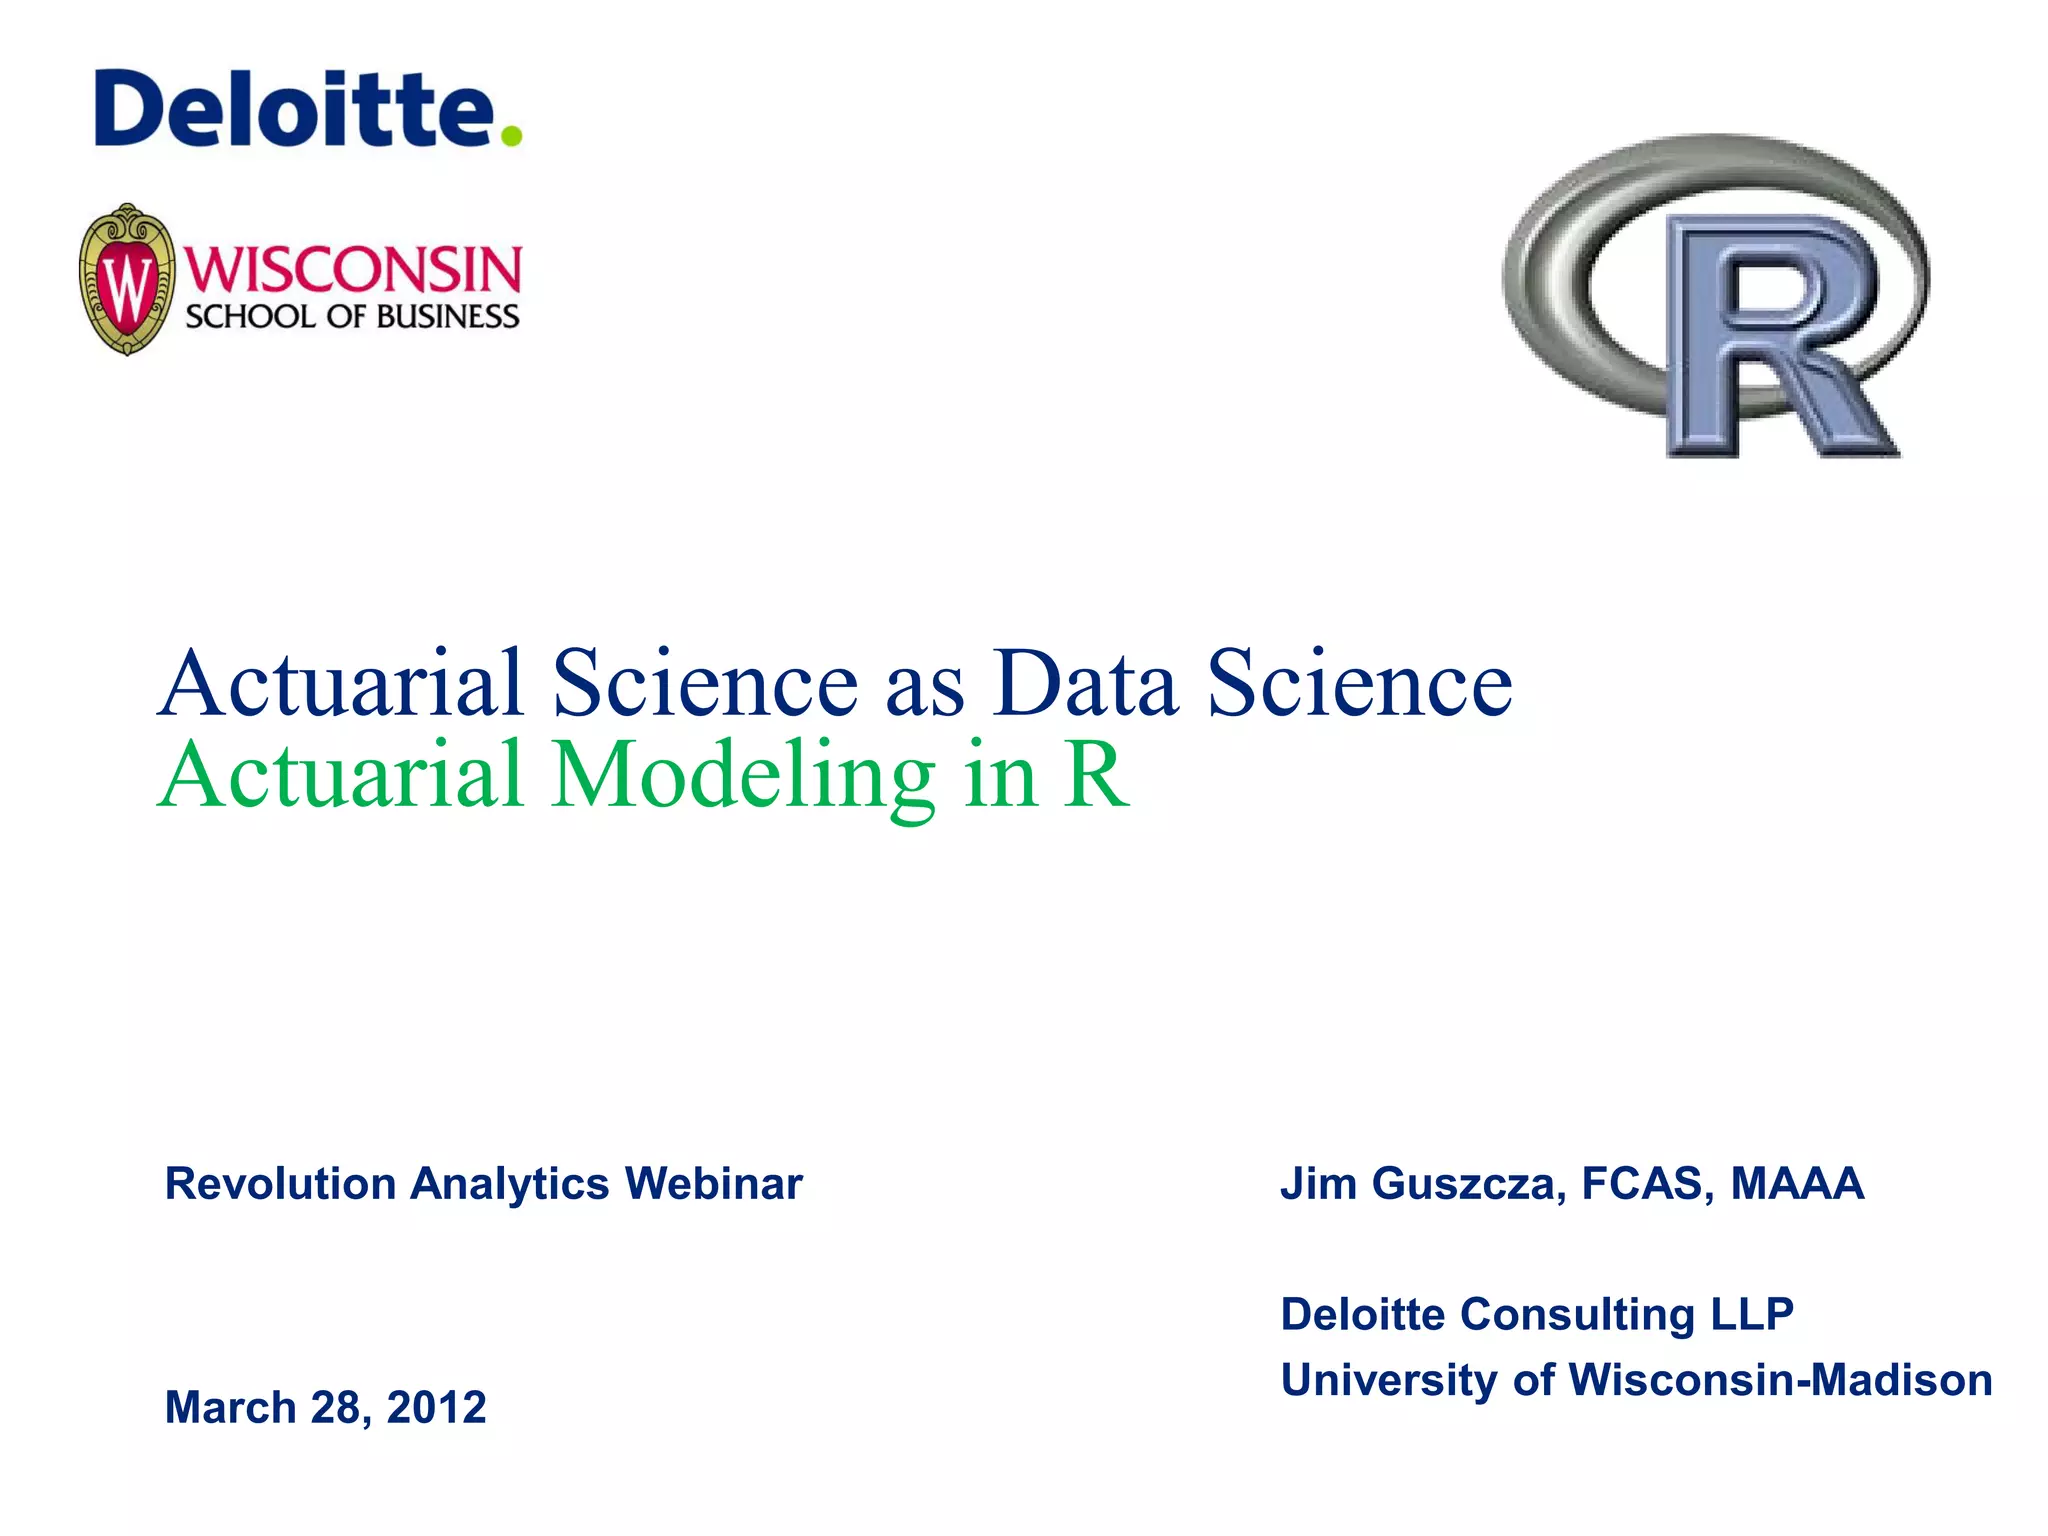
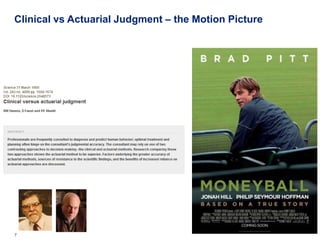
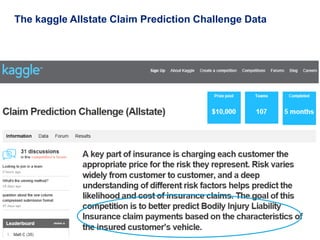
![Workers Comp Ratemaking
• We have 7 years of Workers Comp data
• Data from Klugman [1992 Bayes book]
• 128 workers comp classes (types of business)
• 7 years of summarized data
• Given: total payroll, claim count by class
• (payroll is a measure of “exposure” in this domain)
• Problem: use years 1-6 data to predict year 7
31 Deloitte Analytics Institute © 2010 Deloitte LLP](https://image.slidesharecdn.com/actuarialmodelinginrguszczafinal-120328160626-phpapp02/85/Actuarial-Analytics-in-R-31-320.jpg)
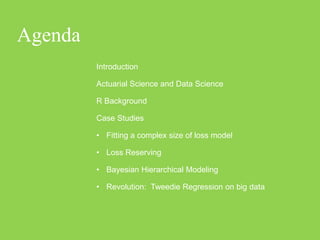
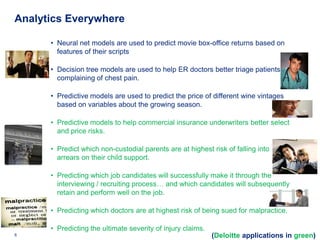
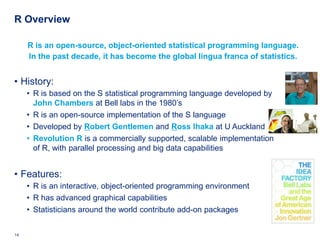
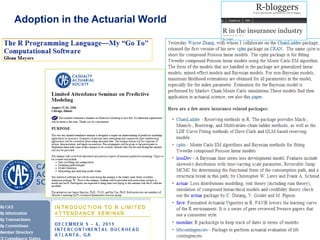
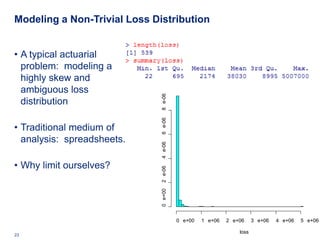
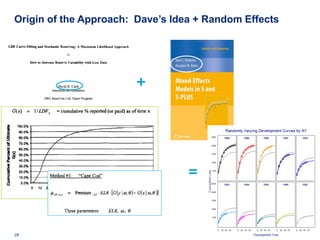
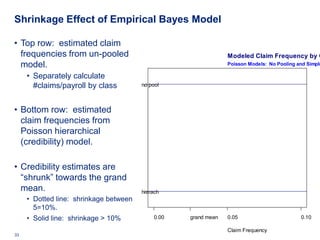
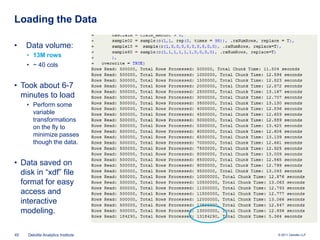
![Empirical Bayes “Credibility” Approach
• Naïve approach:
• Calculate average year 1-6 claim frequency by class
• Use these 128 averages as estimates for year 7.
• Better approach: build empirical Bayes hierarchical model.
• “Bühlmann-Straub credibility model”
• “Shrinks” low-credibility classes towards the grand mean
• Use Douglas Bates’ lme4 package (UW-Madison again!)
clmcnti ~ Poi ( payrolli λ j[ i ] )
(
λ j ~ N µλ , σ λ
2
)
32 Deloitte Analytics Institute © 2010 Deloitte LLP](https://image.slidesharecdn.com/actuarialmodelinginrguszczafinal-120328160626-phpapp02/85/Actuarial-Analytics-in-R-32-320.jpg)
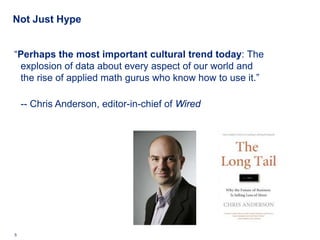
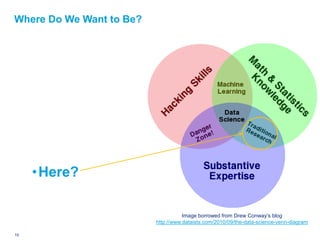
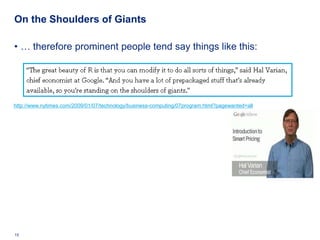
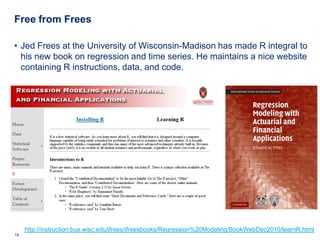
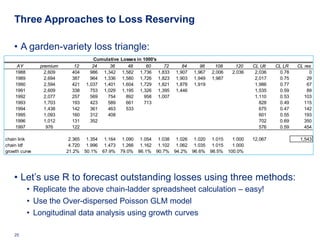
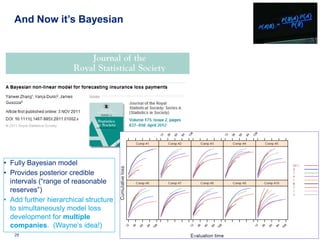
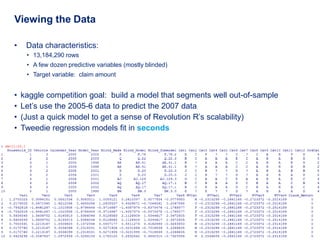
![clmcnti ~ Poi ( payrolli λ j[ i ] )
Now Specify a Fully Bayesian Model (
λ j ~ N µλ , σ λ
2
)
• Here we specify a fully Bayesian model.
• Use the rjags package
• JAGS: Just Another Gibbs Sampler
• We’re standing on the shoulders of giants named David Spiegelhalter, Martyn Plummer, …
34 Deloitte Analytics Institute © 2010 Deloitte LLP](https://image.slidesharecdn.com/actuarialmodelinginrguszczafinal-120328160626-phpapp02/85/Actuarial-Analytics-in-R-34-320.jpg)
![clmcnti ~ Poi ( payrolli λ j[ i ] )
Now Specify a Fully Bayesian Model (
λ j ~ N µλ , σ λ
2
)
• Here we specify a fully Bayesian model.
• Poisson regression with an offset
35 Deloitte Analytics Institute © 2010 Deloitte LLP](https://image.slidesharecdn.com/actuarialmodelinginrguszczafinal-120328160626-phpapp02/85/Actuarial-Analytics-in-R-35-320.jpg)
![clmcnti ~ Poi ( payrolli λ j[ i ] )
Now Specify a Fully Bayesian Model (
λ j ~ N µλ , σ λ
2
)
• Here we specify a fully Bayesian model.
• Allow for overdispersion
36 Deloitte Analytics Institute © 2010 Deloitte LLP](https://image.slidesharecdn.com/actuarialmodelinginrguszczafinal-120328160626-phpapp02/85/Actuarial-Analytics-in-R-36-320.jpg)
![clmcnti ~ Poi ( payrolli λ j[ i ] )
Now Specify a Fully Bayesian Model (
λ j ~ N µλ , σ λ
2
)
• Here we specify a fully Bayesian model.
• Allow for overdispersion
37 Deloitte Analytics Institute © 2010 Deloitte LLP](https://image.slidesharecdn.com/actuarialmodelinginrguszczafinal-120328160626-phpapp02/85/Actuarial-Analytics-in-R-37-320.jpg)
![clmcnti ~ Poi ( payrolli λ j[ i ] )
Now Specify a Fully Bayesian Model (
λ j ~ N µλ , σ λ
2
)
• Here we specify a fully Bayesian model.
• “Credibility weighting” (aka shrinkage) results from giving class-level intercepts
a probability sub-model.
38 Deloitte Analytics Institute © 2010 Deloitte LLP](https://image.slidesharecdn.com/actuarialmodelinginrguszczafinal-120328160626-phpapp02/85/Actuarial-Analytics-in-R-38-320.jpg)
![clmcnti ~ Poi ( payrolli λ j[ i ] )
Now Specify a Fully Bayesian Model (
λ j ~ N µλ , σ λ
2
)
• Here we specify a fully Bayesian model.
• Put a diffuse prior on all of the hyperparameters
• Fully Bayesian model
• Bayes or Bust!
39 Deloitte Analytics Institute © 2010 Deloitte LLP](https://image.slidesharecdn.com/actuarialmodelinginrguszczafinal-120328160626-phpapp02/85/Actuarial-Analytics-in-R-39-320.jpg)
![clmcnti ~ Poi ( payrolli λ j[ i ] )
Now Specify a Fully Bayesian Model (
λ j ~ N µλ , σ λ
2
)
• Here we specify a fully Bayesian model.
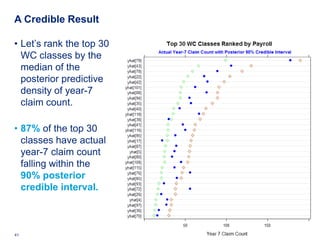
• Replace year-7 actual values with missing values
• We model the year-7 results … produce 128 posterior density estimates
• Can compare actual claims with Bayesian posterior probabilities
40 Deloitte Analytics Institute © 2010 Deloitte LLP](https://image.slidesharecdn.com/actuarialmodelinginrguszczafinal-120328160626-phpapp02/85/Actuarial-Analytics-in-R-40-320.jpg)

The document discusses the intersections of actuarial science and data science, particularly how advancements in data analytics can enhance predictive modeling in the insurance sector. It highlights the capabilities of R, an open-source statistical programming language, in various actuarial applications such as loss reserving and complex modeling. Additionally, it covers case studies demonstrating the practical use of R in loss distribution modeling, hierarchical Bayesian modeling, and empirical Bayes methods in workers' compensation ratemaking.


![Uvod u R za Data Science :: Sesija 1 [Intro to R for Data Science :: Session 1]](https://cdn.slidesharecdn.com/ss_thumbnails/intrordatasciencesession1-160429163447-thumbnail.jpg?width=640&height=640&fit=bounds)


![Big Data [sorry] & Data Science: What Does a Data Scientist Do?](https://cdn.slidesharecdn.com/ss_thumbnails/dslatcloudmsevent20130125-130126065651-phpapp01-thumbnail.jpg?width=640&height=640&fit=bounds)