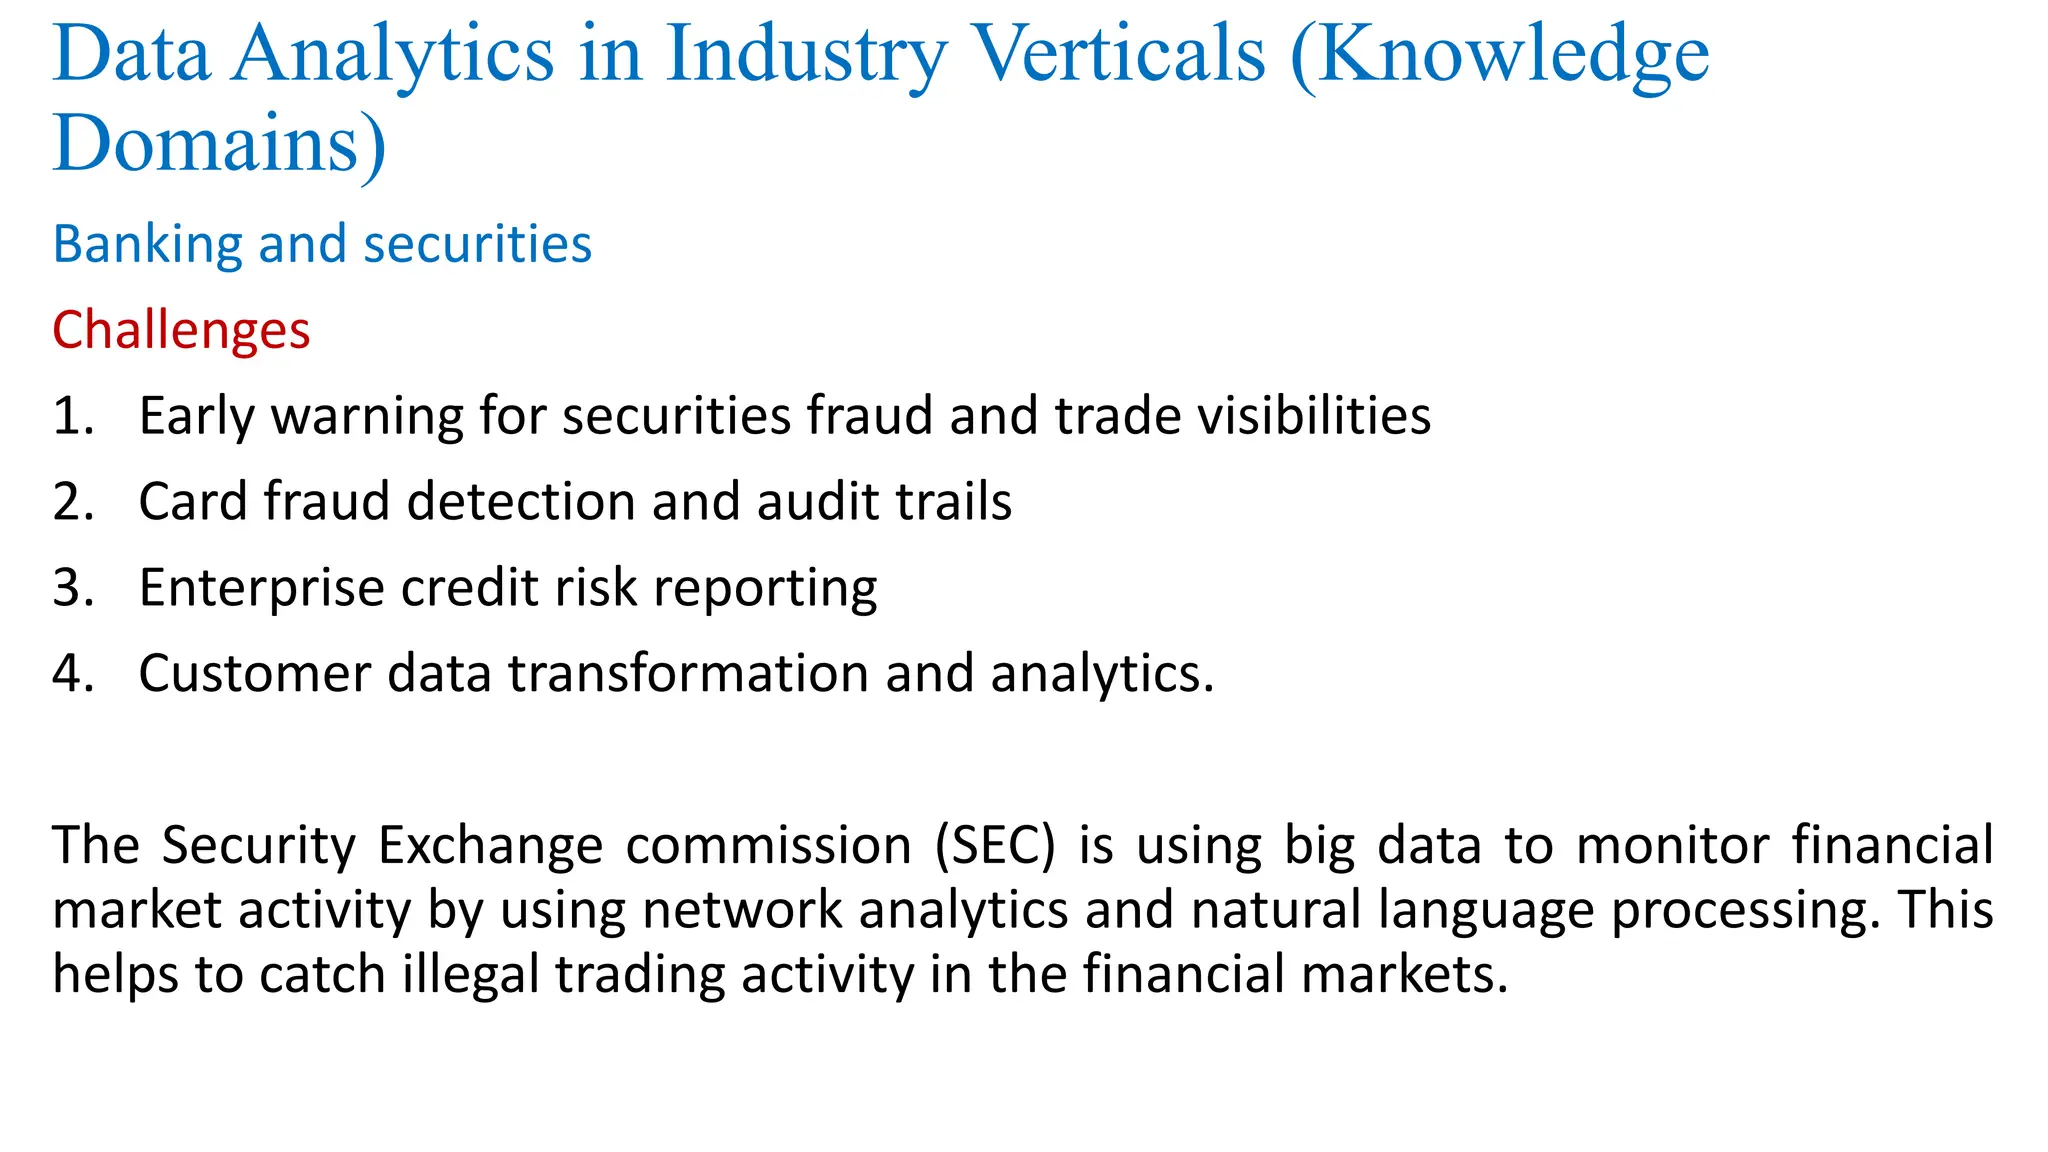
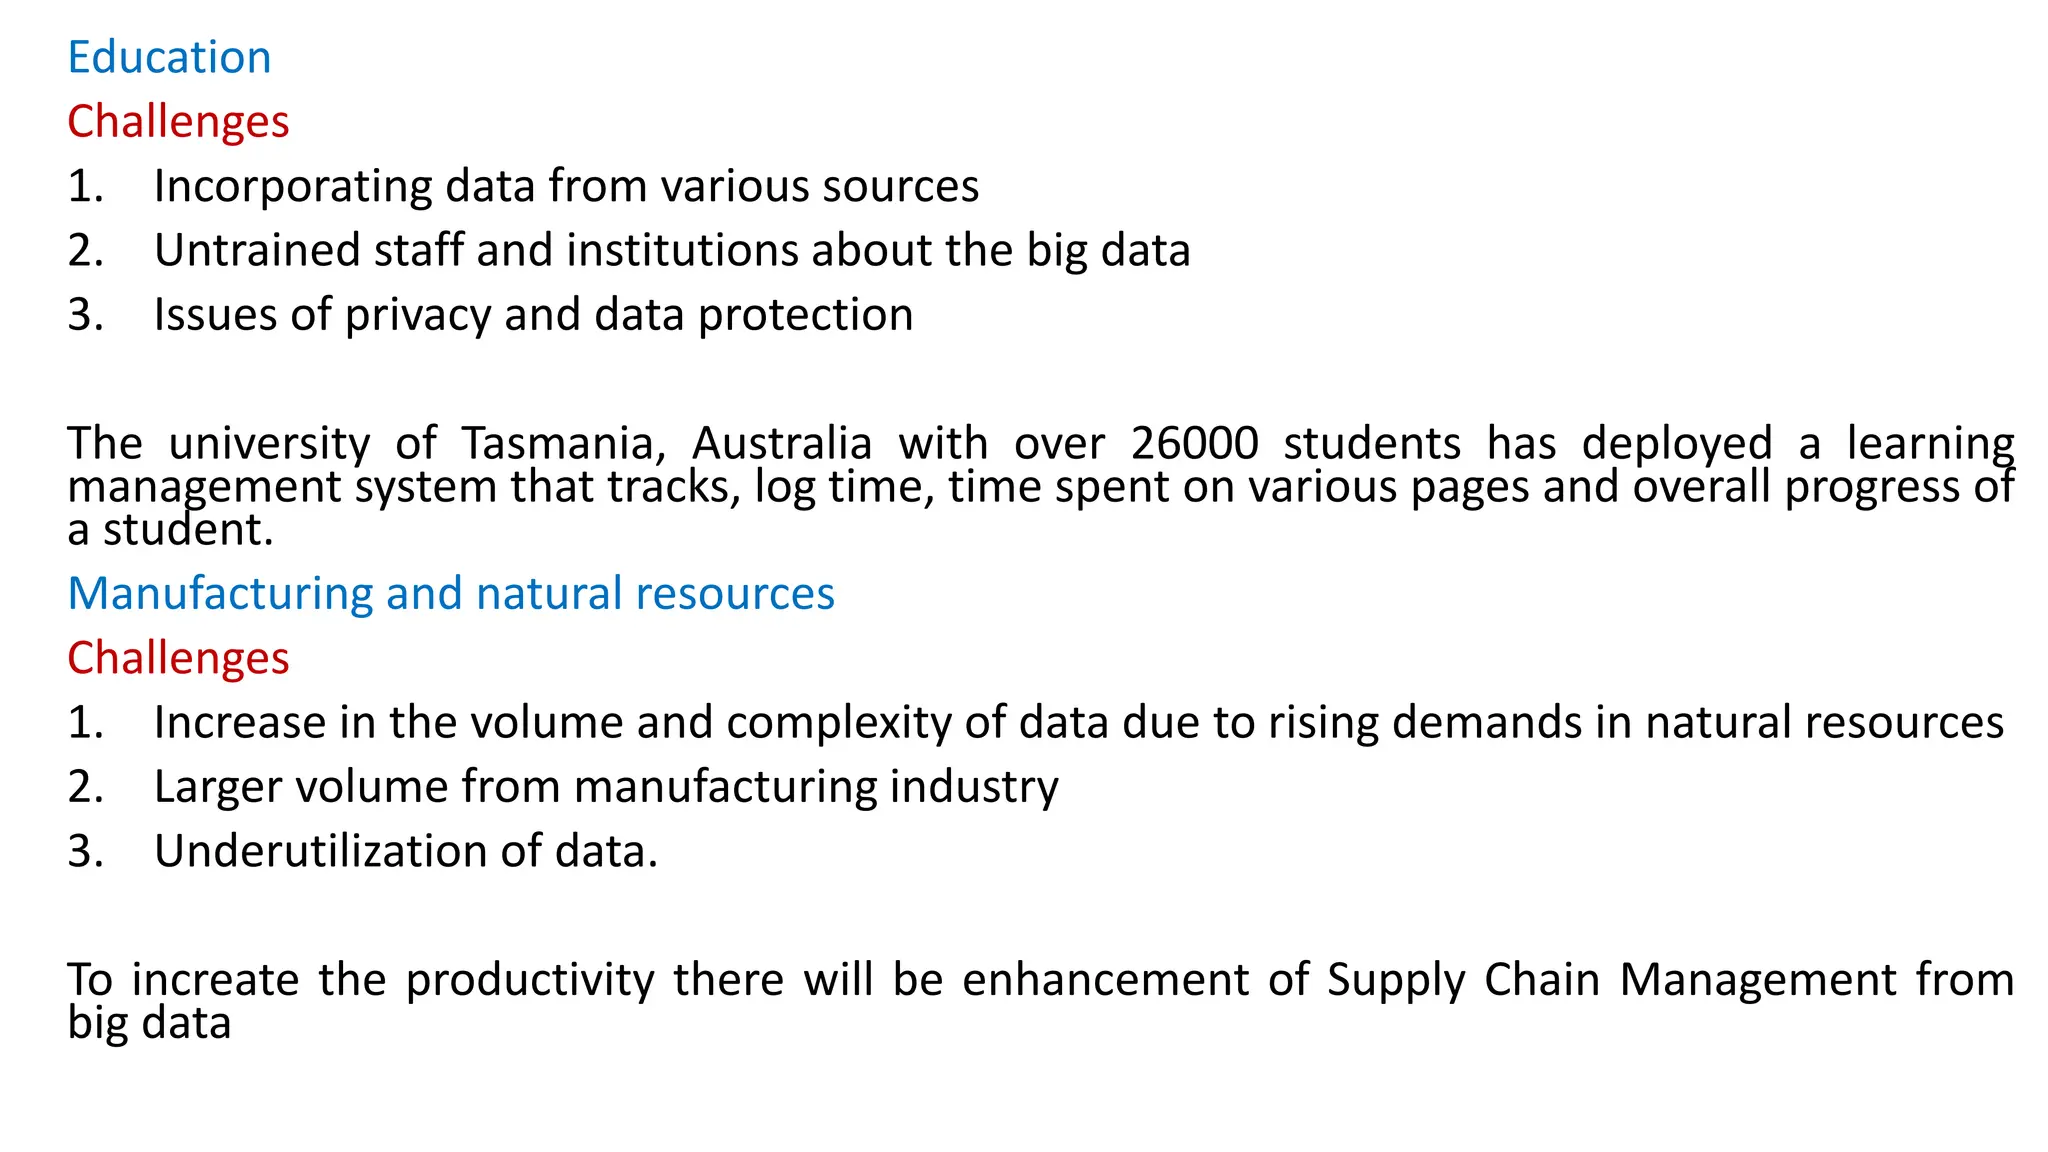
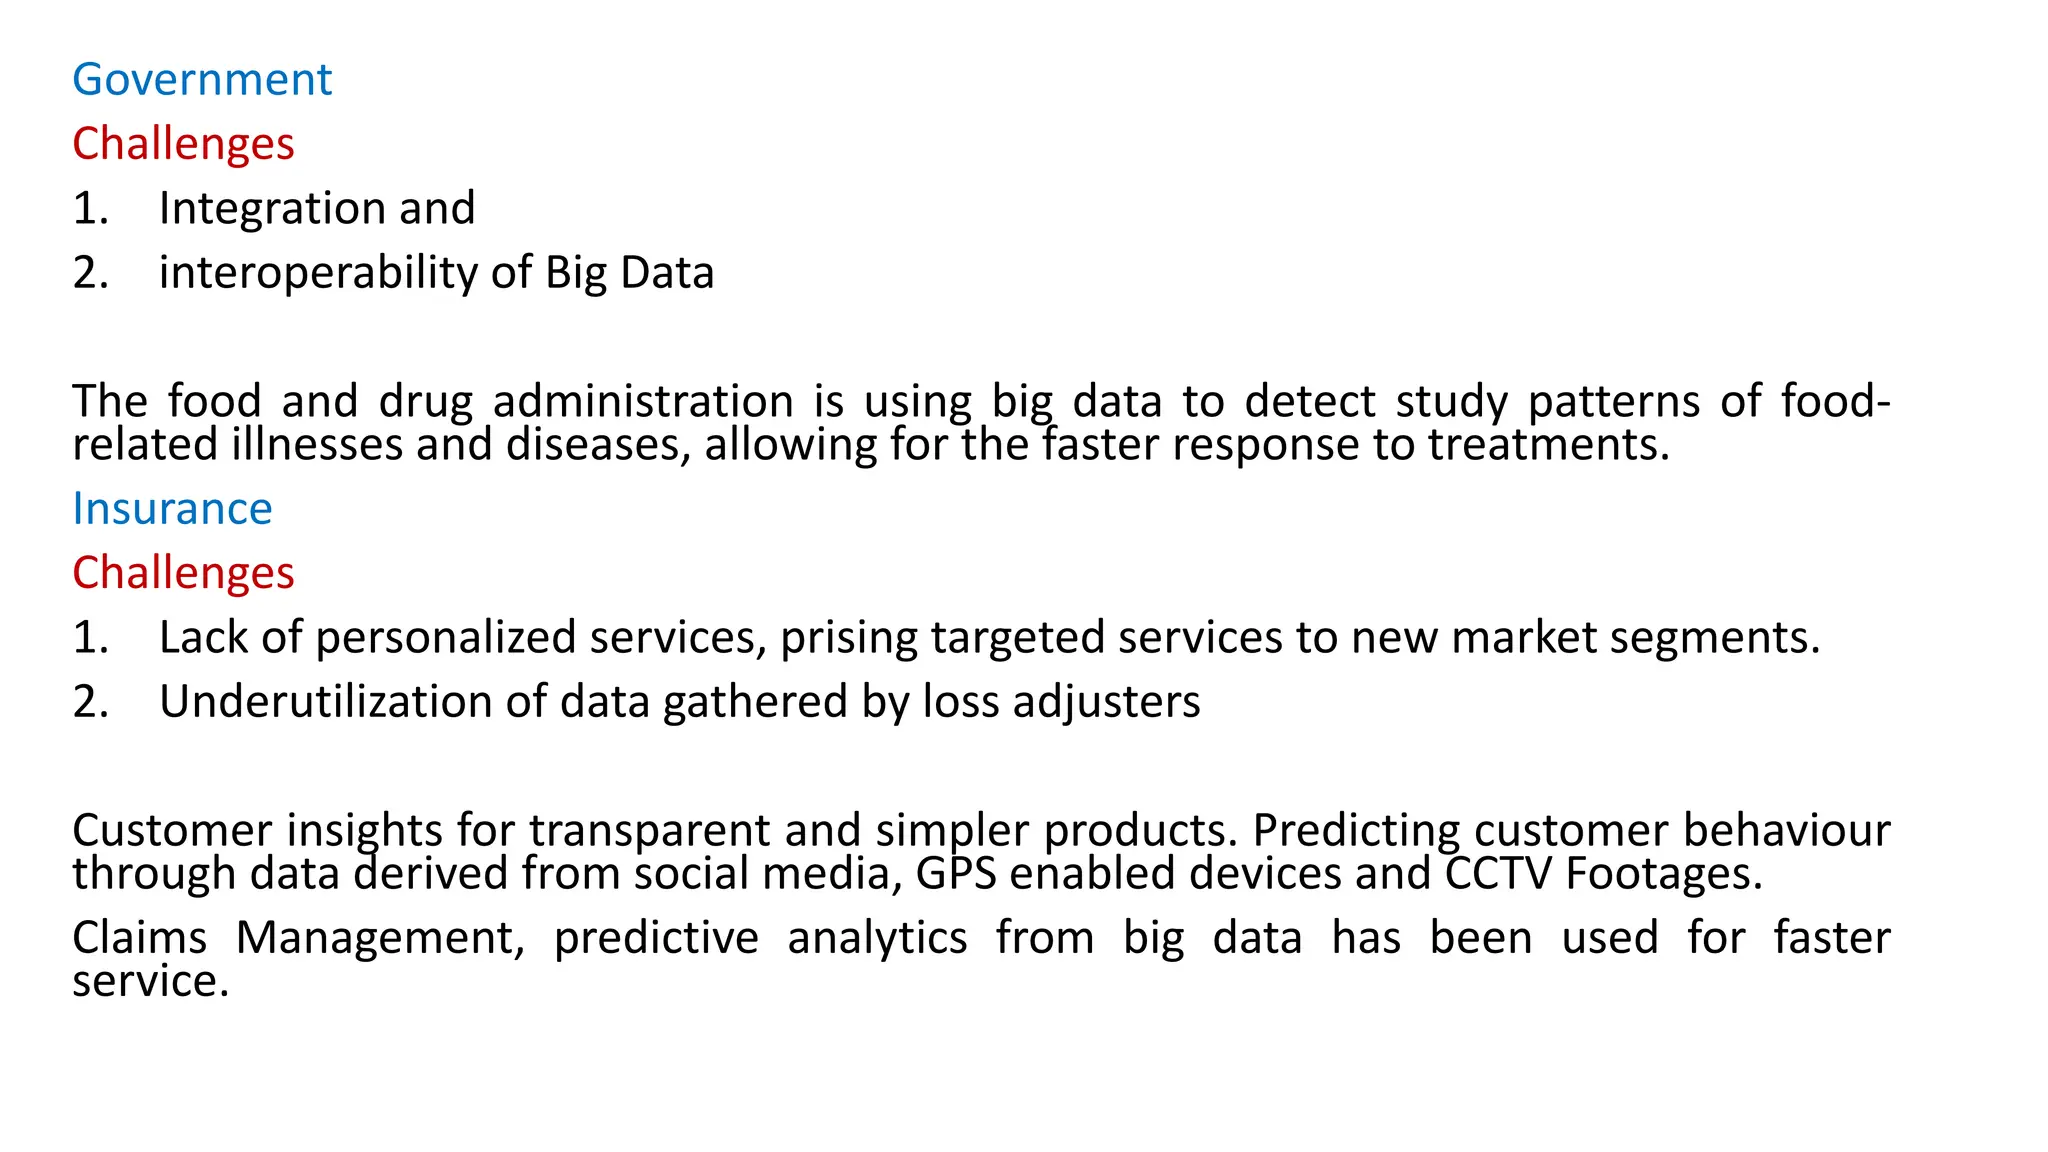
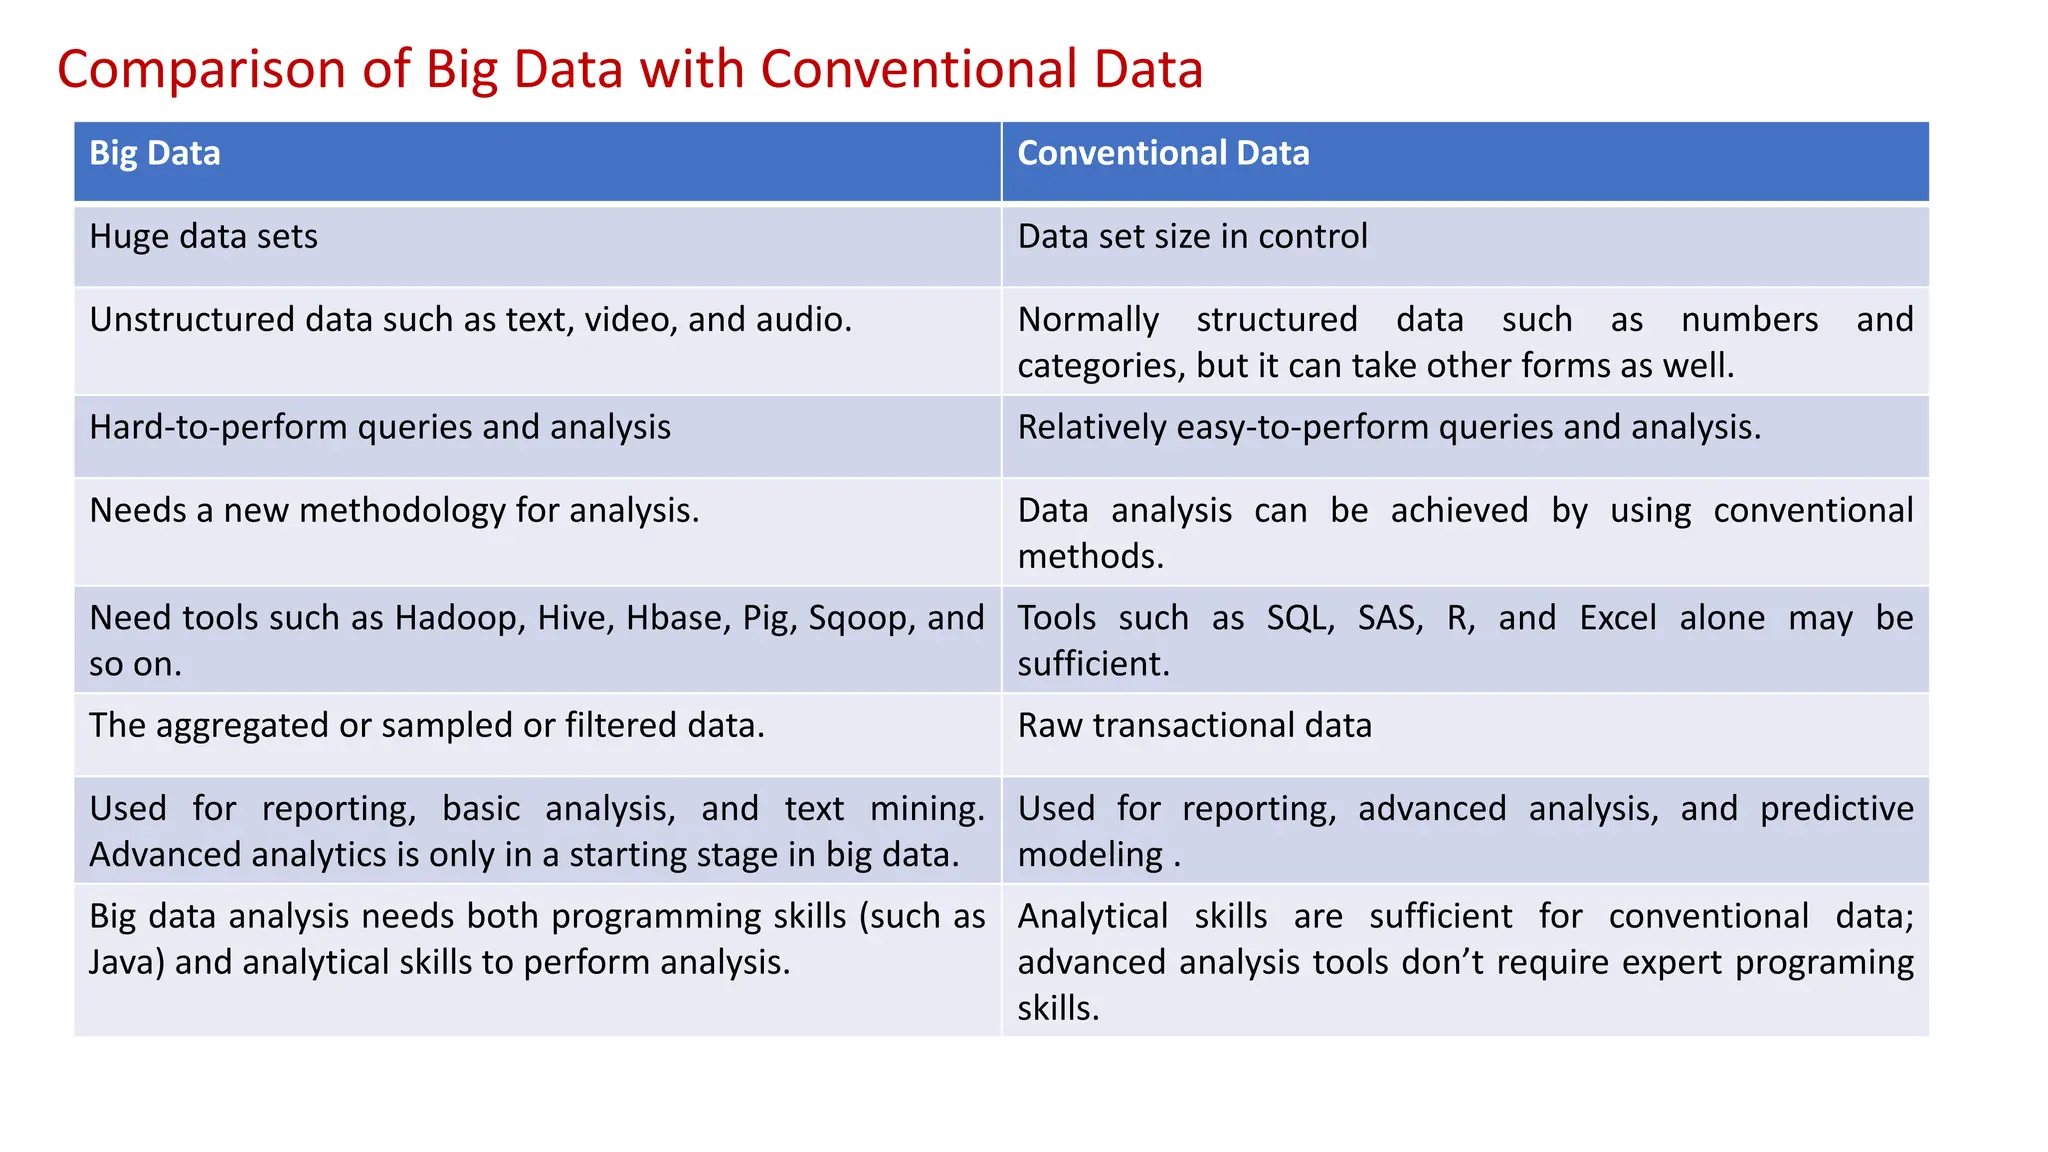
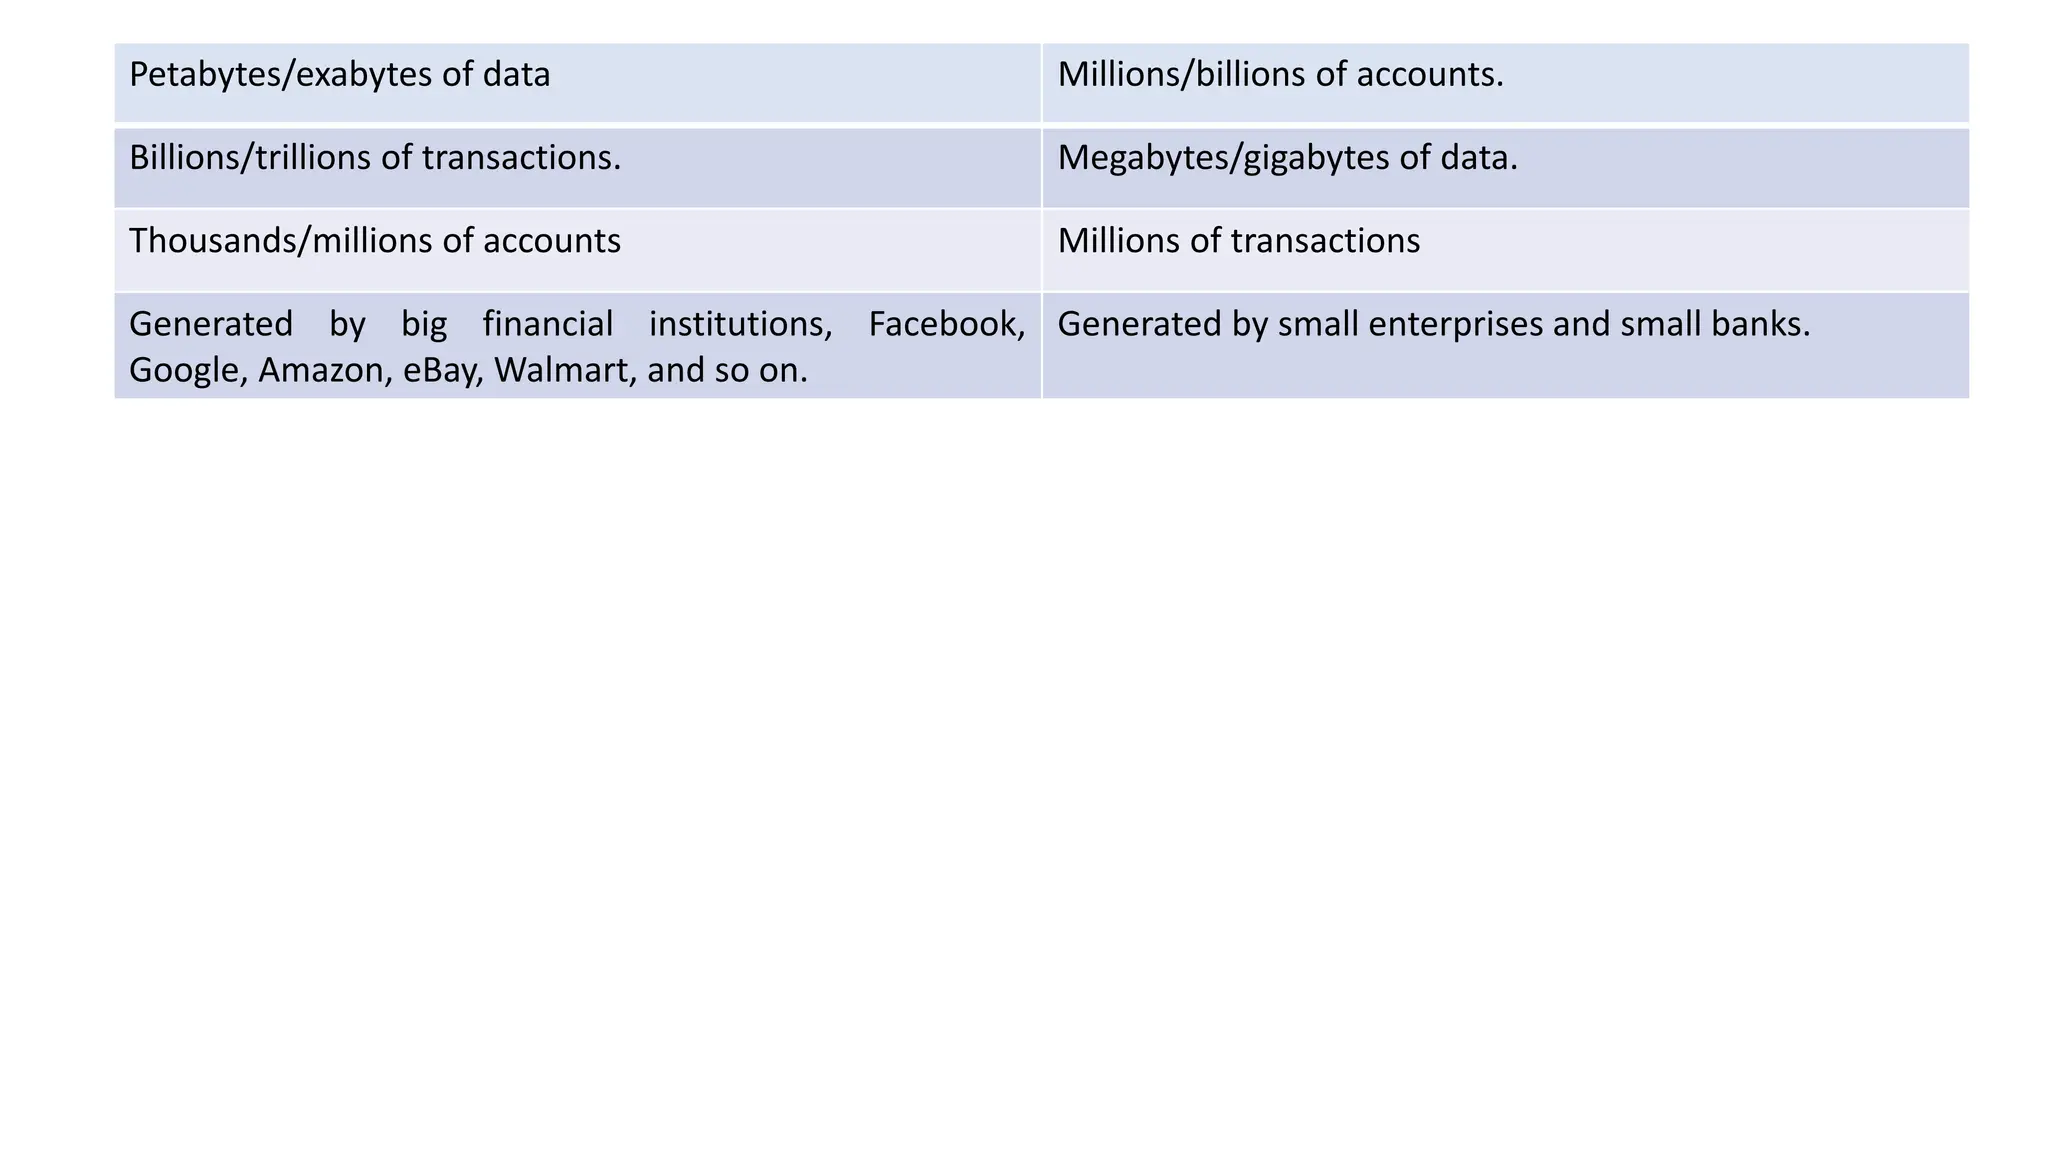
Banking and securities
Challenges
Early warning for securities fraud and trade visibilities
Card fraud detection and audit trails
Enterprise credit risk reporting
Customer data transformation and analytics.
The Security Exchange commission (SEC) is using big data to monitor financial market activity by using network analytics and natural language processing. This helps to catch illegal trading activity in the financial markets.
The Data Analytics Lifecycle is designed specifically for Big Data problems and data science projects. The lifecycle has six phases, and project work can occur in several phases at once. For most phases in the lifecycle, the movement can be either forward or backward. This iterative depiction of the lifecycle is intended to more closely portray a real project, in which aspects of the project move forward and may return to earlier stages as new information is uncovered and team members learn more about various stages of the project. This enables participants to move iteratively through the process and drive toward operationalizing the project work.
Phase 1—Discovery: In Phase 1, the team learns the business domain, including relevant history such as whether the organization or business unit has attempted similar projects in the past from which they can learn. The team assesses the resources available to support the project in terms of people, technology, time, and data. Important activities in this phase include framing the business problem as an analytics challenge that can be addressed in subsequent phases and formulating initial hypotheses (IHs) to test and begin learning the data.
Phase 2—Data preparation: Phase 2 requires the presence of an analytic sandbox, in which the team can work with data and perform analytics for the duration of the project. The team needs to execute extract, load, and transform (ELT) or extract, transform and load (ETL) to get data into the sandbox. The ELT and ETL are sometimes abbreviated as ETLT. Data should be transformed in the ETLT process so the team can work with it and analyze it. In this phase, the team also needs to familiarize itself with the data thoroughly and take steps to condition the data.
Artificial Intelligence In Microbiology by Dr. Prince C P
Data Analytics in Industry Verticals, Data Analytics Lifecycle, Challenges of Conventional Systems (1).pptx
1. Data Analytics in Industry
Verticals, Data Analytics
Lifecycle, Challenges of
Conventional Systems
Presented By :
Aditya Joshi
Assistant Professor
Graphic Era Deemed to be University, Dehradun
2. Data Analytics in Industry Verticals (Knowledge
Domains)
Banking and securities
Challenges
1. Early warning for securities fraud and trade visibilities
2. Card fraud detection and audit trails
3. Enterprise credit risk reporting
4. Customer data transformation and analytics.
The Security Exchange commission (SEC) is using big data to monitor financial
market activity by using network analytics and natural language processing. This
helps to catch illegal trading activity in the financial markets.
3. Communication media and entertainment
Challenges
1. Collecting, analysing and utilizing customer insights.
2. Leveraging mobile and social media content.
3. Understanding pattern of real time, media content usage.
Wimbledon championships leverages big data to deliver detailed sentiment analysis on tennis
matches to TV, mobile and web users to real time.
Healthcare providers
Challenges
1. Rising medical costs
2. Unavailability/ inadequate/ unusable data
Free public health data and google maps have been used by university to create visual data
that allows for faster identification and efficient analysis for health care information used in
tracking the spread of chronic disease.
4. Education
Challenges
1. Incorporating data from various sources
2. Untrained staff and institutions about the big data
3. Issues of privacy and data protection
The university of Tasmania, Australia with over 26000 students has deployed a learning
management system that tracks, log time, time spent on various pages and overall progress of
a student.
Manufacturing and natural resources
Challenges
1. Increase in the volume and complexity of data due to rising demands in natural resources
2. Larger volume from manufacturing industry
3. Underutilization of data.
To increate the productivity there will be enhancement of Supply Chain Management from
big data
5. Government
Challenges
1. Integration and
2. interoperability of Big Data
The food and drug administration is using big data to detect study patterns of food-
related illnesses and diseases, allowing for the faster response to treatments.
Insurance
Challenges
1. Lack of personalized services, prising targeted services to new market segments.
2. Underutilization of data gathered by loss adjusters
Customer insights for transparent and simpler products. Predicting customer behaviour
through data derived from social media, GPS enabled devices and CCTV Footages.
Claims Management, predictive analytics from big data has been used for faster
service.
6. Retail and whole sale trade
Challenges
1. Unutilized data derived form customer loyalty cards. POS Scanners, RFID’s
Optimized staffing through data from Shopping patterns, local events etc.
Reduced fraud and timely analysis of inventory.
Transportation
Challenges
1. Data from location based social networks and high speed data from telecoms have
effected travel behaviour.
2. Transport demand models are still based on poorly understood new social media
structures.
Traffic control, route planning, intelligent transport systems, congestion management by
predicting traffic conditions
Route planning to save fuel and time, for travel arrangement in tourism.
7. Data Analytics Lifecycle
The Data Analytics Lifecycle is designed specifically for Big Data problems and
data science projects. The lifecycle has six phases, and project work can occur in
several phases at once. For most phases in the lifecycle, the movement can be
either forward or backward. This iterative depiction of the lifecycle is intended
to more closely portray a real project, in which aspects of the project move
forward and may return to earlier stages as new information is uncovered and
team members learn more about various stages of the project. This enables
participants to move iteratively through the process and drive toward
operationalizing the project work.
8.
9. • Phase 1—Discovery: In Phase 1, the team learns the business domain,
including relevant history such as whether the organization or business unit
has attempted similar projects in the past from which they can learn. The team
assesses the resources available to support the project in terms of people,
technology, time, and data. Important activities in this phase include framing
the business problem as an analytics challenge that can be addressed in
subsequent phases and formulating initial hypotheses (IHs) to test and begin
learning the data.
• Phase 2—Data preparation: Phase 2 requires the presence of an analytic
sandbox, in which the team can work with data and perform analytics for the
duration of the project. The team needs to execute extract, load, and
transform (ELT) or extract, transform and load (ETL) to get data into the
sandbox. The ELT and ETL are sometimes abbreviated as ETLT. Data should be
transformed in the ETLT process so the team can work with it and analyze it. In
this phase, the team also needs to familiarize itself with the data thoroughly
and take steps to condition the data.
10. • Phase 3—Model planning: Phase 3 is model planning, where the team
determines the methods, techniques, and workflow it intends to follow for the
subsequent model building phase. The team explores the data to learn about
the relationships between variables and subsequently selects key variables
and the most suitable models.
• Phase 4—Model building: In Phase 4, the team develops datasets for testing,
training, and production purposes. In addition, in this phase the team builds
and executes models based on the work done in the model planning phase.
The team also considers whether its existing tools will suffice for running the
models, or if it will need a more robust environment for executing models and
workflows (for example, fast hardware and parallel processing, if applicable).
11. • Phase 5—Communicate results: In Phase 5, the team, in collaboration with
major stakeholders, determines if the results of the project are a success or a
failure based on the criteria developed in Phase 1. The team should identify
key findings, quantify the business value, and develop a narrative to
summarize and convey findings to stakeholders.
• Phase 6—Operationalize: In Phase 6, the team delivers final reports, briefings,
code, and technical documents. In addition, the team may run a pilot project
to implement the models in a production environment.
12. Challenges of Conventional Systems
What is Conventional System?
• The system consists of one or more zones each having either manually
operated call points or automatic detection devices, or a combination of
both.
• Big data is huge amount of data which is beyond the processing capacity of
conventional data base systems to manage and analyze the data in a specific
time interval.
13. Difference between conventional computing and intelligent computing
• The conventional computing functions logically with a set of rules and
calculations while the neural computing can function via images, pictures,
and concepts.
• Conventional computing is often unable to manage the variability of data
obtained in the real world.
• On the other hand, neural computing, like our own brains, is well suited to
situations that have no clear algorithmic solutions and are able to manage
noisy imprecise data. This allows them to excel in those areas that
conventional computing often finds difficult.
14. Comparison of Big Data with Conventional Data
Big Data Conventional Data
Huge data sets Data set size in control
Unstructured data such as text, video, and audio. Normally structured data such as numbers and
categories, but it can take other forms as well.
Hard-to-perform queries and analysis Relatively easy-to-perform queries and analysis.
Needs a new methodology for analysis. Data analysis can be achieved by using conventional
methods.
Need tools such as Hadoop, Hive, Hbase, Pig, Sqoop, and
so on.
Tools such as SQL, SAS, R, and Excel alone may be
sufficient.
The aggregated or sampled or filtered data. Raw transactional data
Used for reporting, basic analysis, and text mining.
Advanced analytics is only in a starting stage in big data.
Used for reporting, advanced analysis, and predictive
modeling .
Big data analysis needs both programming skills (such as
Java) and analytical skills to perform analysis.
Analytical skills are sufficient for conventional data;
advanced analysis tools don’t require expert programing
skills.
15. Petabytes/exabytes of data Millions/billions of accounts.
Billions/trillions of transactions. Megabytes/gigabytes of data.
Thousands/millions of accounts Millions of transactions
Generated by big financial institutions, Facebook,
Google, Amazon, eBay, Walmart, and so on.
Generated by small enterprises and small banks.
16. Challenges in conventional Systems
The following list of challenges has been dominating in the case Conventional
systems in real time scenarios:
1) Uncertainty of Data Management Landscape
2) The Big Data Talent Gap
3) The talent gap that exists in the industry Getting data into the big data
platform
4) Need for synchronization across data sources
5) Getting important insights through the use of Big data analytics
17. 1) Uncertainty of Data Management Landscape:
• Because big data is continuously expanding, there are new companies and
technologies that are being developed everyday.
• A big challenge for companies is to find out which technology works bests for them
without the introduction of new risks and problems.
2) The Big Data Talent Gap:
• While Big Data is a growing field, there are very few experts available in this field.
• This is because Big data is a complex field and people who understand the complexity
and intricate nature of this field are far few and between.
3) The talent gap that exists in the industry Getting data into the big data platform:
• Data is increasing every single day. This means that companies have to tackle
limitless amount of data on a regular basis.
• The scale and variety of data that is available today can overwhelm any data
practitioner and that is why it is important to make data accessibility simple and
convenient for brand mangers and owners.
18. 4) Need for synchronization across data sources:
• As data sets become more diverse, there is a need to incorporate them into an
analytical platform.
• If this is ignored, it can create gaps and lead to wrong insights and messages.
5) Getting important insights through the use of Big data analytics:
• It is important that companies gain proper insights from big data analytics and
it is important that the correct department has access to this information.
• A major challenge in the big data analytics is bridging this gap in an effective
fashion.