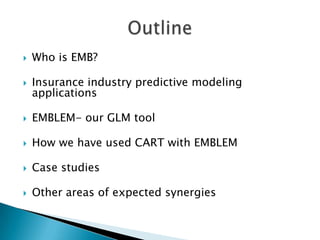
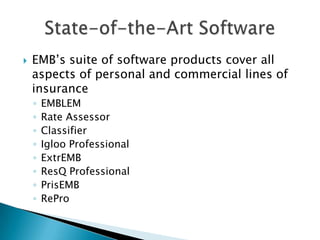
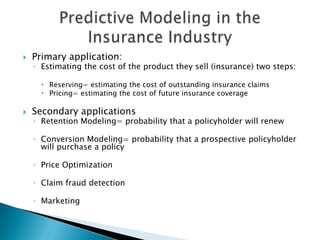
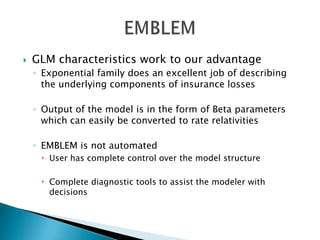
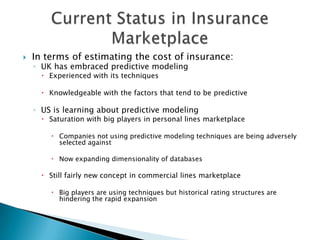
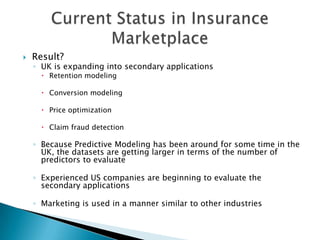
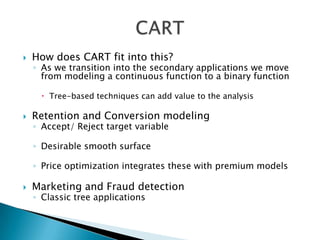
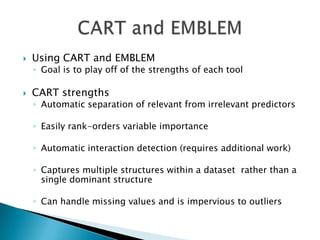
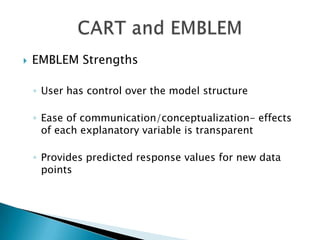
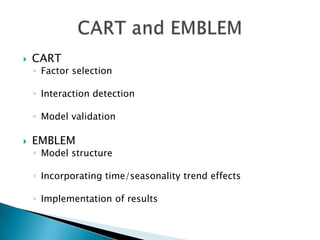
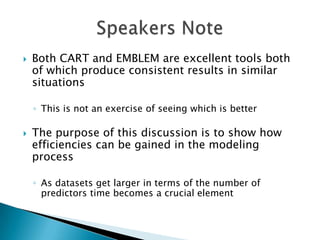
EMB America + Salford Systems
Getting the best of Two Worlds
   Who is EMB?

   Insurance industry predictive modeling
    applications

   EMBLEM- our GLM tool

   How we have used CART with EMBLEM

   Case studies

   Other areas of expected synergies
   Global network of p&c insurance consultants
    servicing clients throughout the world

   (insert globe)
   Predictive Modeling
   Ratemaking & Profitability Analysis
   Underwriting & Credit Scoring
   Enterprise Risk Management, Pro Forma, Business
    Planning
   Retention & Conversion Modeling
   New Program Development
   Competitive Analysis
   Reinsurance Program Analysis
   Reserve Analysis & Opinion Letters
   Software Development & Software Support
   Expert Witness Testimony
   Regulatory Support & Law Analysis
   EMB’s suite of software products cover all
    aspects of personal and commercial lines of
    insurance
    ◦   EMBLEM
    ◦   Rate Assessor
    ◦   Classifier
    ◦   Igloo Professional
    ◦   ExtrEMB
    ◦   ResQ Professional
    ◦   PrisEMB
    ◦   RePro
   We use EMBLEM, a GLM tool, for our
    predictive modeling needs

   Why?
   Primary application:
    ◦ Estimating the cost of the product they sell (insurance) two steps:

       Reserving= estimating the cost of outstanding insurance claims
       Pricing= estimating the cost of future insurance coverage

   Secondary applications
    ◦ Retention Modeling= probability that a policyholder will renew

    ◦ Conversion Modeling= probability that a prospective policyholder
      will purchase a policy

    ◦ Price Optimization

    ◦ Claim fraud detection

    ◦ Marketing
   Goal is to develop a unique rate for every risk
    ◦ Don’t think in terms of good/bad risks

    ◦ State Farm/Allstate vs GEICO/Progressive

    ◦ Quickly exhausts the data
       Credibility/ variability/ stability

   Risks are described by the predictor variables, not the
    target.
    ◦ Need to have a mapping of the predictor variable levels to a target
      value- not the other way around

       Other way around makes it difficult to derive impact of individual
        predictor variables

       Important because actual data often does not describe all possible
        combinations of potential customers
   Highly regulated marketplace
    ◦ Restrictions
      Predictors can and cannot use
         Credit scores

      Rules on values for the predictors
         Ages 65+ relativities cannot be >110% of ages 40-60
         Maximum rate change between adjacent territories

      Rules on predictor order and magnitude of importance
         CA Sequential Analysis (driving record>annual mileage>years held
          license)

    ◦ Regulatory Approval
      Rates need to be supported

      Black box methodologies will not be accepted
   Response variable is continuous/discrete function

   (insert graph)
    ◦ Gamma consistent with severity modeling, or even Inverse
      Gaussian

   (insert graph)
    ◦ Poisson consistent with frequency modeling

   No single trial/outcome
    ◦ Trial is measured in terms of time

    ◦ Actual policy length varies tremendously because of changes
       Marital status
       New car
       moved
   In 1996, EMB designed EMBLEM to provide access to GLM for
    statisticians and non-statisticians pricing personal and
    commercial insurance

   EMBLEM revolutionized the use of GLM’s, enabling analysis that
    was previously either impossible or too time-consuming to be
    worth attempting

   EMBLEM is now used by over 100 insurance companies globally:
    ◦ 18 of the top 20 personal auto writers in the UK
    ◦ 50 companies in the US including 8 of the top 10 personal auto writers

   Fastest GLM tool with the capability to model millions of
    observations in seconds with a host of diagnostic tools:
    ◦ Graphical, practical, statistical, automated.

    ◦ Stand-alone software package that can be integrated with a variety of
      external software including SAS®

    ◦ Microsoft® Visual Basic® for Applications provides ultimate flexibility
   GLM characteristics work to our advantage
    ◦ Exponential family does an excellent job of describing
      the underlying components of insurance losses

    ◦ Output of the model is in the form of Beta parameters
      which can easily be converted to rate relativities

    ◦ EMBLEM is not automated
      User has complete control over the model structure

      Complete diagnostic tools to assist the modeler with
       decisions
   In terms of estimating the cost of insurance:
    ◦ UK has embraced predictive modeling
       Experienced with its techniques

       Knowledgeable with the factors that tend to be predictive

    ◦ US is learning about predictive modeling
       Saturation with big players in personal lines marketplace

         Companies not using predictive modeling techniques are being adversely
          selected against

         Now expanding dimensionality of databases

       Still fairly new concept in commercial lines marketplace

         Big players are using techniques but historical rating structures are
          hindering the rapid expansion
   Result?
    ◦ UK is expanding into secondary applications
       Retention modeling

       Conversion modeling

       Price optimization

       Claim fraud detection

    ◦ Because Predictive Modeling has been around for some time in the
      UK, the datasets are getting larger in terms of the number of
      predictors to evaluate

    ◦ Experienced US companies are beginning to evaluate the
      secondary applications

    ◦ Marketing is used in a manner similar to other industries
   How does CART fit into this?
    ◦ As we transition into the secondary applications we move
      from modeling a continuous function to a binary function

       Tree-based techniques can add value to the analysis

   Retention and Conversion modeling
    ◦ Accept/ Reject target variable

    ◦ Desirable smooth surface

    ◦ Price optimization integrates these with premium models

   Marketing and Fraud detection
    ◦ Classic tree applications
   Using CART and EMBLEM
    ◦ Goal is to play off of the strengths of each tool

   CART strengths
    ◦ Automatic separation of relevant from irrelevant predictors

    ◦ Easily rank-orders variable importance

    ◦ Automatic interaction detection (requires additional work)

    ◦ Captures multiple structures within a dataset rather than a
      single dominant structure

    ◦ Can handle missing values and is impervious to outliers
   EMBLEM Strengths

    ◦ User has control over the model structure

    ◦ Ease of communication/conceptualization- effects
      of each explanatory variable is transparent

    ◦ Provides predicted response values for new data
      points
   CART
    ◦ Factor selection

    ◦ Interaction detection

    ◦ Model validation

   EMBLEM
    ◦ Model structure

    ◦ Incorporating time/seasonality trend effects

    ◦ Implementation of results
   Both CART and EMBLEM are excellent tools both
    of which produce consistent results in similar
    situations

    ◦ This is not an exercise of seeing which is better

   The purpose of this discussion is to show how
    efficiencies can be gained in the modeling
    process

    ◦ As datasets get larger in terms of the number of
      predictors time becomes a crucial element
   Retention modeling assignment

    ◦ 97,227 observations

      Each observation represents one trial/outcome

      Split 50/50 between training/test datasets

    ◦ 11 predictors

      Grand total number of levels:147
   Modeling Process
    ◦ Started with Forward Entry Regression

       Automated process
       Used Chi-Squared statistic for testing significance
       Took about 30 minutes to run

    ◦ Significant factors (8)

         Rating Area
         Vehicle Category
         Age
         NCD
         Driver Restriction
         Vehicle Age
         Change Over Last Year’s Premium
         Market Competitiveness
   Build a model with no factors and add based
    on prespecified criteria regarding
    improvement in model fit:

   (insert table)

   Add the factor that performed the best on the
    Chi Square test. (Policyholder Age)

   Iterate process with the new base model until
    no further factors indicated removal
   Compared results with CART/ TreeNet

    ◦ Significant factors were essentially the same

    ◦ Model predictiveness was the same (ROC=0.7)

   Interactions

    ◦ No significant interactions were found by EMBLEM or
      CART

   Test Dataset

    ◦ ROC=0.7
   Retention modeling assignment

    ◦ 198,386 observations

      Each observation represented one trial/outcome

      Split 50/50 between training/test datasets

    ◦ 135 predictors

      Grand total number of levels: approx 3,752
   Forward Entry Regression
    ◦ Found 57 predictors to be significant

    ◦ Took a weekend to run

   Comparison to CART/ TreeNet
    ◦ Found 24 significant predictors

    ◦ Top 15 based on variable importance were also found by
      EMBLEM

    ◦ Correlations with the rest of the predictors

   Through the modeling process we reduced the
    number of predictors to 26
   Interactions

    ◦ We relied on indications from CART/ TreeNet

    ◦ 6 interactions were identified and included in the
      model

   EMBLEM Results

    ◦ Training ROC= .862

    ◦ Test ROC= .85
   Variable importance

   Segmentation

   Super-Profiling
   CART excels at identifying different segments in data

   CART may also help determine where to segment data

   Segmentation is a useful alternative to fitting many
    interactions

    ◦ Example: In a automobile insurance renewal problem, a CART
      analysis showed several occurrences of a split between those
      policyholders with just one years duration and those with a
      greater duration

   This suggests segmenting the data into two parts:
    ◦ Policies renewing with one year duration

    ◦ Policies renewing with more than one year
   After a GLM model is constructed use CART
    to model the residuals to see if any patterns
    exists

    ◦ If a pattern is discovered, go back to the model
      structure and incorporate the findings

    ◦ Test to see if model structure was inadvertently
      over-simplified

Combining Linear and Non Linear Modeling Techniques

  • 1.
    EMB America +Salford Systems Getting the best of Two Worlds
  • 2.
    Who is EMB?  Insurance industry predictive modeling applications  EMBLEM- our GLM tool  How we have used CART with EMBLEM  Case studies  Other areas of expected synergies
  • 3.
    Global network of p&c insurance consultants servicing clients throughout the world  (insert globe)
  • 4.
    Predictive Modeling  Ratemaking & Profitability Analysis  Underwriting & Credit Scoring  Enterprise Risk Management, Pro Forma, Business Planning  Retention & Conversion Modeling  New Program Development  Competitive Analysis  Reinsurance Program Analysis  Reserve Analysis & Opinion Letters  Software Development & Software Support  Expert Witness Testimony  Regulatory Support & Law Analysis
  • 5.
    EMB’s suite of software products cover all aspects of personal and commercial lines of insurance ◦ EMBLEM ◦ Rate Assessor ◦ Classifier ◦ Igloo Professional ◦ ExtrEMB ◦ ResQ Professional ◦ PrisEMB ◦ RePro
  • 6.
    We use EMBLEM, a GLM tool, for our predictive modeling needs  Why?
  • 7.
    Primary application: ◦ Estimating the cost of the product they sell (insurance) two steps:  Reserving= estimating the cost of outstanding insurance claims  Pricing= estimating the cost of future insurance coverage  Secondary applications ◦ Retention Modeling= probability that a policyholder will renew ◦ Conversion Modeling= probability that a prospective policyholder will purchase a policy ◦ Price Optimization ◦ Claim fraud detection ◦ Marketing
  • 8.
    Goal is to develop a unique rate for every risk ◦ Don’t think in terms of good/bad risks ◦ State Farm/Allstate vs GEICO/Progressive ◦ Quickly exhausts the data  Credibility/ variability/ stability  Risks are described by the predictor variables, not the target. ◦ Need to have a mapping of the predictor variable levels to a target value- not the other way around  Other way around makes it difficult to derive impact of individual predictor variables  Important because actual data often does not describe all possible combinations of potential customers
  • 9.
    Highly regulated marketplace ◦ Restrictions  Predictors can and cannot use  Credit scores  Rules on values for the predictors  Ages 65+ relativities cannot be >110% of ages 40-60  Maximum rate change between adjacent territories  Rules on predictor order and magnitude of importance  CA Sequential Analysis (driving record>annual mileage>years held license) ◦ Regulatory Approval  Rates need to be supported  Black box methodologies will not be accepted
  • 10.
    Response variable is continuous/discrete function  (insert graph) ◦ Gamma consistent with severity modeling, or even Inverse Gaussian  (insert graph) ◦ Poisson consistent with frequency modeling  No single trial/outcome ◦ Trial is measured in terms of time ◦ Actual policy length varies tremendously because of changes  Marital status  New car  moved
  • 11.
    In 1996, EMB designed EMBLEM to provide access to GLM for statisticians and non-statisticians pricing personal and commercial insurance  EMBLEM revolutionized the use of GLM’s, enabling analysis that was previously either impossible or too time-consuming to be worth attempting  EMBLEM is now used by over 100 insurance companies globally: ◦ 18 of the top 20 personal auto writers in the UK ◦ 50 companies in the US including 8 of the top 10 personal auto writers  Fastest GLM tool with the capability to model millions of observations in seconds with a host of diagnostic tools: ◦ Graphical, practical, statistical, automated. ◦ Stand-alone software package that can be integrated with a variety of external software including SAS® ◦ Microsoft® Visual Basic® for Applications provides ultimate flexibility
  • 12.
    GLM characteristics work to our advantage ◦ Exponential family does an excellent job of describing the underlying components of insurance losses ◦ Output of the model is in the form of Beta parameters which can easily be converted to rate relativities ◦ EMBLEM is not automated  User has complete control over the model structure  Complete diagnostic tools to assist the modeler with decisions
  • 13.
    In terms of estimating the cost of insurance: ◦ UK has embraced predictive modeling  Experienced with its techniques  Knowledgeable with the factors that tend to be predictive ◦ US is learning about predictive modeling  Saturation with big players in personal lines marketplace  Companies not using predictive modeling techniques are being adversely selected against  Now expanding dimensionality of databases  Still fairly new concept in commercial lines marketplace  Big players are using techniques but historical rating structures are hindering the rapid expansion
  • 14.
    Result? ◦ UK is expanding into secondary applications  Retention modeling  Conversion modeling  Price optimization  Claim fraud detection ◦ Because Predictive Modeling has been around for some time in the UK, the datasets are getting larger in terms of the number of predictors to evaluate ◦ Experienced US companies are beginning to evaluate the secondary applications ◦ Marketing is used in a manner similar to other industries
  • 15.
    How does CART fit into this? ◦ As we transition into the secondary applications we move from modeling a continuous function to a binary function  Tree-based techniques can add value to the analysis  Retention and Conversion modeling ◦ Accept/ Reject target variable ◦ Desirable smooth surface ◦ Price optimization integrates these with premium models  Marketing and Fraud detection ◦ Classic tree applications
  • 16.
    Using CART and EMBLEM ◦ Goal is to play off of the strengths of each tool  CART strengths ◦ Automatic separation of relevant from irrelevant predictors ◦ Easily rank-orders variable importance ◦ Automatic interaction detection (requires additional work) ◦ Captures multiple structures within a dataset rather than a single dominant structure ◦ Can handle missing values and is impervious to outliers
  • 17.
    EMBLEM Strengths ◦ User has control over the model structure ◦ Ease of communication/conceptualization- effects of each explanatory variable is transparent ◦ Provides predicted response values for new data points
  • 18.
    CART ◦ Factor selection ◦ Interaction detection ◦ Model validation  EMBLEM ◦ Model structure ◦ Incorporating time/seasonality trend effects ◦ Implementation of results
  • 19.
    Both CART and EMBLEM are excellent tools both of which produce consistent results in similar situations ◦ This is not an exercise of seeing which is better  The purpose of this discussion is to show how efficiencies can be gained in the modeling process ◦ As datasets get larger in terms of the number of predictors time becomes a crucial element
  • 20.
    Retention modeling assignment ◦ 97,227 observations  Each observation represents one trial/outcome  Split 50/50 between training/test datasets ◦ 11 predictors  Grand total number of levels:147
  • 21.
    Modeling Process ◦ Started with Forward Entry Regression  Automated process  Used Chi-Squared statistic for testing significance  Took about 30 minutes to run ◦ Significant factors (8)  Rating Area  Vehicle Category  Age  NCD  Driver Restriction  Vehicle Age  Change Over Last Year’s Premium  Market Competitiveness
  • 22.
    Build a model with no factors and add based on prespecified criteria regarding improvement in model fit:  (insert table)  Add the factor that performed the best on the Chi Square test. (Policyholder Age)  Iterate process with the new base model until no further factors indicated removal
  • 23.
    Compared results with CART/ TreeNet ◦ Significant factors were essentially the same ◦ Model predictiveness was the same (ROC=0.7)  Interactions ◦ No significant interactions were found by EMBLEM or CART  Test Dataset ◦ ROC=0.7
  • 24.
    Retention modeling assignment ◦ 198,386 observations  Each observation represented one trial/outcome  Split 50/50 between training/test datasets ◦ 135 predictors  Grand total number of levels: approx 3,752
  • 25.
    Forward Entry Regression ◦ Found 57 predictors to be significant ◦ Took a weekend to run  Comparison to CART/ TreeNet ◦ Found 24 significant predictors ◦ Top 15 based on variable importance were also found by EMBLEM ◦ Correlations with the rest of the predictors  Through the modeling process we reduced the number of predictors to 26
  • 26.
    Interactions ◦ We relied on indications from CART/ TreeNet ◦ 6 interactions were identified and included in the model  EMBLEM Results ◦ Training ROC= .862 ◦ Test ROC= .85
  • 27.
    Variable importance  Segmentation  Super-Profiling
  • 28.
    CART excels at identifying different segments in data  CART may also help determine where to segment data  Segmentation is a useful alternative to fitting many interactions ◦ Example: In a automobile insurance renewal problem, a CART analysis showed several occurrences of a split between those policyholders with just one years duration and those with a greater duration  This suggests segmenting the data into two parts: ◦ Policies renewing with one year duration ◦ Policies renewing with more than one year
  • 29.
    After a GLM model is constructed use CART to model the residuals to see if any patterns exists ◦ If a pattern is discovered, go back to the model structure and incorporate the findings ◦ Test to see if model structure was inadvertently over-simplified