The document provides an overview of the key components and features of Microsoft Access, including the ribbon, navigation pane, tabbed document viewing, customizable access options, database objects like tables, queries, forms and reports, and how to work with data in Access like adding records, filtering, sorting and querying. It also discusses setting up relationships between tables and customizing Access.
There are three ways to create a new database in Domino: using a template, copying an existing database, or starting from scratch in Domino Designer. When starting from scratch in Domino Designer, the user creates a blank database with no pre-existing design elements and must build out the application by adding pages, forms, fields, and other elements. Database properties like the launch options and encryption can be configured. Forms and pages are used to display information to users and can include various elements like text, graphics, tables, and more. Fields are used to collect and store user-entered data on forms.
Database management systems allow for the centralized storage, organization, and retrieval of data. Data is raw facts that are collected and stored in tables within a database. A database management system like Microsoft Access provides tools to create, query, and manage these tables. It enforces data integrity and allows multiple users to simultaneously access and update data for applications. Key components of a database include tables, queries, forms, and reports that interact with the stored data.
1) The document discusses managing and creating tables in Microsoft Access. It covers how to explore a database, manage tables by adding, deleting and editing records, and print tables.
2) It also explains how to design tables by planning fields and relationships, and how to create tables by adding fields, assigning data types and properties.
3) Key topics include opening and closing database objects, inserting and deleting table rows and columns, adjusting column widths, and printing and previewing tables.
The document provides information about the different phases of system development:
1) The Analysis Phase involves problem analysis and identifying user requirements, inputs, processes and outputs.
2) The Design Phase involves planning the system design including creating entity relationship diagrams and determining fields.
3) The Implementation Phase involves creating the database objects like tables, queries, forms and reports.
4) The Testing Phase involves entering test data and testing the functionality and objects.
5) The Documentation Phase involves producing documentation like user manuals and technical documentation.
This document provides an overview of creating and working with tables in Microsoft Access. It describes how to design a table by adding fields and setting their properties. Key points covered include data types, primary keys, field properties like format, validation and required fields. Navigation and editing features for working with table data are also summarized.
This document provides an introduction to Microsoft Access databases, including how to create a new database, add tables, define fields and data types, and establish relationships between tables. It describes common database objects like forms, queries, reports and switches and how to import data from Excel. Basic tasks like online help, backups and opening files are also covered at a high level.
Microsoft Access 2010 allows users to create and manage databases. It includes tools like tables, queries, forms, reports, and a backstage view. The ribbon replaces menus and toolbars for navigating database objects stored in the file. Users can import data from Excel or text files into new or existing tables, and export data and tables to other formats like Excel.
This document provides an overview of Microsoft Access 2010, including how to get started with Access databases. It covers topics such as understanding relational databases, exploring an Access database, creating tables and relating tables using primary keys. The document also describes how to enter and edit data, as well as important database terminology.
The document provides instructions for a database project involving creating tables, forms, queries, and reports in Microsoft Access. Students are asked to create tables to store supplier and product data, with a one-to-many relationship between them. Forms and queries are then developed to enter and extract data from these tables. Finally, a report is generated to outline products and suppliers sorted by state. The tasks guide students through the process of designing a basic relational database in Access.
This document outlines the objectives and steps to create and manage a Microsoft Access 2007 database, including:
1) Creating a database file and designing tables, forms, queries, and reports to enter and display data
2) Populating tables with data and formatting fields
3) Designing forms and queries to view, enter, and extract specific data
4) Creating reports to output selected data
5) Properly closing and exiting the Access program and database
The document provides help and instructions for using an electronic engineering data book. It explains that the data book has been converted to an electronic format using Adobe Acrobat and contains enhanced search functionality. It provides tips for navigating through the data book, including how to use bookmarks to jump between sections, search for specific terms, and view references and figures. The help file also provides recommendations for optimal monitor settings when viewing the electronic book.
The document provides information about the testing phase of database system development. In this phase, system developers and users test the database to ensure it is functioning correctly and free of errors. Key aspects of testing include entering test data, validating that database objects like tables, queries, forms and reports are working as intended, and testing overall system functionality. The goal of testing is to identify any issues and ensure the quality of the database before it is implemented.
1. Microsoft Access is a database software that allows users to organize data into tables and relate the tables to each other. It allows data to be queried, summarized, and reported on efficiently.
2. The document discusses the key components of an Access database - tables to store data, queries to retrieve and process data, forms to enter and view data, and reports to print summaries.
3. It provides examples of how a school might use Access to organize student and course data, and describes the tables, fields, and records that make up the sample Northwind database.
Microsoft Access is a relational database management system used to store and manipulate data. It has a number of key components including tables, queries, forms, reports, macros and modules. Tables are used to store data in rows and columns, while queries are used to manipulate and retrieve data. Forms are used as the interface to add, view and edit data. Reports output data for printing or sharing. Macros automate tasks and modules contain programming code. Relationships link related data across multiple tables. Access supports the SQL query language and uses a .accdb file extension.
This document provides an overview and introduction to Microsoft Access 2007. It discusses what a database is and how Access allows users to create computerized databases. It describes the basic Access interface elements like the navigation pane, ribbon, and views. It also introduces some common Access objects like tables, queries, forms, reports, macros and modules. The second half of the document focuses on creating and working with tables, including adding fields, assigning data types, setting field properties, and creating lookup columns to relate tables.
This document provides an overview of key concepts for the MS Access ECDL module, including tables, fields, primary keys, relationships, queries, forms, and reports. It explains how to create tables with fields, set primary keys, and establish relationships between tables. Queries, forms, and reports are also introduced. The document aims to prepare the reader for the tasks and knowledge required for the ECDL Access certification.
Tutorial for using SQL in Microsoft Accessmcclellm
SQL is a programming language used to manage data in relational databases. It allows users to insert, query, update and delete data from database tables. Microsoft Access is a common program that uses SQL to interact with its data tables, allowing users to run queries to retrieve certain records based on conditions. The document provides examples of SQL statements like SELECT, UPDATE, DELETE used in Microsoft Access and videos demonstrating how to execute them to select, modify and remove data from Access tables.
1. Microsoft Access allows users to create and work with databases, tables, forms, queries, and reports. It provides tools for starting and exiting the program, creating and opening databases, and designing and manipulating tables, forms, queries, and reports.
2. Key features include creating and customizing tables with fields and records, entering and editing data, generating forms and reports from tables, and building queries to extract and calculate specific data.
3. Microsoft Access gives users flexibility in how they view and interact with different database components, allowing switching between design and data entry views, customizing properties and layouts, and printing finished reports.
PPT On MS-Access 2007 | Full Concepts |Umesh Kumar
Microsoft Access is a database management system that allows information to be stored, organized, and manipulated in tables. Information is held in tables that can be linked, and specific information can be retrieved by running queries. Results of queries and organized data can be presented using reports and forms provide easy input of data and criteria for queries.
This document provides an overview of how to build a database in Microsoft Access, including guidelines for designing databases and defining table relationships. It discusses how to create and modify tables, define fields and primary keys, import data from Excel and text files, and set relationships between tables. The objectives are to learn how to design databases, create and modify tables and fields, import data, and define relationships between tables.
The document provides an overview of creating and using a Microsoft Access 2010 database. It discusses creating tables, entering records, saving tables, opening databases, navigating datasheets, creating simple queries, forms, and reports, and printing reports. It also covers compacting and repairing databases, and backing up and restoring databases. The goal is to teach basic database concepts and how to set up and interact with objects in an Access database.
The document provides instructions for creating tables in Microsoft Access 2010 using Table Design view. It describes how to define fields, data types, primary keys and field properties before entering data. Additional methods like creating a lookup field using the Lookup Wizard and freezing columns for data entry are also outlined. The summary provides the essential steps to set up a table structure and enter data.
" Overview of the DSD and DATA editor in the new CountrySTAT platform "FAO
This document provides an overview of uploading and editing tables in the CountrySTAT/FENIX platform. It describes the steps to:
1) Create a DSD structure using the DSD editor to mirror the dataset, adding dimension, value, and other columns.
2) Upload dataset values using the data editor, selecting the correct separator and aligning columns.
3) Retrieve previously uploaded tables using metadata filters and view or edit table values.
Murdoch University Master Class - EntrepreneurshipAtte Miettinen
This is a presentation I did on 12.11.2012 at Murdoch University Dubai's Master Class event on Entrepreneurship, highlighting the similaries in successfully scaling mountains and starting businesses.
This document provides an overview of the securities market in India, including its products, participants, functions, and role in economic development. It discusses the primary and secondary markets. The primary market involves initial public offerings and collective investment vehicles like mutual funds. The secondary market involves stock exchanges, trading, clearing and settlement, risk management, and market indices. It also describes the government securities market, including primary issuance of government bonds and treasury bills, as well as secondary trading through stock exchanges, repos, and wholesale debt platforms.
1. Insurance has evolved over thousands of years from early concepts of loss sharing to the modern insurance industry. 2. The earliest forms of insurance were marine insurance in the 14th century to protect merchant ships, and fire insurance in the 16th century after the Great Fire of London. 3. Life insurance emerged in the 16th century in England and other forms of insurance have developed over time to cover new risks like accidents, theft and crop failure.
This document provides an overview of trading on the National Stock Exchange (NSE) of India. It discusses the NEAT trading system, different market types, corporate hierarchy, market phases, logging on/off procedures, various inquiry screens for viewing market data and placing orders, order management processes like order entry, modification and cancellation, trade management, the auction market, and downloading trading information. It also describes functions like limited physical market, retail debt market, internet broking and contains sample questions.
The document discusses investment basics and the securities market in India. It covers topics like different investment options, primary and secondary markets, issuance of shares, regulations, and participants in the market. The primary market deals with new stock issuances, including initial public offerings and rights issues. It also discusses foreign capital raising through instruments like American Depository Receipts and Global Depository Receipts. The secondary market provides liquidity and supports trading of existing listed securities. Key regulators of the Indian securities market include SEBI and stock exchanges.
The document provides an overview and introduction to mutual funds in India. It discusses the structure of mutual funds in India, including the roles of asset management companies (AMCs), custodians, registrars and transfer agents. It also describes the process for investing in new fund offers (NFOs) and investors' rights and obligations. The document is structured as a reference book with multiple chapters covering various types of mutual fund products like equity funds, gold ETFs, debt funds, liquid funds and taxation. It provides definitions and descriptions of different fund categories like index funds, large cap funds, midcap funds and sectoral funds. The key details around features, workings, risks and schemes within each category are also discussed.
World Retail Banking Report 2014 from Capgemini and EfmaCapgemini
The Customer Experience Index for retail banking declined in 2014, with fewer customers reporting positive experiences in most regions of the world. Customers with positive experiences are much more likely to remain loyal to their bank, purchase additional products, and refer others. While North America continues to have the highest levels of positive customer experiences, Asia and parts of Europe saw declines. Banks need to focus on consistently delivering positive experiences across all channels to drive key behaviors that boost profitability.
This document outlines the syllabus for a course on Managerial Economics. The syllabus covers 6 units: 1) Managerial economics: Meaning, nature and scope; 2) Demand Analysis; 3) Cost Concepts; 4) Production Functions; 5) Profit; 6) National Income. It then provides more detail on the contents, which include nature and scope of managerial economics, demand analysis, cost concepts, production function, profit, and national income.
The document outlines an investment analysis and portfolio management syllabus. It includes 7 units that cover topics such as investment concepts and goals, financial investment avenues, investment analysis approaches, portfolio construction and choice, capital asset pricing models, and portfolio performance measures. The syllabus aims to teach students about analyzing investments, constructing diversified portfolios to optimize risk and return, and evaluating portfolio performance over time.
NCFM - Fundamental analysis module (NSE)Nimesh Parekh
This document provides details on the National Stock Exchange of India's Fundamental Analysis Module, including an overview of the module curriculum.
The module is divided into 4 chapters that cover the basics of fundamental analysis, financial statement analysis, valuation methodologies, and related topics. It has a total duration of 120 minutes and includes 60 multiple-choice questions. The pass score is 60%.
The curriculum allocates approximately 15% of the weight to the introduction of fundamental analysis, 15% to brushing up on basic financial concepts, 35% to understanding financial statements, and 35% to valuation methodologies. Candidates are advised to check the NSE website for any updates to NCFM modules.
ING steps up research on consumer finances
ING published the first in a series of research reports as part of ING’s Think Forward Initiative to gain a better understanding of consumer decision-making and the consequences on economic activity.
More info: http://www.ing.com/Newsroom/All-news/ING-steps-up-research-on-consumer-finances.htm
The Brave 100: The Battle for Supremacy in Small Business LendingFrank Rotman
Banks vs. the Innovators. Who has the advantage and who will dominate the Small Business lending ecosystem?
More fintech blogs and papers at: www.fintechjunkie.com
The Hourglass Effect - A Decade of DisplacementFrank Rotman
A ten year look back and view into the future of the Personal Loans industry. Why did the Banks pull back at the same time that Lending Club and Prosper emerged? Why haven't the Banks come back? What's next?
Bitcoin price rallied in Q4 2015, increasing 82% to end the quarter at $430.05. Trading volume on exchanges also increased significantly, rising 424% compared to Q4 2014. However, the growth rate of quarterly VC investment in the bitcoin/blockchain sector slowed from 11% in Q3 2015 to 3% in Q4 2015, though it is unclear if this decline is sector-specific or due to the overall VC environment. Major developments in the quarter included the European Court of Justice ruling that bitcoin sales are not subject to VAT, and 42 major financial firms partnering with R3 to explore blockchain applications.
INTRODUCTION TO ACCESSOBJECTIVESDefine th.docxmariuse18nolet
This document provides an introduction and overview of how to create and manage a Microsoft Access database. It explains key concepts like tables, queries, forms and reports. It also provides step-by-step instructions on how to create tables, add and edit fields, set primary keys, and enter data. Additional sections cover how to create queries, forms, and reports, as well as how to open, save, and compact an Access database. The goal is to give the reader a foundational understanding of the Access interface and the basic functions needed to build and work with an Access database.
This document provides steps for creating a new table in Microsoft Access:
1. Click Create Table in Design View to define the fields, data types, and properties for each field.
2. Specify a primary key field that uniquely identifies each record in the table.
3. Save and name the new table, which has now been successfully created.
Microsoft Access is a database program that allows users to create and manage databases. It has features like tables to organize data, queries to search and filter data, forms to enter and view data, and reports to analyze and present data. The basic units of a database in Access are fields, records, and tables. Fields make up records, and related records are organized into tables. Access supports relational databases where data across multiple tables is linked through primary and foreign keys.
As a leading data visualization tool Tableau has many desirable and unique features. Its powerful data discovery and exploration application allows you to answer important questions in seconds. You can use Tableau's drag and drop interface to visualize any data, explore different views, and even combine multiple databases together easily. It does not need any complex scripting. Anyone who understands the business problem can address it with a visualization of the relevant data. When the analysis is finished, sharing with others is as easy as publishing to Tableau Server.
This document provides an overview of creating and working with different database objects in Microsoft Access, including tables, queries, forms and reports. It outlines both using the design view and wizards to create each type of object. The key steps are to open Access, create a new blank database, and then select the relevant option to build a table, query, form or report either in design view or via the appropriate wizard. Common database objects and how to exit Access are also summarized.
This document provides an overview of creating and working with different database objects in Microsoft Access, including tables, queries, forms and reports. It outlines both using the design view and wizards to create each type of object. The key steps are to open Access, create a new blank database, and then choose the appropriate menu option to either use the design view or wizard to build the desired table, query, form or report.
This document provides an overview of a training on Microsoft Power BI. It introduces Power BI as a business intelligence tool consisting of three core applications: connecting to data sources, data preparation and analysis, and visualization and collaboration. It outlines the key topics that will be covered in the training, including connecting and transforming data in Power BI Desktop, data modeling, analyzing data with DAX calculations, visualizing and formatting data, filters, and refreshing and scheduling reports in Power BI Service. The training will cover the components and building blocks of Power BI, how to use the Power BI Desktop interface, and include hands-on exercises for working with data, creating reports and dashboards, and publishing to Power BI Service.
The Documentation Phase is the fifth phase of system development. In this phase, system developers produce documentation for the database program. Some key documentation includes user manuals that describe how to use the system, training guides for teaching users, and system technical documentation describing how the system was designed and implemented. Proper documentation is important as it allows users and future developers to understand how to operate, maintain and enhance the system.
This document provides an introduction to Microsoft Access databases, including how to create a new database and add tables. It discusses the basic components of an Access database, including tables, queries, forms, reports, and relationships. It also covers how to design tables, add fields, set primary keys, and enter data. Basic functions like sorting, filtering, importing from Excel, and backing up databases are described at a high level. The document is meant to introduce the key concepts and capabilities of Access for new users.
The document provides information about the testing phase of database system development. In this phase, system developers and users test the database to ensure it is functioning correctly and free of errors. Tests are conducted on data entry, individual database objects like tables, forms and reports, as well as the overall functionality of the system. The goal is to identify any issues and ensure the quality of the database before deployment.
The document provides information about the testing phase of database system development. In this phase, system developers and users test the database to ensure it is functioning correctly and free of errors. Key aspects of testing include entering test data, validating that database objects like tables, queries, forms and reports are working as intended, and testing the overall functionality and performance of the system. The goal of testing is to identify any issues and ensure the quality of the database before it is implemented.
This document provides an introduction to Microsoft Access, including key concepts like databases, tables, fields, and data types. It explains how to get started with Access by creating or opening a database. It describes how to build tables with fields and define primary keys. It also covers manipulating data in tables, creating and working with forms and reports, and switching between views like design view and datasheet view. The document serves as a tutorial for beginners to learn the basic features and functions of Microsoft Access.
B.sc i micro bio u 4 introduction to ms accessRai University
This document provides an introduction to Microsoft Access, including key concepts like databases, tables, fields, and data types. It explains how to get started with Access by creating or opening a database. It describes how to build tables with fields and define primary keys. It also covers manipulating data in tables, creating and working with forms and reports, and switching between views like design view and datasheet view. The document serves as a tutorial for beginners to learn the basic features and functionality of the MS Access program for creating and managing databases.
B.sc i bio tech u 4 introduction to ms accessRai University
This document provides an introduction to Microsoft Access, including key concepts like databases, tables, fields, and data types. It explains how to get started with Access by creating or opening a database. It describes how to build tables with fields and define primary keys. It also covers manipulating data in tables, creating and working with forms and reports, and switching between views like design view and datasheet view. The document serves as a tutorial for beginners to learn the basic features and functionality of the MS Access program for creating and managing databases.
B.sc i bio chem u 4 introduction to ms accessRai University
This document provides an introduction to Microsoft Access, including key concepts like databases, tables, fields, and data types. It explains how to get started with Access by creating or opening a database. It describes how to build tables with fields and define primary keys. It also covers manipulating data in tables, creating and working with forms and reports, and switching between views like design view and datasheet view. The document serves as a tutorial for getting acquainted with the basic features and functionality of Microsoft Access.
Microsoft Access is a software application that could help students to create databases and organize data using database tools like, reports, modules, tables and queries. Database Relational is a tool that could organize the data by its relationship (One is to One, One is to Many and Many is to Many.
Microsoft Access allows users to create and manage databases. It breaks down databases into tables, records, fields, and data types. Tables organize data into rows and columns and can be displayed in a form or report view. Forms and reports allow data to be entered and presented in an organized manner. Both forms and reports are created using wizards to select fields and layouts and manipulate the underlying table data.
The document provides step-by-step instructions for opening and using Microsoft Access 2003. It explains how to open the program, navigate the menu bars, and create a database, table, queries, forms, and reports. The file menu bar is described as containing options for creating, opening, saving, and exporting files. Instructions are given for making a new database, adding tables with different field types, designing queries to link tables, and using wizards to generate forms and reports from the tables and queries.
The Limited Liability Partnership Act of 2008 established LLPs in India and outlines their key features, including being a separate legal entity, partners having limited liability, requirements for at least two partners and designated partners, governance of mutual partner rights and obligations, financial reporting, and provisions for conversion, investigation, winding up and application of company law as needed.
The document defines various accounting and finance terms. Some key terms defined include:
- Packing credit is a loan or advance provided by a bank to an exporter to finance goods prior to shipment based on a letter of credit or export order.
- A packing list/slip is a statement of container contents so the quantity of merchandise can be counted upon opening.
- Paid-in capital is capital received from investors for stock, not including capital from earnings or donations.
- Partnership is an unincorporated business with more than one owner, different from a sole proprietorship which can only have one owner.
The document defines various accounting acronyms and terms. Some key ones are: AAA - American Accounting Association, ABA - Accredited Business Accountant or Accredited Business Advisor, a national credential alternative to the CPA for small businesses. Accrual basis accounting records revenue when earned and expenses when incurred, regardless of when cash is received or paid. Activity based costing assigns overhead costs to products based on activities and cost drivers.
This document lists keyboard shortcuts for Microsoft Word. It is organized by function keys, control keys, alt keys, and control+shift keys. The shortcuts cover a range of formatting and document navigation functions like copying text, changing fonts, inserting fields, checking spelling, and printing documents.
This document provides a summary of function keys and their associated actions in Microsoft Excel.
F1 displays help or the Office assistant. F2-F12 perform various actions like editing cells, calculating worksheets, formatting data, inserting sheets and charts, saving files and more. Keyboard shortcuts allow selecting cells, copying/pasting data, entering formulas, and navigating/editing spreadsheets. Special keys like END, SCROLL LOCK, and arrow keys help select ranges and scroll the view.
Working capital management refers to managing current assets and current liabilities to ensure liquidity and profitability. It aims to balance current assets with current liabilities and optimize investments in current assets. Key aspects of working capital management include inventory management, cash management, and receivables management. Tools used include determining inventory levels, cash planning and forecasting, accounts receivable policies, and aging schedules. The goal is to efficiently manage current assets and meet obligations while maximizing return.
Self-development involves assessing one's skills and interests, maintaining a learning log to analyze work experiences, and creating a personal development plan with goals. It is important for remaining competitive in the workplace and determining one's career direction. Effective methods include finding a mentor, joining professional organizations, and keeping up with one's field through reading.
Section 44 D allows foreign companies to deduct taxes on income received through royalties and technical service fees from transfers outside of India if the agreement was made before April 1, 1976 and was approved by the Central Government. The deduction amount is either the actual expenses incurred or 20% of the gross royalty amount, whichever is less, reduced by any lump sum consideration received for the transfer.
Section 44 BBA provides a 5% deduction for income received by non-resident airlines from carriage of passengers, livestock, mail or goods originating from or traveling to India. To qualify, the non-resident must be engaged in the business of operating aircraft. However, rental income received under a wet leasing agreement with an Indian airline like Air India is exempt from tax under this section.
Section 80-I provides tax deductions for profits and gains derived from certain industrial undertakings, ships, hotels, and businesses of repairs to ocean-going vessels. A 20% deduction is allowed for eligible assessees, and 25% for eligible company assessees. Eligible industrial undertakings must meet conditions like not being a reconstruction of an existing business and employing a minimum number of workers. Eligible ships must be owned and used by an Indian company. Eligible hotels must be approved by the government and have a minimum paid-up capital. Eligible repair businesses must also meet conditions and be approved. Deductions can be claimed for a specified number of years depending on the type of business.
This section provides a deduction for profits and gains from businesses that collect and process bio-degradable waste. It is available to taxpayers whose income includes profits from collecting and processing bio-degradable waste to generate power, produce bio-fertilizers, bio-pesticides, biological agents, bio-gas, or make pellets/briquettes for fuel or organic manure. The deduction equals the full amount of such profits and gains over 5 consecutive years starting from when the qualifying business commences.
The document discusses capital structure, which refers to the composition of a company's long-term financing, including loans, reserves, shares, and bonds. It outlines factors that influence a company's capital structure such as financial leverage, risk, growth, and external conditions. The document also discusses the concept of an optimal capital structure that maximizes firm value and minimizes the cost of capital. It notes different types of leverage including financial, operating, combined, and working capital leverage and how they impact a company's earnings and risk.
Capital budgeting refers to the process of evaluating investment projects and determining whether they should be accepted or rejected. There are traditional and discounted cash flow methods for evaluating projects. Traditional methods include payback period and accounting rate of return, which do not consider the time value of money. Discounted cash flow methods, like net present value and internal rate of return, discount future cash flows to determine the value of projects today. These methods are preferred as they are consistent with maximizing shareholder value.
Bonds are debt securities where an issuer borrows money from an investor for a defined period of time. The issuer pays interest regularly and returns the principal at maturity. Key terms associated with bonds include the principal amount, coupon, price, yield, maturity, and credit quality. The credit rating of a bond provides a measure of the issuer's ability to repay the debt and allows investors to compare risk across different bonds. Bonds are issued in primary markets by sovereign governments, corporations, and other entities to fund expenditures, while existing bonds are traded in secondary markets between investors.
Audit risk is the risk that an auditor will provide an inappropriate audit opinion when the financial statements contain material misstatements. Audit risk has three components: inherent risk, control risk, and detection risk. Inherent risk is the possibility of material misstatements in the financial statements due to factors like complex accounting issues or assets susceptible to theft. Control risk is the possibility that misstatements will not be prevented or detected by internal controls. Detection risk is the possibility that audit procedures will fail to detect material misstatements. The auditor determines an acceptable level of overall audit risk.
The document discusses several controversial facts about the big four accounting firms - KPMG, PricewaterhouseCoopers, Deloitte, and Ernst & Young. It notes that while they set global standards for transparency, their ownership is highly secretive. It also lists numerous fines the firms have paid for ethical violations and compromising their independence. Finally, it questions why they are still hired in India despite these issues and their dubious advice and influence over government decisions.
The document discusses effective public speaking skills. It notes that public speaking is one of Americans' top fears and outlines aspects of effective speeches such as thorough preparation, practice, and delivery. Some key points covered include developing an outline with an introduction, body, and conclusion; using visual aids simply; practicing to improve; speaking confidently on familiar topics; and concluding remarks to signal the end.
The document defines various financial terms that emerged during the credit crisis such as "bear market", "bull market", "Chapter 11", and "credit crunch". It then lists the top six stocks to invest in across various industries including banking, telecom, information technology, real estate, automobiles, and media/entertainment. Key details provided for each recommended stock include its market capitalization, sales, profits, margins, and growth rates.
Dhirubhai Ambani was born in 1932 in Gujarat, India to a school teacher father. He had a demanding childhood and was known for his brilliance and hard work. He campaigned for socialists in his youth but later moved to Aden, Yemen at age 16 to support his family working for a trading firm. He learned the commodity trading business and started his own ventures. In 1962, he started a yarn and spices business that grew into the Reliance textiles company. Reliance textiles became one of the largest textile companies in India before diversifying into other industries. Dhirubhai Ambani passed away in 2002, leaving behind a business empire worth billions of dollars
Conversational agents, or chatbots, are increasingly used to access all sorts of services using natural language. While open-domain chatbots - like ChatGPT - can converse on any topic, task-oriented chatbots - the focus of this paper - are designed for specific tasks, like booking a flight, obtaining customer support, or setting an appointment. Like any other software, task-oriented chatbots need to be properly tested, usually by defining and executing test scenarios (i.e., sequences of user-chatbot interactions). However, there is currently a lack of methods to quantify the completeness and strength of such test scenarios, which can lead to low-quality tests, and hence to buggy chatbots.
To fill this gap, we propose adapting mutation testing (MuT) for task-oriented chatbots. To this end, we introduce a set of mutation operators that emulate faults in chatbot designs, an architecture that enables MuT on chatbots built using heterogeneous technologies, and a practical realisation as an Eclipse plugin. Moreover, we evaluate the applicability, effectiveness and efficiency of our approach on open-source chatbots, with promising results.
Your One-Stop Shop for Python Success: Top 10 US Python Development Providersakankshawande
Simplify your search for a reliable Python development partner! This list presents the top 10 trusted US providers offering comprehensive Python development services, ensuring your project's success from conception to completion.
Driving Business Innovation: Latest Generative AI Advancements & Success StorySafe Software
Are you ready to revolutionize how you handle data? Join us for a webinar where we’ll bring you up to speed with the latest advancements in Generative AI technology and discover how leveraging FME with tools from giants like Google Gemini, Amazon, and Microsoft OpenAI can supercharge your workflow efficiency.
During the hour, we’ll take you through:
Guest Speaker Segment with Hannah Barrington: Dive into the world of dynamic real estate marketing with Hannah, the Marketing Manager at Workspace Group. Hear firsthand how their team generates engaging descriptions for thousands of office units by integrating diverse data sources—from PDF floorplans to web pages—using FME transformers, like OpenAIVisionConnector and AnthropicVisionConnector. This use case will show you how GenAI can streamline content creation for marketing across the board.
Ollama Use Case: Learn how Scenario Specialist Dmitri Bagh has utilized Ollama within FME to input data, create custom models, and enhance security protocols. This segment will include demos to illustrate the full capabilities of FME in AI-driven processes.
Custom AI Models: Discover how to leverage FME to build personalized AI models using your data. Whether it’s populating a model with local data for added security or integrating public AI tools, find out how FME facilitates a versatile and secure approach to AI.
We’ll wrap up with a live Q&A session where you can engage with our experts on your specific use cases, and learn more about optimizing your data workflows with AI.
This webinar is ideal for professionals seeking to harness the power of AI within their data management systems while ensuring high levels of customization and security. Whether you're a novice or an expert, gain actionable insights and strategies to elevate your data processes. Join us to see how FME and AI can revolutionize how you work with data!
Essentials of Automations: Exploring Attributes & Automation ParametersSafe Software
Building automations in FME Flow can save time, money, and help businesses scale by eliminating data silos and providing data to stakeholders in real-time. One essential component to orchestrating complex automations is the use of attributes & automation parameters (both formerly known as “keys”). In fact, it’s unlikely you’ll ever build an Automation without using these components, but what exactly are they?
Attributes & automation parameters enable the automation author to pass data values from one automation component to the next. During this webinar, our FME Flow Specialists will cover leveraging the three types of these output attributes & parameters in FME Flow: Event, Custom, and Automation. As a bonus, they’ll also be making use of the Split-Merge Block functionality.
You’ll leave this webinar with a better understanding of how to maximize the potential of automations by making use of attributes & automation parameters, with the ultimate goal of setting your enterprise integration workflows up on autopilot.
Generating privacy-protected synthetic data using Secludy and MilvusZilliz
During this demo, the founders of Secludy will demonstrate how their system utilizes Milvus to store and manipulate embeddings for generating privacy-protected synthetic data. Their approach not only maintains the confidentiality of the original data but also enhances the utility and scalability of LLMs under privacy constraints. Attendees, including machine learning engineers, data scientists, and data managers, will witness first-hand how Secludy's integration with Milvus empowers organizations to harness the power of LLMs securely and efficiently.
Skybuffer SAM4U tool for SAP license adoptionTatiana Kojar
Manage and optimize your license adoption and consumption with SAM4U, an SAP free customer software asset management tool.
SAM4U, an SAP complimentary software asset management tool for customers, delivers a detailed and well-structured overview of license inventory and usage with a user-friendly interface. We offer a hosted, cost-effective, and performance-optimized SAM4U setup in the Skybuffer Cloud environment. You retain ownership of the system and data, while we manage the ABAP 7.58 infrastructure, ensuring fixed Total Cost of Ownership (TCO) and exceptional services through the SAP Fiori interface.
The Microsoft 365 Migration Tutorial For Beginner.pptxoperationspcvita
This presentation will help you understand the power of Microsoft 365. However, we have mentioned every productivity app included in Office 365. Additionally, we have suggested the migration situation related to Office 365 and how we can help you.
You can also read: https://www.systoolsgroup.com/updates/office-365-tenant-to-tenant-migration-step-by-step-complete-guide/
Monitoring and Managing Anomaly Detection on OpenShift.pdfTosin Akinosho
Monitoring and Managing Anomaly Detection on OpenShift
Overview
Dive into the world of anomaly detection on edge devices with our comprehensive hands-on tutorial. This SlideShare presentation will guide you through the entire process, from data collection and model training to edge deployment and real-time monitoring. Perfect for those looking to implement robust anomaly detection systems on resource-constrained IoT/edge devices.
Key Topics Covered
1. Introduction to Anomaly Detection
- Understand the fundamentals of anomaly detection and its importance in identifying unusual behavior or failures in systems.
2. Understanding Edge (IoT)
- Learn about edge computing and IoT, and how they enable real-time data processing and decision-making at the source.
3. What is ArgoCD?
- Discover ArgoCD, a declarative, GitOps continuous delivery tool for Kubernetes, and its role in deploying applications on edge devices.
4. Deployment Using ArgoCD for Edge Devices
- Step-by-step guide on deploying anomaly detection models on edge devices using ArgoCD.
5. Introduction to Apache Kafka and S3
- Explore Apache Kafka for real-time data streaming and Amazon S3 for scalable storage solutions.
6. Viewing Kafka Messages in the Data Lake
- Learn how to view and analyze Kafka messages stored in a data lake for better insights.
7. What is Prometheus?
- Get to know Prometheus, an open-source monitoring and alerting toolkit, and its application in monitoring edge devices.
8. Monitoring Application Metrics with Prometheus
- Detailed instructions on setting up Prometheus to monitor the performance and health of your anomaly detection system.
9. What is Camel K?
- Introduction to Camel K, a lightweight integration framework built on Apache Camel, designed for Kubernetes.
10. Configuring Camel K Integrations for Data Pipelines
- Learn how to configure Camel K for seamless data pipeline integrations in your anomaly detection workflow.
11. What is a Jupyter Notebook?
- Overview of Jupyter Notebooks, an open-source web application for creating and sharing documents with live code, equations, visualizations, and narrative text.
12. Jupyter Notebooks with Code Examples
- Hands-on examples and code snippets in Jupyter Notebooks to help you implement and test anomaly detection models.
How information systems are built or acquired puts information, which is what they should be about, in a secondary place. Our language adapted accordingly, and we no longer talk about information systems but applications. Applications evolved in a way to break data into diverse fragments, tightly coupled with applications and expensive to integrate. The result is technical debt, which is re-paid by taking even bigger "loans", resulting in an ever-increasing technical debt. Software engineering and procurement practices work in sync with market forces to maintain this trend. This talk demonstrates how natural this situation is. The question is: can something be done to reverse the trend?
Fueling AI with Great Data with Airbyte WebinarZilliz
This talk will focus on how to collect data from a variety of sources, leveraging this data for RAG and other GenAI use cases, and finally charting your course to productionalization.
Have you ever been confused by the myriad of choices offered by AWS for hosting a website or an API?
Lambda, Elastic Beanstalk, Lightsail, Amplify, S3 (and more!) can each host websites + APIs. But which one should we choose?
Which one is cheapest? Which one is fastest? Which one will scale to meet our needs?
Join me in this session as we dive into each AWS hosting service to determine which one is best for your scenario and explain why!
How to Interpret Trends in the Kalyan Rajdhani Mix Chart.pdfChart Kalyan
A Mix Chart displays historical data of numbers in a graphical or tabular form. The Kalyan Rajdhani Mix Chart specifically shows the results of a sequence of numbers over different periods.
HCL Notes und Domino Lizenzkostenreduzierung in der Welt von DLAUpanagenda
Webinar Recording: https://www.panagenda.com/webinars/hcl-notes-und-domino-lizenzkostenreduzierung-in-der-welt-von-dlau/
DLAU und die Lizenzen nach dem CCB- und CCX-Modell sind für viele in der HCL-Community seit letztem Jahr ein heißes Thema. Als Notes- oder Domino-Kunde haben Sie vielleicht mit unerwartet hohen Benutzerzahlen und Lizenzgebühren zu kämpfen. Sie fragen sich vielleicht, wie diese neue Art der Lizenzierung funktioniert und welchen Nutzen sie Ihnen bringt. Vor allem wollen Sie sicherlich Ihr Budget einhalten und Kosten sparen, wo immer möglich. Das verstehen wir und wir möchten Ihnen dabei helfen!
Wir erklären Ihnen, wie Sie häufige Konfigurationsprobleme lösen können, die dazu führen können, dass mehr Benutzer gezählt werden als nötig, und wie Sie überflüssige oder ungenutzte Konten identifizieren und entfernen können, um Geld zu sparen. Es gibt auch einige Ansätze, die zu unnötigen Ausgaben führen können, z. B. wenn ein Personendokument anstelle eines Mail-Ins für geteilte Mailboxen verwendet wird. Wir zeigen Ihnen solche Fälle und deren Lösungen. Und natürlich erklären wir Ihnen das neue Lizenzmodell.
Nehmen Sie an diesem Webinar teil, bei dem HCL-Ambassador Marc Thomas und Gastredner Franz Walder Ihnen diese neue Welt näherbringen. Es vermittelt Ihnen die Tools und das Know-how, um den Überblick zu bewahren. Sie werden in der Lage sein, Ihre Kosten durch eine optimierte Domino-Konfiguration zu reduzieren und auch in Zukunft gering zu halten.
Diese Themen werden behandelt
- Reduzierung der Lizenzkosten durch Auffinden und Beheben von Fehlkonfigurationen und überflüssigen Konten
- Wie funktionieren CCB- und CCX-Lizenzen wirklich?
- Verstehen des DLAU-Tools und wie man es am besten nutzt
- Tipps für häufige Problembereiche, wie z. B. Team-Postfächer, Funktions-/Testbenutzer usw.
- Praxisbeispiele und Best Practices zum sofortigen Umsetzen
"Frontline Battles with DDoS: Best practices and Lessons Learned", Igor IvaniukFwdays
At this talk we will discuss DDoS protection tools and best practices, discuss network architectures and what AWS has to offer. Also, we will look into one of the largest DDoS attacks on Ukrainian infrastructure that happened in February 2022. We'll see, what techniques helped to keep the web resources available for Ukrainians and how AWS improved DDoS protection for all customers based on Ukraine experience
Northern Engraving | Nameplate Manufacturing Process - 2024Northern Engraving
Manufacturing custom quality metal nameplates and badges involves several standard operations. Processes include sheet prep, lithography, screening, coating, punch press and inspection. All decoration is completed in the flat sheet with adhesive and tooling operations following. The possibilities for creating unique durable nameplates are endless. How will you create your brand identity? We can help!
Astute Business Solutions | Oracle Cloud Partner |
Access
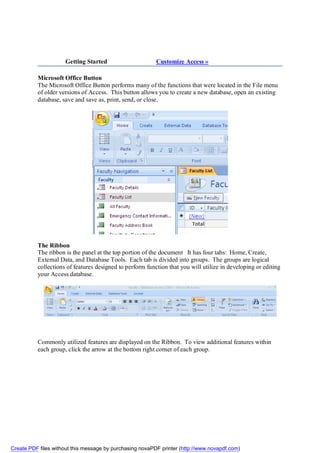
1. Getting Started Customize Access »
Microsoft Office Button
The Microsoft Office Button performs many of the functions that were located in the File menu
of older versions of Access. This button allows you to create a new database, open an existing
database, save and save as, print, send, or close.
The Ribbon
The ribbon is the panel at the top portion of the document It has four tabs: Home, Create,
External Data, and Database Tools. Each tab is divided into groups. The groups are logical
collections of features designed to perform function that you will utilize in developing or editing
your Access database.
Commonly utilized features are displayed on the Ribbon. To view additional features within
each group, click the arrow at the bottom right corner of each group.
Create PDF files without this message by purchasing novaPDF printer (http://www.novapdf.com)
2. Home: Views, Clipboard, Fonts, Rich Text, Records, Sort & Filter, Find
Create: Tables, Forms, Reports, Other
External Data: Import, Export, Collect Data, SharePoint Lists
Database Tools: Macro, Show/Hide, Analyze, Move Data, Database Tools
Quick Access Toolbar
The quick access toolbar is a customizable toolbar that contains commands that you may want
to use. You can place the quick access toolbar above or below the ribbon. To change the
location of the quick access toolbar, click on the error at the end of the toolbar and click Show
Below the Ribbon.
Create PDF files without this message by purchasing novaPDF printer (http://www.novapdf.com)
3. Navigation Pane
The Navigation Pane displays database objects such as tables, forms, queries, and reports.
Tabbed Document Window Viewing
Tabbed document viewing opens tables, forms, queries and reports in the same window. Click
the tabs to switch between windows.
Create PDF files without this message by purchasing novaPDF printer (http://www.novapdf.com)
4. Customize Access Database Terms »
Access 2007 offers a wide range of customizable options that allow you to make Access work
the best for you. To access these customizable options:
Click the Office Button
Click Access Options
Popular
These features allow you to personalize your work environment with the use of ScreenTips, the
location and file format of the databases, and the username.
Create PDF files without this message by purchasing novaPDF printer (http://www.novapdf.com)
5. Current Database
This feature allows you to set options for the Application, Navigation, Ribbon and Toolbars,
AutoCorrect, and Filters.
Create PDF files without this message by purchasing novaPDF printer (http://www.novapdf.com)
6. Datasheet
This features allows you to personalize options in the way the datasheet looks, including default
colors, gridlines and cell effect, and font.
Create PDF files without this message by purchasing novaPDF printer (http://www.novapdf.com)
7. Object Designers
This feature allows you to customize the options for creating and modifying database objects in
Access including Table Design, Query Design, Forms/Reports, and Error Checking.
Create PDF files without this message by purchasing novaPDF printer (http://www.novapdf.com)
8. Proofing
This features allows you to change how Access automatically correct and formats the contents of
the database and how it indicates errors.
Create PDF files without this message by purchasing novaPDF printer (http://www.novapdf.com)
9. Advanced
This feature allows for advanced customization of Access including, Editing, Display, Printing,
and other advanced options.
Customize
Customize allows you to add features to the Quick Access Toolbar. If there are tools that you
are utilizing frequently, you may want to add these to the Quick Access Toolbar.
Create PDF files without this message by purchasing novaPDF printer (http://www.novapdf.com)
10. Database Terms Create a New Database »
Table
A table is a collection of information arranged in rows and columns. Information about an item
is displayed in a row. Columns contain the same type of information for each item. The table
has a header row that tells you what data is contained in the columns.
To view data in a table:
Click the arrow to open the navigation pane
Double-click on the table name to open the table
Create PDF files without this message by purchasing novaPDF printer (http://www.novapdf.com)
11. Query
Queries select records from one or more tables in a database so they can be viewed, analyzed,
and sorted on a common datasheet. A query can also perform calculations and display the
results. The resulting collection of records, called a dynaset (short for dynamic subset), is saved
as a database object and can therefore be easily used in the future. The query will be updated
whenever the original tables are updated. Types of queries are select queries that extract data
from tables based on specified values, find duplicate queries that display records with duplicate
values for one or more of the specified fields, and find unmatched queries display records from
one table that do not have corresponding values in a second table.
To run a query:
Click the arrow to open the navigation pane
Double-click on the query name
Create PDF files without this message by purchasing novaPDF printer (http://www.novapdf.com)
12. Recordset
A recordset is a table that displays groups of records from a base table or as a query result.
Form
A form is a graphical interface that is used to display and edit data. Forms can be developed
from a table or a query. Forms can include calculations, graphics and objects.
To view data using a form:
Click the arrow to open the navigation pane
Double-click on the form name
Create PDF files without this message by purchasing novaPDF printer (http://www.novapdf.com)
13. Report
A report is an output of data arranged in the order you specify. Reports can perform calculations
and display the results. Reports can be used to print data.
To view data using a form:
Click the arrow to open the navigation pane
Double-click on the report name
Create a New Database Create a Table »
You can create a new database from scratch or you can create a database from the database
wizard.
New Database
To create a new database from scratch:
Create PDF files without this message by purchasing novaPDF printer (http://www.novapdf.com)
14. Click the Microsoft Office Button
Click New
Click the New Blank Database icon
Type in a name for the database
Click Create
Database Templates
To create a new database from the database templates:
Click the Microsoft Office Button
Click New
Choose the type of database you wish to create
Create PDF files without this message by purchasing novaPDF printer (http://www.novapdf.com)
15. Type in the name for the database
Click Create
Create a Table Manage Tables »
Table Views
There are two ways to view a table in Access to add data to the table: Design View and
Datasheet View.
In Design View you can view all the fields with the data types and descriptions. The records of
information that has been added to the database is not viewable.
Create PDF files without this message by purchasing novaPDF printer (http://www.novapdf.com)
16. To go to Design View:
Click the down arrow on the View button
Click Design View
Create PDF files without this message by purchasing novaPDF printer (http://www.novapdf.com)
17. In Datasheet View you can display the records in a table, where one row is one record. The
column headers are the fields you have defined for the database.
To go to Datasheet View:
Click the down arrow on the View button
Click Datasheet View
Adding New Fields
There are many ways to enter new fields into a database. New fields can be added in the
Datasheet View or in the Design View.
There are two ways to add a new field in Datasheet View: Add A New Field or the New Field
Button.
To add a New Field within the Datasheet:
Click the Add New Field column
Create PDF files without this message by purchasing novaPDF printer (http://www.novapdf.com)
18. To add a new field by using the New Field Button
Click the Datasheet tab on the Ribbon
Click the New Field Button
Choose the type of field you wish to add from the Field Templates window
To add a new field in Design View:
Click the Design View button
Click on the next available field
Type in the Name of the field
Create PDF files without this message by purchasing novaPDF printer (http://www.novapdf.com)
19. Data Types
There are many types a data that a field can be predefined to hold. When you create a new field
in a database you should closely match the data type to what will be entered into the field.
Text Text, number, or a combination up to 255
characters
Memo Similar to the text field, can contain text,
numbers, or a combination up to 2 GB of
data.
Number Numbers up to 16 bytes of data
Date/Time Date and Time information
Currency Currency up to 8 bytes and precise to 4
decimal places
AutoNumber Access creates a unique number for each new
record. This is often the primary key for the
table
Yes/No Yes and No, stored as -1 for yes and 0 for no
OLE Object Images, documents, graphs up to 2 GB
Hyperlink Web addresses
Attachment Attachments such as images, spreadsheets,
documents, and charts.
Editing Data Types in Fields
When creating tables, you should define the data types of the tables to most closely match the
type of data that will be entered in the field.
Create PDF files without this message by purchasing novaPDF printer (http://www.novapdf.com)
20. To edit the Data Type in Datasheet View:
Click the field you wish to define
Click the Datasheet tab on the Ribbon
Click the down arrow next to Data Type
Choose the type of data that will be entered into the field
To edit the format of the data:
Click the field you wish to define
Click the Datasheet tab on the Ribbon
Click the down arrow next to Format
To edit the Data Type in the Design View:
Click Design View
Click the field name you wish to define or create a new field
Click the Data Type
Choose the appropriate Data Type
Create PDF files without this message by purchasing novaPDF printer (http://www.novapdf.com)
21. Format the field in the Field Properties Dialog box
Manage Tables Keys »
Delete a Table
To delete a table:
Open the desired database by clicking the Microsoft Office Button and clicking Open
Right click on a table and choose Delete
Create PDF files without this message by purchasing novaPDF printer (http://www.novapdf.com)
22. Rename a Table
To rename a table:
Open the desired database by clicking the Microsoft Office Button and clicking Open
Right click on a table and choose Rename
Type in the new name
Create PDF files without this message by purchasing novaPDF printer (http://www.novapdf.com)
23. Add a Description to a Table
To add a description to a table
Open the desired database by clicking the Microsoft Office Button and clicking Open
Right click on a table and choose Table Properties
Click the Description text box
Type in the description
Keys Table Relationships »
Create PDF files without this message by purchasing novaPDF printer (http://www.novapdf.com)
24. Primary Key
The primary key is a unique identifier for a record. The primary key cannot be the same for two
records. This field can never be blank.
Composite Key
A composite key is a primary key that is comprised of two or more fields. It can also be called a
compound or concatenated key.
Foreign Key
A foreign key is a field or combination of fields that are related to the primary key of another
table.
Table Relationships Managing Data »
Table relationships are the associations of data between tables. By defining table relationships,
you can pull records from related tables based on matching fields.
Create PDF files without this message by purchasing novaPDF printer (http://www.novapdf.com)
25. One-to-One Relationship
A one-to-one relationship is between two tables where the primary key in one table and the
foreign key in another table are the same. For each record in the first table, there is a single
matching record in the second table.
One-to-Many Relationship
A one-to-many relationship occurs between two tables where the primary key in one table can be
duplicated many times in another table
Create PDF files without this message by purchasing novaPDF printer (http://www.novapdf.com)
26. Creating Table Relationships
To create relationships between tables:
Click the Database Tools tab on the Ribbon
Click the Relationships button
Click on the Design tab
Click Show Table
Select the desired tables
Create PDF files without this message by purchasing novaPDF printer (http://www.novapdf.com)
27. Click Add
Click Close
Click the field you wish to create a relationship from
Drag it to the matching field in the other table
Click Create
Create PDF files without this message by purchasing novaPDF printer (http://www.novapdf.com)
28. Print a Table Relationship
Click the Database Tools tab
Click the Relationships Button
Click the Relationship Report Button on the Design tab
Click the Print button
Create PDF files without this message by purchasing novaPDF printer (http://www.novapdf.com)
29. Managing Data Querying a Database »
Add Records to a Table
To add a new record to a table:
Open the table in Datasheet View
Click the New Cell
Type in your new record
Find and Replace
To find data:
Click the Find button on the Home tab
Create PDF files without this message by purchasing novaPDF printer (http://www.novapdf.com)
30. To find and replace data:
Click the Replace button on the Home tab
When you are searching for data for a find, replace or go to, you have several options in the Find
Dialog Box. These options are:
Find What Text Box Type the text you wish to find
Link in Drop Drop-Down List Use the drop-down list to
specify a table or a column to
search
Match Drop-Down List Use the drop-down list to
narrow down the search to a
field or the beginning of a
field
Search Drop-Down List Use this drop-down to specify
the direction to search.
Match Case Check Box Use this check box to specify
whether to search by the same
upper and lower case letters.
Totals
The totals button provides you the opportunity to add a totals row to your database. The total
can be the sum, average, a count, minimum, maximum, standard deviation, or the variance. To
set up a totals row:
Create PDF files without this message by purchasing novaPDF printer (http://www.novapdf.com)
31. Click the Totals button on the Home tab
Click the down arrow of the cell where you want the totals
Click the appropriate choice
Sort Records
You can sort records in a datasheet by a single column or by two adjacent columns. To sort
records by a single column:
Select the field you wish to sort
Click the Sort Ascending or Sort Descending button
Create PDF files without this message by purchasing novaPDF printer (http://www.novapdf.com)
32. To sort two columns:
Move the columns to they are adjacent to each other
Select the desired columns for sorting by holding the shift key and clicking the columns
Click the Sort Ascending or Sort Descending button
To clear the sort:
Click the Clear Sort button
Filter
You can filter records to include only records that you want to display. To filter by a column:
Open the database in Datasheet View
Click the down arrow in the field label
Choose the appropriate filter criteria
Click OK
Create PDF files without this message by purchasing novaPDF printer (http://www.novapdf.com)
33. To remove a filter:
Click the filter button on the field label
Click Clear Filter
Click OK
Create PDF files without this message by purchasing novaPDF printer (http://www.novapdf.com)
34. Querying a Database Calculated Fields »
A query allows you to select and filter data from multiple tables. Queries can be saved and
utilized as often as you need them.
Query Wizard
The Query Wizard walks you through the steps to set up a query. To run a query using the query
wizard:
Click the Create tab
Click the Query Wizard button
Choose the type of query you wish to run
Click OK
Choose the fields you wish to include from each table
To select fields from different tables, click the Tables/Queries down arrow
Click Next
Create PDF files without this message by purchasing novaPDF printer (http://www.novapdf.com)
35. Insert pic of query wizard
Type in a title for the query
Click Finish
The query will display
Create PDF files without this message by purchasing novaPDF printer (http://www.novapdf.com)
36. To switch between tables and queries:
Open the Navigation Pane
Double click the name of the table or query you wish to view
Create PDF files without this message by purchasing novaPDF printer (http://www.novapdf.com)
37. Query Design Feature
You can also design a query with the Query Design Button. To design a query using the Query
Design Button:
Click the Query Design Button on the Create tab
Select the tables that you would like to query
Click Add
Double click the name of the field you would like to query
Repeat this process for as many fields as you would like in the query
Create PDF files without this message by purchasing novaPDF printer (http://www.novapdf.com)
38. Click Run
Query Criteria
Query criteria are search conditions used in a query to retrieve specific data. You can set query
criteria to be a specific number or data set, or you can set the criteria to be a range of data.
“value” Will only display items that
are that exact value (replace
the word value with what
Create PDF files without this message by purchasing novaPDF printer (http://www.novapdf.com)
39. you want to search by)
= Is equal to
< Less than
<= Less than or equal to
> Greater than
>= Greater than or equal to
<> Not equal to
Between X And Y Within a range (replace X &
Y with values)
Is Null Null values
And True only if both conditions
exist
Or True if either condition exists
Not True if the single instance is
not true
To specify search criteria:
Click the query that you wish to add conditions
Type in the appropriate query criteria in the Criteria Box
Calculated Fields Designing Forms »
A calculated field is a field that gets its information from the calculations performed on other
fields. You can build calculated fields in the Query screen by using the addition (+), subtraction
(-), multiplication (*) and division (/) operators.
Expressions
Expressions a combination of functions, field names, numbers, text, and the operators listed
above.
To build an expression to create a calculated field:
Open an existing query or start a new query
Click on the View Button
Click on Design View
Create PDF files without this message by purchasing novaPDF printer (http://www.novapdf.com)
40. In the Query Pane, right-click on the field where you would like to create the calculation
Click Build
Choose the tables that you wish to build the calculation from
Double-click the field that you want to include in the calculation
Click the operator that you wish to include in the calculation
Click the second field you wish to include in the calculation
Click OK
Create PDF files without this message by purchasing novaPDF printer (http://www.novapdf.com)
41. Click Run
Zoom
The Zoom Dialog Box allows you to view an entire expression at one time. To view the Zoom
Dialog Box:
In Design View, right click on the field you want to display
Click Zoom
Create PDF files without this message by purchasing novaPDF printer (http://www.novapdf.com)
42. Designing Forms Generating Reports »
Forms allow you to control the look and feel of the screen for the input of data and the reports
generated.
Form Views
There are three ways to view forms in Access:
Allows you to design a form
Design View that includes a header, a
footer, and details in the
form. You can also add
images and control which
fields appear on the form.
Form View This is a dynamic page
which allows the user to
enter and edit data or
navigate through data in a
field.
Layout View This view allows you to
design the form and
manipulate data.
Create a Form
You can create a form from a table or a query. To create a form:
Click the Create tab
Click the Form Design button
Create PDF files without this message by purchasing novaPDF printer (http://www.novapdf.com)
43. Click the Format tab
Click the Add Existing Fields Button
In the Field List box on the right, click and drag the fields you would like on the form
To change the colors and fonts, click the Property Sheet button on the Arrange tab
Insert pic of property sheet button
Create PDF files without this message by purchasing novaPDF printer (http://www.novapdf.com)
44. Choose the Section you wish to modify
Choose the properties you wish to modify
To preview the form:
Click the Views button on the Home tab
Click the Form View button
Create PDF files without this message by purchasing novaPDF printer (http://www.novapdf.com)
45. Form Wizard
You can create forms with the help of the Form Wizard. To use the form wizard:
On the create tab, click the More Forms down arrow
Click Form Wizard
Choose the Tables/Queries that you wish to have on the form
Choose the fields you wish to have on the forms
Click Next
Create PDF files without this message by purchasing novaPDF printer (http://www.novapdf.com)
46. Chose the layout for the form
Click Next
Choose a style
Click Next
Create PDF files without this message by purchasing novaPDF printer (http://www.novapdf.com)
47. Create a title for the form
Choose whether you want to open the form to view it or modify the form’s design
Click Finish
Generating Reports Print a Report »
Reports are a means to view and analyze large amounts of data. You can use the Report
Wizard or create a custom report that meets your specific needs.
Report Views
Reports can be displayed in four views:
This view provides you with the
Design View structure of your report. You can
add, modify or delete components
of the report but you cannot
manipulate the data in the tables
associated with the report.
Report View This view allows you to view the
data from the table but not to
change any layout of the report.
Layout View This view allows you to see data
from the table and add, modify,
and delete components of the
report.
Create PDF files without this message by purchasing novaPDF printer (http://www.novapdf.com)
48. Print Preview This view allows you to see what
your report will look like when it
is printed.
To change report views:
Click the View button on the Home tab
Create a Report
To create a blank report:
Click the Blank Report button on the Create tab
Click the Add Existing Fields button
From the field list, Click and drag the fields to the report
Create PDF files without this message by purchasing novaPDF printer (http://www.novapdf.com)
49. Report Wizard
To create a report using the report wizard:
On the Create tab, click the Report Wizard button
Choose the Tables/Queries that you wish to have on the form
Choose the fields you wish to have on the forms
Click Next
Create PDF files without this message by purchasing novaPDF printer (http://www.novapdf.com)
50. Choose the sort order for your report
Chose the layout for the form
Click Next
Create PDF files without this message by purchasing novaPDF printer (http://www.novapdf.com)
51. Choose a style
Click Next
Create a title for the form
Choose whether you want to open the form to view it or modify the form’s design
Create PDF files without this message by purchasing novaPDF printer (http://www.novapdf.com)
52. Click Finish
Custom Calculated Fields
You can create reports that include calculated fields. These reports will display information that
you wish to report with an arithmetic calculation. To add a custom calculated field to a report:
Open the Report that you wish to add to
Click the View button
Click Design View
Create PDF files without this message by purchasing novaPDF printer (http://www.novapdf.com)
53. Click the Design tab
Click the Text Box button
Click the section on the report where you would like to locate the textbox
Click the Property Sheet Pane
Click the Data tab
Click the three dots next to Control Source
Create PDF files without this message by purchasing novaPDF printer (http://www.novapdf.com)
54. Insert the fields you wish to include in the calculation and the mathematical operations.
Click OK
Create PDF files without this message by purchasing novaPDF printer (http://www.novapdf.com)
55. Access 2007 Tutorial
Print a Report
Menu »
After you have generated a report, you can print the report. To print the report:
Print a Report
To print a report:
Select the report you wish to print
Right-click on the Report Name
Click Print Preview
Choose the appropriate layout, margins, and paper size in the Page Layout group
Create PDF files without this message by purchasing novaPDF printer (http://www.novapdf.com)
56. Click Print
Click OK
Create PDF files without this message by purchasing novaPDF printer (http://www.novapdf.com)