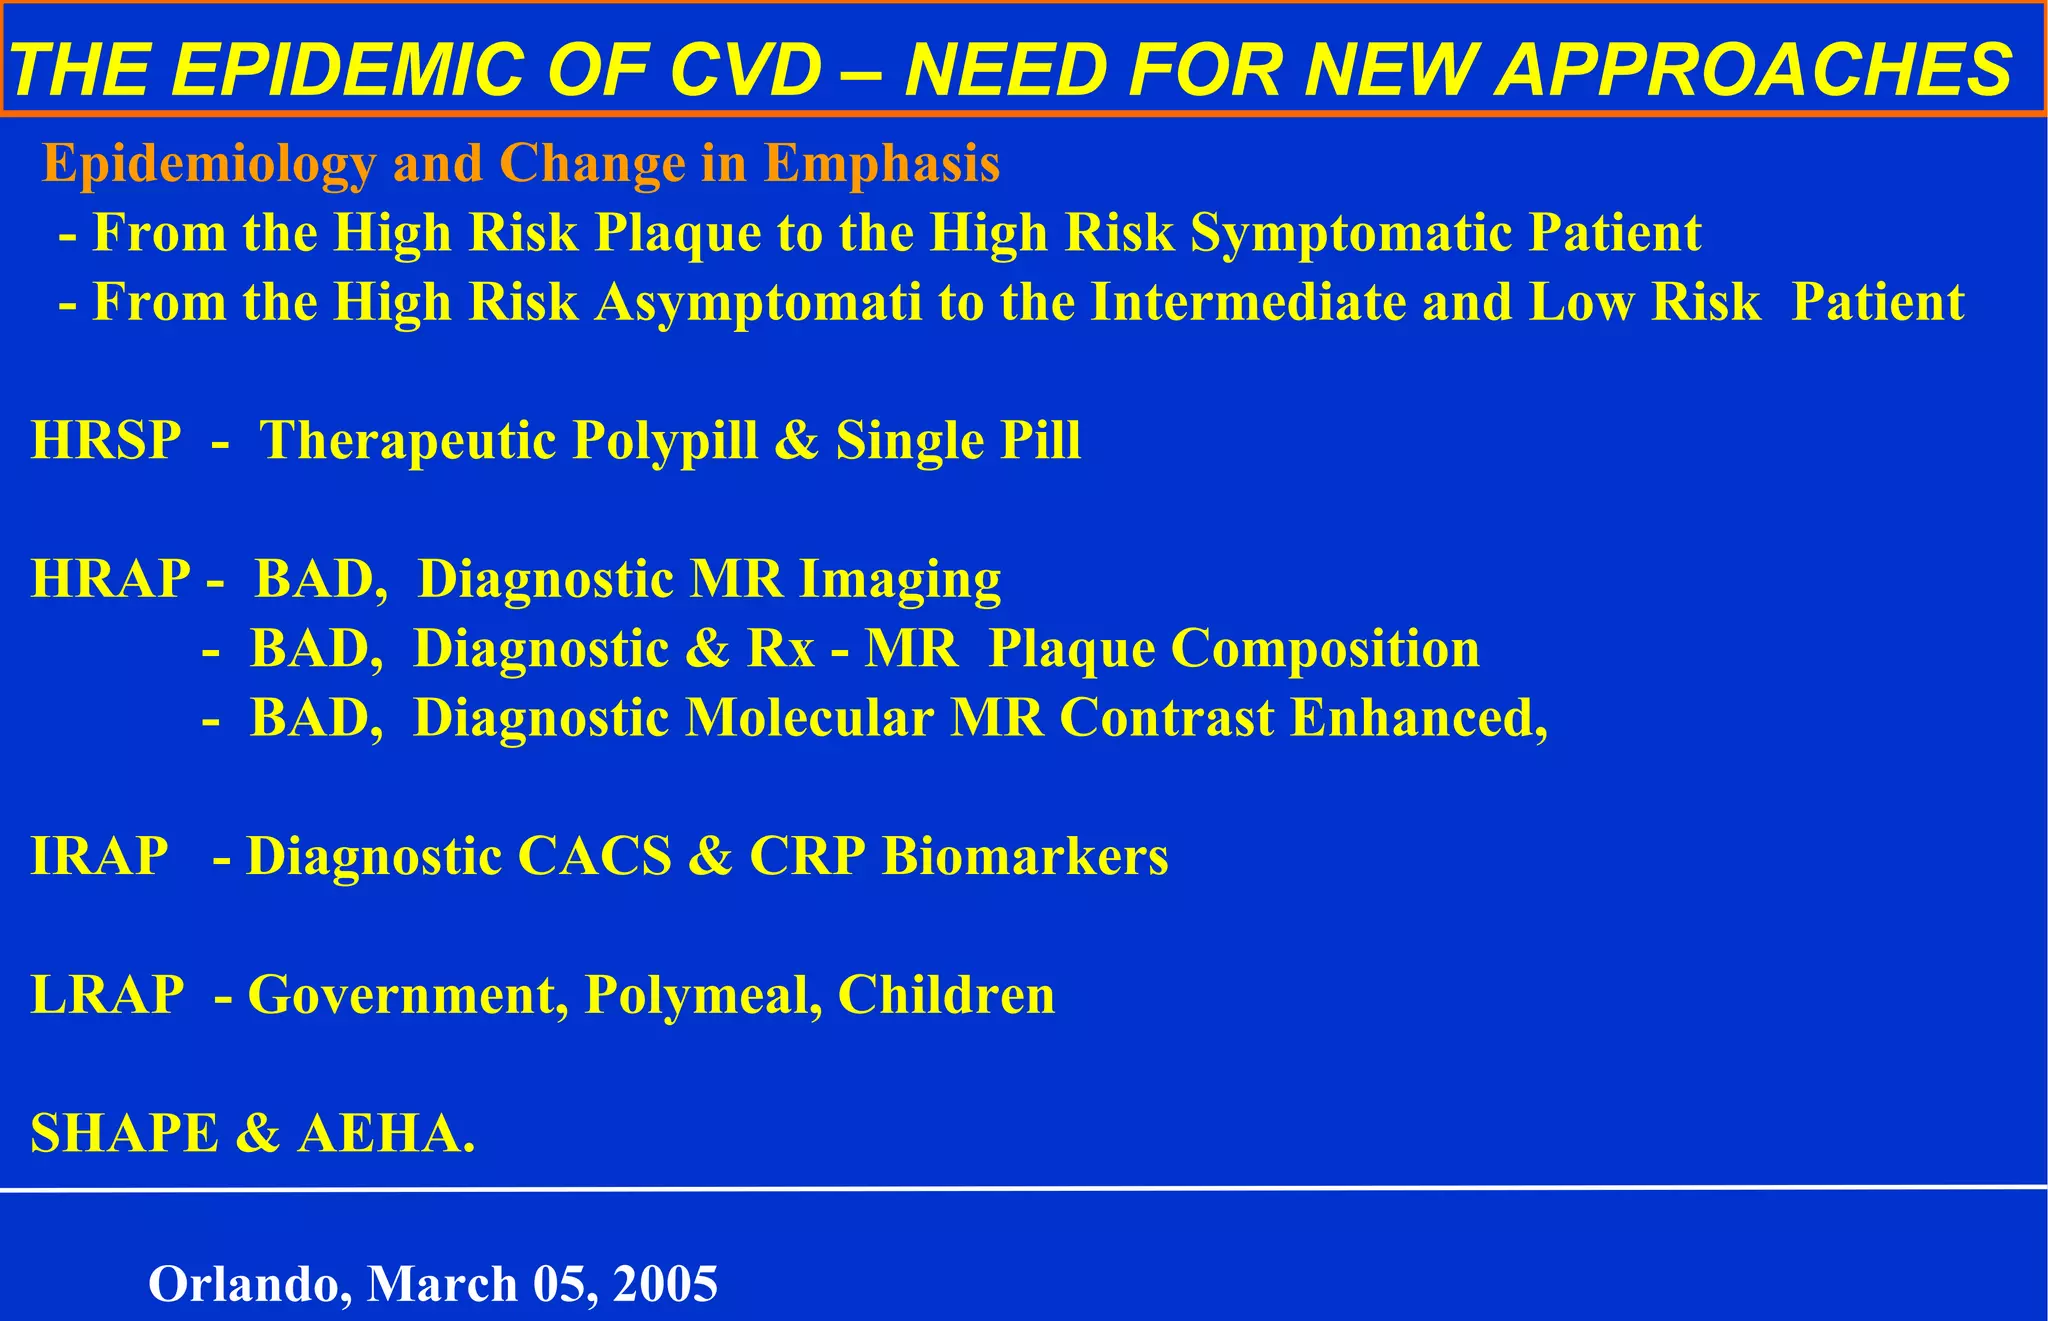
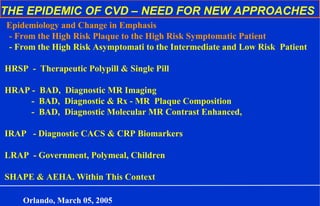
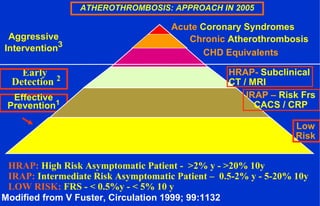
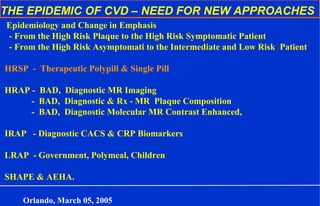
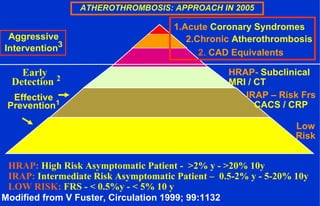
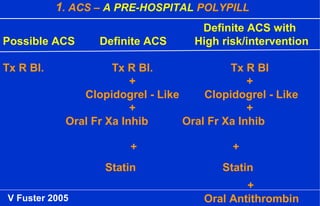
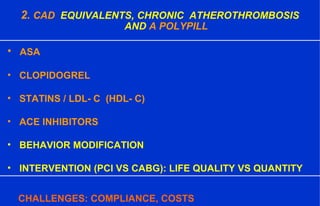
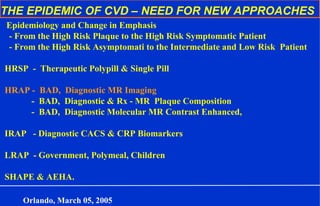
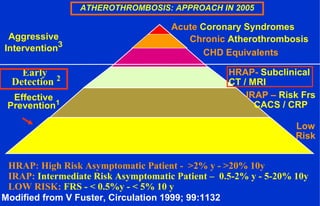
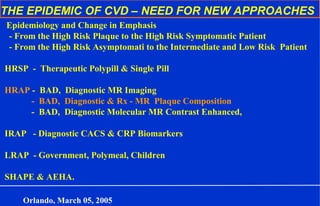
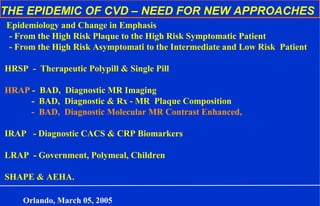
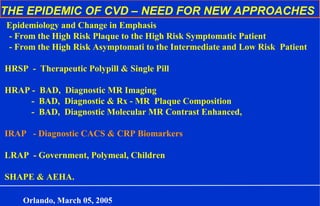
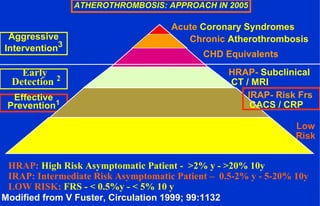
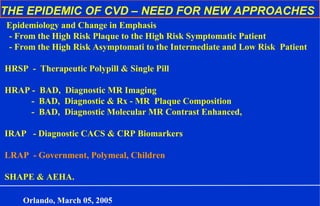
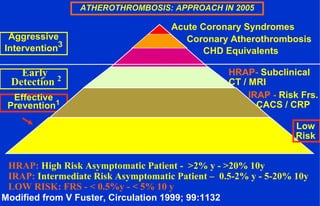
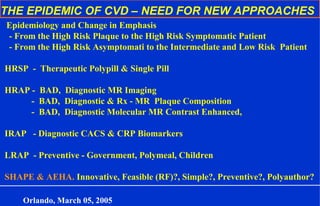
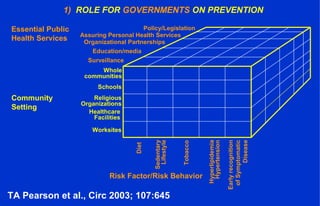
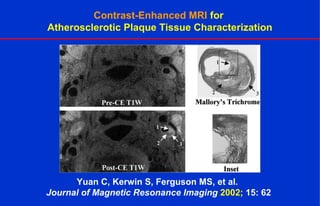
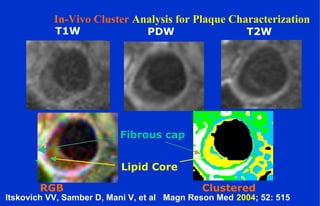
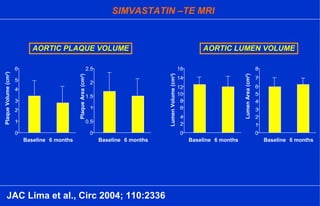
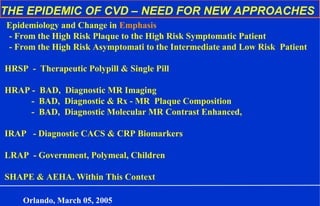
THE EPIDEMIC OF CVD – NEED FOR NEW APPROACHES
Epidemiology and Change in Emphasis
- From the High Risk Plaque to the High Risk Symptomatic Patient
- From the High Risk Asymptomati to the Intermediate and Low Risk Patient
HRSP - Therapeutic Polypill & Single Pill
HRAP - BAD, Diagnostic MR Imaging
- BAD, Diagnostic & Rx - MR Plaque Composition
- BAD, Diagnostic Molecular MR Contrast Enhanced,
IRAP - Diagnostic CACS & CRP Biomarkers
LRAP - Government, Polymeal, Children
SHAPE & AEHA.
Orlando, March 05, 2005
0
5
10
15
20
25
30
1990 2020
MillionsofDeaths
fromCardiovascularCauses
Western countries
Non-Western (developing)
countries
5
9
6
19
DEATHS FROM CARDIOVASCULAR CAUSES,
WORLDWIDE, IN 1990 AND ESTIMATED FOR 2020
KS Reddy. NEJM 2004; 350:2438
Prevalence of Obesity & Diabetes in the U.S.
1990/19911990/1991 20002000
ejt 0901–120
Mokdad et al., JAMA 286:1195–1200, 2001Mokdad et al., JAMA 286:1195–1200, 2001
No DataNo Data < 4%< 4% 4%-6%4%-6% > 6%> 6%
No DataNo Data < 10%< 10% 10%-14%10%-14% 15%-19%15%-19% ≥≥ 20%20%
ObesityObesity
DiabetesDiabetes
0
10
20
30
40
50
Hypertri-
glycerinemia
Low
HDL
Hyper-
glycemia
Central
Obesity
Male
Female
Prevalence(%)
Hyper-
tension
METABOLIC ABNORMALITIES
AMERICAN ADOLESCENTS (12-19 Y)1
1
NHANES III - n=1960
S.D.de Ferranti et al., Circ 2004; 110:2494
THE EPIDEMIC OF CVD – NEED FOR NEW APPROACHES
Epidemiology and Change in Emphasis
- From the High Risk Plaque to the High Risk Symptomatic Patient
- From the High Risk Asymptomati to the Intermediate and Low Risk Patient
HRSP - Therapeutic Polypill & Single Pill
HRAP - BAD, Diagnostic MR Imaging
- BAD, Diagnostic & Rx - MR Plaque Composition
- BAD, Diagnostic Molecular MR Contrast Enhanced,
IRAP - Diagnostic CACS & CRP Biomarkers
LRAP - Government, Polymeal, Children
SHAPE & AEHA. Within This Context
Orlando, March 05, 2005
ATHEROTHROMBOSIS: APPROACH IN 2005
Aggressive
Intervention3
Effective
Prevention1
2.Chronic Atherothrombosis
2. CAD Equivalents
HRAP- Subclinical
MRI / CT
Low
Risk
Modified from V Fuster, Circulation 1999; 99:1132
IRAP – Risk Frs
CACS / CRP
1.Acute Coronary Syndromes
Early
Detection 2
HRAP: High Risk Asymptomatic Patient - >2% y - >20% 10y
IRAP: Intermediate Risk Asymptomatic Patient – 0.5-2% y - 5-20% 10y
LOW RISK: FRS - < 0.5%y - < 5% 10 y
METHODS TO ASSESS PLAQUE VULNERABILITY
Intravascular ultrasound
Three-dimensional reconstruction
Ultrasound elastography
Intravascular ultrasound flow measurements
Virtual histology
Angiography
Direct visualization
Optical coherence tomography
RAMAN (near infrared) spectroscopy
Thermography
Computed tomography
Contrast
Ultrafast
Magnetic Resonance
Phase Contrast
Nuclear
Intravascular
B Meier. Heart 2004; 90:1395
HIGH RISK PLAQUES - HRP
HIGH RISK BLOOD - HRB
BURDEN OF ATHEROTHROMBOSIS DISEASE - BAD
a) HRP / HRB / BAD - Systemic
b) HRP – Abundant
c) HRP AND HRB – Regionally Different
Maseri A, Fuster V, Circulation 2003; 107: 2068
Fuster V, Kim RJ, Circulation 2005 (In Press)
ACS (N=198) & SYSTEMIC ENDOTHELIAL DYSFUNCTION (FBF) – 5 DAYS 1
ADJUSTED RISK FACTORS, CV EVENTS (DEATH, MI, STROKE)- Av 4 YRS
Fichtlscherer et al., Circ 2004; 110:1926 (Frankfurt)
70
80
90
100
0 365 730 1095 1460 1825
days of follow up
Proportionofpatients
withouCVevents(%)
Logrank test p<0.03
Acetylcholine - dose - response
70
80
90
100
0 365 730 1095 1460 1825
days of follow up
Proportionofpatients
withouCVevents(%)
Logrank test p<0.08
Sodium nitroprusside - dose - response
≥ 35.0 (1. quartile)
< 34.9 (2. quartile)
< 24.3 (3. quartile)
< 15.6 (4. quartile)
≥ 31.6 (1. quartile)
< 31.5 (2. quartile)
< 18.7 (4. quartile)
< 24.1 (3. quartile)
1
Improved response at 8 weeks adds to the prediction (ACH)
CAD (ACS 54%) - CULPRIT VESSEL / LESION – N=843
NON-STENOTIC YELLOW PLAQUES / THROMBUS – N=1253
0
20
40
60
80
100
1 2 3
Color Grade of Plaque
PrevalenceofThrombosis
*
† ‡
(%)
*P=.0003 vs grade 1. †P<.0001 vs grade 1. ‡P<.0001 vs grade 2
Y Ueda et al., AHJ 2004; 148:842 (Osaka)
CAROTID ACTIVE PLAQUES (ENDARTERECTOMY)
CAP RUPTURE AND CAP EROSION BY STUDY GROUP
ICTB (LG Spagnoli et al.) JAMA 2004; 292:1895 (Rome, Mineapolis, Mayo)
C Yuan et al Circ 2002;105:181 (Seattle) – MRI – Several Plaques
No. of Plaques (%) P Val
Ipsilat. Stroke With TIA Asymptom. Stroke vs Stroke vs TIA vs
(n=96) (n=91) (n=82) TIA Asympt. Asympt.
Thromb. active % 74.0 35.2 14.6 <.001 <.001 .002
Cap rupture 66.7 23.1 13.4 <.001 <.001 .004
Cap erosion 7.3 12.1 1.2 .51 .09 .03
THE EPIDEMIC OF CVD – NEED FOR NEW APPROACHES
Epidemiology and Change in Emphasis
- From the High Risk Plaque to the High Risk Symptomatic Patient
- From the High Risk Asymptomatic to the Intermediate and Low Risk Patient
HRSP - Therapeutic Polypill & Single Pill
HRAP - BAD, Diagnostic MR Imaging
- BAD, Diagnostic & Rx - MR Plaque Composition
- BAD, Diagnostic Molecular MR Contrast Enhanced,
IRAP - Diagnostic CACS & CRP Biomarkers
LRAP - Government, Polymeal, Children
SHAPE & AEHA.
Orlando, March 05, 2005
ATHEROTHROMBOSIS: APPROACH IN 2005
Aggressive
Intervention3
Effective
Prevention1
Chronic Atherothrombosis
CHD Equivalents
HRAP- Subclinical
CT / MRI
Low
Risk
Modified from V Fuster, Circulation 1999; 99:1132
IRAP – Risk Frs
CACS / CRP
Acute Coronary Syndromes
Early
Detection 2
HRAP: High Risk Asymptomatic Patient - >2% y - >20% 10y
IRAP: Intermediate Risk Asymptomatic Patient – 0.5-2% y - 5-20% 10y
LOW RISK: FRS - < 0.5%y - < 5% 10 y
THE EPIDEMIC OF CVD – NEED FOR NEW APPROACHES
Epidemiology and Change in Emphasis
- From the High Risk Plaque to the High Risk Symptomatic Patient
- From the High Risk Asymptomati to the Intermediate and Low Risk Patient
HRSP - Therapeutic Polypill & Single Pill
HRAP - BAD, Diagnostic MR Imaging
- BAD, Diagnostic & Rx - MR Plaque Composition
- BAD, Diagnostic Molecular MR Contrast Enhanced,
IRAP - Diagnostic CACS & CRP Biomarkers
LRAP - Government, Polymeal, Children
SHAPE & AEHA.
Orlando, March 05, 2005
ATHEROTHROMBOSIS: APPROACH IN 2005
Aggressive
Intervention3
Effective
Prevention1
2.Chronic Atherothrombosis
2. CAD Equivalents
HRAP- Subclinical
MRI / CT
Low
Risk
Modified from V Fuster, Circulation 1999; 99:1132
IRAP – Risk Frs
CACS / CRP
1.Acute Coronary Syndromes
Early
Detection 2
HRAP: High Risk Asymptomatic Patient - >2% y - >20% 10y
IRAP: Intermediate Risk Asymptomatic Patient – 0.5-2% y - 5-20% 10y
LOW RISK: FRS - < 0.5%y - < 5% 10 y
x
Patient Transport In-hospital Reperfusion
2004
2014
0 1 2 3
A B C D
Hours
Methods of Speeding Time to Reperfusion:
A B C D
Media Campaign 911 Expansion Regionalization PCI-Eluted Stents
Patient Education Pre-hosp. Rx MI protocol New devices / demand
1. MI - TIME TO REPERFUSION – 2005, 2015
X New antithrombotics, Myoc-Imaging., AICD, RF modification
x
X
1. ACS – A PRE-HOSPITAL POLYPILL
V Fuster 2005
Definite ACS with
Possible ACS Definite ACS High risk/intervention
Tx R Bl. Tx R Bl. Tx R Bl
+ +
Clopidogrel - Like Clopidogrel - Like
+ +
Oral Fr Xa Inhib Oral Fr Xa Inhib
+ +
Statin Statin
+
Oral Antithrombin
2. CAD EQUIVALENTS, CHRONIC ATHEROTHROMBOSIS
AND A POLYPILL
• ASA
• CLOPIDOGREL
• STATINS / LDL- C (HDL- C)
• ACE INHIBITORS
• BEHAVIOR MODIFICATION
• INTERVENTION (PCI VS CABG): LIFE QUALITY VS QUANTITY
CHALLENGES: COMPLIANCE, COSTS
THE EPIDEMIC OF CVD – NEED FOR NEW APPROACHES
Epidemiology and Change in Emphasis
- From the High Risk Plaque to the High Risk Symptomatic Patient
- From the High Risk Asymptomati to the Intermediate and Low Risk Patient
HRSP - Therapeutic Polypill & Single Pill
HRAP - BAD, Diagnostic MR Imaging
- BAD, Diagnostic & Rx - MR Plaque Composition
- BAD, Diagnostic Molecular MR Contrast Enhanced,
IRAP - Diagnostic CACS & CRP Biomarkers
LRAP - Government, Polymeal, Children
SHAPE & AEHA.
Orlando, March 05, 2005
ATHEROTHROMBOSIS: APPROACH IN 2005
Aggressive
Intervention3
Effective
Prevention1
Chronic Atherothrombosis
CHD Equivalents
HRAP- Subclinical
CT / MRI
Low
Risk
Modified from V Fuster, Circulation 1999; 99:1132
IRAP – Risk Frs
CACS / CRP
Acute Coronary Syndromes
Early
Detection 2
HRAP: High Risk Asymptomatic Patient - >2% y - >20% 10y
IRAP: Intermediate Risk Asymptomatic Patient – 0.5-2% y - 5-20% 10y
LOW RISK: FRS - < 0.5%y - < 5% 10 y
CHD RISK IN WOMEN - FRAMINGHAM SCORING (FRS) - 10 y
Age, y HDL cholesterol
< 35 -9 ≥ 60 -3
35-39 -4 50-59 0
40-44 0 45-49 1
45-49 3 35-44 2
50-54 6 < 35 5
55-59 7 Syst BP
60-64 8 < 120 -3
65-69 8 120-129 0
70-74 8 130-139 1
Cholesterol 140-149 2
< 160 -2 > 160 3
169-199 0 Diabetes
200-239 1 No 0
240-279 2 Yes 4
≥ 280 3 Smoking
No 0
Yes 2
Points
0
1
2
3
4
5
6
7
8
9
10
11
12
13
>14
Total CHD
(%)
2
3
4
5
7
8
10
13
16
20
25
31
37
45
> 53
Hard CHD
(%)
2
2
3
4
5
6
7
9
13
16
20
25
30
35
> 45
Grundy SM, Pasternak R, Greenland P, Smith S, Fuster V, Circ 1999; 100:1481
ATP III - Aggressive Rx: Framingham, Diabetes, Metab. Synd: obese, BP, HDL, TC, Gluc
- Physical inactivity JAMA 2001; 285:2475
Longitudinal View
Ca++
BAD (Fayad ZA, Mani V, Fuster V et al.) 2005
Multi Slice Black Blood Imaging
Rapid Extended Coverage (REX) Turbo Spin Echo Technique
Mid heart Aorta- 12 slices
Descriptive
StatisticsParameter No Mean St dev Min Max Range
Age 100 54.3 20.55 9 87 78
Framingham
Score
44 7.27 3.99 1 20 19
10-Year Risk 42 0.118 0.069 0.03 0.31 0.28
Total Chol 84 199.9 57.3 105 366 261
LDL 83 120.7 54.5 46 303 257
HDL 84 53.2 16.8 20 100 80
TGC 83 139.3 122.9 32 891 859
HbA1C 20 6.75 1.57 4.7 10.9 6.2
BMI 82 25.98 5.2 15.1 42.5 27.3
BSA (m2
) 80 1.89 0.30 1.13 2.85 1.72
BAD (Fayad ZA, Mani V, Fuster V et al.) 2005
Comparing Framingham Risk Factor Score and
Coronary Artery Disease (CAD)
0
2
4
6
8
10
12
14
NO YES
CAD
FraminghamScore
p = 0.447
BAD (Fayad ZA, Mani V, Fuster V et al.) 2005
Comparing Wall Area (mm2
) and
Coronary Artery Disease (CAD)
Wall Area Aorta - CAD
100
150
200
250
300
NO YES
CAD
WADA
p <
0.001
*
BAD (Fayad ZA, Mani V, Fuster V et al.) 2005
CAD (N=167) – STATIN vs NIACIN / STATIN
CIMT
-0.01
0
0.01
0.07
0.02
0.03
0.04
0.05
0.06
Placebo PlaceboER Niacin ER Niacin
No DM / MS DM / MS Present
ChangeinCIMT(mm±SEM)
ARBITER 2 (AJ Taylor et al.) Circ 2004; 110:3510
THE FREEDOM TRIAL
FUTURE REVASCULARIZATION EVALUATION
IN PATIENTS WITH DIABETES MELLITUS:
OPTIMAL MANAGEMENT OF MULTIVESSEL DISEASE
Risk Factor modification and Rx are critical.
1) BAD-MRI: Diabetics vs Non Diabetics
NHLBI 2005 (PI V Fuster)
THE EPIDEMIC OF CVD – NEED FOR NEW APPROACHES
Epidemiology and Change in Emphasis
- From the High Risk Plaque to the High Risk Symptomatic Patient
- From the High Risk Asymptomati to the Intermediate and Low Risk Patient
HRSP - Therapeutic Polypill & Single Pill
HRAP - BAD, Diagnostic MR Imaging
- BAD, Diagnostic & Rx - MR Plaque Composition
- BAD, Diagnostic Molecular MR Contrast Enhanced,
IRAP - Diagnostic CACS & CRP Biomarkers
LRAP - Government, Polymeal, Children
SHAPE & AEHA.
Orlando, March 05, 2005
0
10
20
30
40
50
60
70
80
90
100
MRI (1st) Histology
Percent
66.3 64
23.7
5.1 5
20.3
6.3 9.4
CAROTID PLAQUE COMPOSITION
(AS PERCENTAGE OF THE WALL)
Fibrous Tissue
Lipid Necrotic Core
Loose Matrix
Calcification
T Saam et al., ATVB 2005; 25:234 – In Vivo (Seattle, Wash)
M Shinnar et al., ATVB 1999; 19:2756 - Ex Vivo (New York)
MRI (no fat sat)
MRI (fat sat)
LAD
Lumen
LV
RV
RVOT
LAD WallX-ray angiogram
LAD
~6 mm max wall thickness
Fayad ZA et al.
Circ. 2000;102;506-510
Eccentric (“lipid-rich”)
MRI - Plaque Composition
Baseline 24 months follow up
R Corti, J J Wentzel, Z A Fayad, J J Badimon, V Fuster 2005 (Subm)
A ) MRI-LIPID LOWERING (SIMVASTATIN 20 or 80 mg/d)
AND REGRESSION OF ATHEROSCLEROSIS
R Corti, ZA Fayad, V Fuster, et al. Circ. 2001;104:249-252
R Corti, V Fuster, ZA Fayad, JJ Badimon et al. Circ 2002;106:2884
Independent of dose, LDL-C < 100 mg/dl had more regresion
Corti, J J Wentzel, Z A Fayad, J J Badimon, V Fuster 2005 (Subm)
R Corti, J J Wentzel, Z A Fayad, J J Badimon, V Fuster 2005 (Subm) PROVE IT
- TIMI 22 (C Cannon et al.), NEJM 2004; 350:15 - Clinical
Abdominal
Aorta
Thoracic
Aorta Baseline MRI Repeat MRI
after 12 months
treatment
3 contiguous slice
(no interslice gap
Lower corner
of Th9
Upper corner
of L4
Total vascular area
Lumen area
Maximal
vessel wall thickness
Minimal
vessel wall thickness
Yonemura A; Momiyama Y; Fayad ZA et al. JACC 2005;45:733-42
MRI - ATHEROSCLEROSIS AORTA – ATORVASTATIN (12mo,N=40)
-60
-
40
-20
0
20
40
60
80
ΔVWA
Thoracic Aorta Abdominal Aorta(%)
-60 -50 -40 -30 -20 -10 0
ΔLDL-C (%)
r=0.64
P<0.001
-60 -50 -40 -30 -20 -10 0
ΔLDL-C (%)
-60
-
40
-20
0
20
40
60
80
ΔVWA
(%)
r=0.34
P<0.005
5-mg dose
20-mg dose
Yonemura A; Momiyama Y; Fayad ZA et al. JACC 2005;45:733-42
MRI - ATHEROSCLEROSIS AORTA – ATORVASTATIN (12mo,N=40)
Baseline 12 months
A)
B)
LDL-C(mg/dl) VWA(mm
C)
D)
316
↓
195
-38%
161
↓
107
-34%
110
↓
79
-28%
224
↓
202
-10%
20 mg/day
5 mg/day
230
↓
180
-20%
212
↓
130
-39%
95
↓
109
+15%
119
↓
129
+9%
20 mg/day
5 mg/day
Yonemura A; Momiyama Y; Fayad ZA et al. JACC 2005;45:733-42
B) MRI - HDL-Cholesterol
Rabbit / IV HDL, Apo E / HDL, Rabbit / PPAR-y /
Fenofibrate
1
10
J.X. Rong et al. Circ 2001;104:2447
High-chol. Diet
Simv. + PPAR-y
Badimon JJ, Badimon L, Fuster V, JCI 1990; 85:1234, 1990
Rong JX et al Circ 2001;104:2447
PPARs in Atherosclerosis:
Castrillo A et. al. J Clin Invest. 2004;114:1538.
A C Li et al. J Clin Invest 2004;114:1564
PPAR signaling pathways influence
macrophage gene expression and
foam cell formation
T2WPDWT1W
ClusterRGB
l
nc
iph
fc
lf
df
pvf
l
nc
iph
fc
lf
df
pvf
l-lumen
nc-necrotic core
iph-intra plaque
hemorrhage
fc-fibrocellular
tissue
df-dense fibrous
tissue
lf=loose fibrous
tissue
pvf-perivascular
fat
Itskovich VV, Samber D, Mani V, et al Magn Reson Med 2004; 52: 515
In-Vivo Cluster Analysis for Plaque Characterization
THE FREEDOM TRIAL
FUTURE REVASCULARIZATION EVALUATION
IN PATIENTS WITH DIABETES MELLITUS:OPTIMAL
MANAGEMENT OF MULTIVESSEL DISEASE
2) MRI-Diabetics: Reversibility, Statins-PPAR
NHLBI 2005 (PI V Fuster)
THE EPIDEMIC OF CVD – NEED FOR NEW APPROACHES
Epidemiology and Change in Emphasis
- From the High Risk Plaque to the High Risk Symptomatic Patient
- From the High Risk Asymptomati to the Intermediate and Low Risk Patient
HRSP - Therapeutic Polypill & Single Pill
HRAP - BAD, Diagnostic MR Imaging
- BAD, Diagnostic & Rx - MR Plaque Composition
- BAD, Diagnostic Molecular MR Contrast Enhanced,
IRAP - Diagnostic CACS & CRP Biomarkers
LRAP - Government, Polymeal, Children
SHAPE & AEHA.
Orlando, March 05, 2005
Cell & Molecular MRI Targets
In Atherothrombotic Plaques
Lipinski MJ, Fuster V, Fisher EA, Fayad ZA, Nature Cardiov. Med. 2004;1:1
Targeted Contrast Agent - Approaches
Choudhury RP; Fuster V; Fayad ZA Nature Drug Disc. 2004;3:1
Lipid Rich Atherosclerotic Rabbit 24h
Post Gadofluorine
n=10 NZW
Atherosclerotic rabbits
No Enhancement in
Controls (n=6)
Pre Contrast
24 H Post
Gadofluorine
Sirol, M et. al. Circulation 2004; 109: 2890 – AHA 2004 -
Pre-contrast 48 hours post-contrast1 hr post-contrast 24 hr post-contrast
20x
lumen
wall
40x
Frias JC, Fayad ZA, Fuster V et al. ISMRM 2004
rHDL-Gd-DTPA-DMPE-NBD conjugate (green)
rHDL-Gd-DTPA-DMPE
apoE-KO mice, 4.36 mmol/kg, 9.4T MRM
In Vivo Detection of Macrophages
in Human Carotid Atheroma
Use of Post-Ultrasmall Superparamagnetic Particles of Iron (USPIO) MRI
Pre-USPIO
Post-USPIO
24h
Post-USPIO
36h
Areas of USPIO accumulation (Pearls staining, b)
colocalizing with
areas of high macrophage content (MAC 387 stain, c)
in the fibrous cap region
Trivedi AR et al. Stroke 2004; 35: 1631
Pre Contrast
Post Contrast
3 day old thrombus
Crush injured left
carotid artery
30 minutes
P.I.
60 minutes P.I.
Molecular Imaging of Fibrin with MR
Chronic Rabbit Model
Thrombus
in Left CCA
fibrin MRA
Fayad ZA
Imaging Science Laboratories
Control
H&E
Sirol M. et al. Circulation 2005 (In Press)
Diabetes and PAD - Proposed Sequence for an
Integrated Plaque (IP)-MRI Diagnostic Protocol
Combination of multi-weighted, post-Gadolinium and post-USPIO imaging
Dellegrottaglie S, Mani V, Fayad Z, Moreno P, Fuster V, Rajagopalan S. 2005
PDW MRI of the
Superficial femoral
artery
THE FREEDOM TRIAL
FUTURE REVASCULARIZATION EVALUATION
IN PATIENTS WITH DIABETES MELLITUS:
OPTIMAL MANAGEMENT OF MULTIVESSEL DISEASE
3) MRI - Contrast Enhanced PAD
NHLBI 2005 (PI V Fuster)
THE EPIDEMIC OF CVD – NEED FOR NEW APPROACHES
Epidemiology and Change in Emphasis
- From the High Risk Plaque to the High Risk Symptomatic Patient
- From the High Risk Asymptomati to the Intermediate and Low Risk Patient
HRSP - Therapeutic Polypill & Single Pill
HRAP - BAD, Diagnostic MR Imaging
- BAD, Diagnostic & Rx - MR Plaque Composition
- BAD, Diagnostic Molecular MR Contrast Enhanced,
IRAP - Diagnostic CACS & CRP Biomarkers
LRAP - Government, Polymeal, Children
SHAPE & AEHA.
Orlando, March 05, 2005
ATHEROTHROMBOSIS: APPROACH IN 2005
Aggressive
Intervention3
Effective
Prevention1
Chronic Atherothrombosis
CHD Equivalents
HRAP- Subclinical
CT / MRI
Low
Risk
Modified from V Fuster, Circulation 1999; 99:1132
IRAP- Risk Frs
CACS / CRP
Acute Coronary Syndromes
Early
Detection 2
HRAP: High Risk Asymptomatic Patient - >2% y - >20% 10y
IRAP: Intermediate Risk Asymptomatic Patient – 0.5-2% y - 5-20% 10y
LOW RISK: FRS - < 0.5%y - < 5% 10 y
CHD RISK IN WOMEN - FRAMINGHAM SCORING (FRS) - 10 y
Age, y HDL cholesterol
< 35 -9 ≥ 60 -3
35-39 -4 50-59 0
40-44 0 45-49 1
45-49 3 35-44 2
50-54 6 < 35 5
55-59 7 Syst BP
60-64 8 < 120 -3
65-69 8 120-129 0
70-74 8 130-139 1
Cholesterol 140-149 2
< 160 -2 > 160 3
169-199 0 Diabetes
200-239 1 No 0
240-279 2 Yes 4
≥ 280 3 Smoking
No 0
Yes 2
Points
0
1
2
3
4
5
6
7
8
9
10
11
12
13
>14
Total CHD
(%)
2
3
4
5
7
8
10
13
16
20
25
31
37
45
> 53
Hard CHD
(%)
2
2
3
4
5
6
7
9
13
16
20
25
30
35
> 45
Grundy SM, Pasternak R, Greenland P, Smith S, Fuster V, Circ 1999; 100:1481
ATP III - Aggressive Rx: Framingham, Diabetes, Metab. Synd: obese, BP, HDL, TC, Gluc
- Physical inactivity JAMA 2001; 285:2475
0 5 10 20 30 40
10
20
30
40
Initial Probability (%)
Posterior
Probability(%)
40% 25%35%
Identity Line
TRADITIONAL RISK PROBABILITY – IRAP & HRAP (FRS)
AND POSTERIOR NON-INVASIVE PROBABILITY
PWF Wilson et al., JACC 2003; 41:1898
NAHNES III (TA Jacobson et al.) Arch Int Med 2000; 160:1361
5
1) PREDICTED 7-YEAR EVENT RATES FOR CHD DEATH OR
NONFATAL MI FOR CATEGORIES OF FRS OR CACS
P Greenland et al., JAMA 2004; 291:210
0-9 10-15 16-20 ≥ 21
Framingham Risk Score, %
CoronaryDeathor
NonfatalMI,%
0
4
8
12
16
20
CACS
0
1-100
101-300
≥ 301
0.0
5.0
10.0
15.0
20.0
25.0
Framingham 10-Year CAD Risk (%)
0-1 2-4 5-9 >10
MultivariableRelativeRisk
<1.0 1.0-3.0 >3.0
High-Sensitivity C-Reactive Protein (mg/L)
2) RELATIVE RISK OF CV EVENT – FRS & CRP
WHS (PM Ridker et al.) NEJM 2002; 347:1557
THE EPIDEMIC OF CVD – NEED FOR NEW APPROACHES
Epidemiology and Change in Emphasis
- From the High Risk Plaque to the High Risk Symptomatic Patient
- From the High Risk Asymptomati to the Intermediate and Low Risk Patient
HRSP - Therapeutic Polypill & Single Pill
HRAP - BAD, Diagnostic MR Imaging
- BAD, Diagnostic & Rx - MR Plaque Composition
- BAD, Diagnostic Molecular MR Contrast Enhanced,
IRAP - Diagnostic CACS & CRP Biomarkers
LRAP - Government, Polymeal, Children
SHAPE & AEHA.
Orlando, March 05, 2005
ATHEROTHROMBOSIS: APPROACH IN 2005
Aggressive
Intervention3
Effective
Prevention1
Coronary Atherothrombosis
CHD Equivalents
HRAP- Subclinical
CT / MRI
Low
Risk
Modified from V Fuster, Circulation 1999; 99:1132
IRAP - Risk Frs.
CACS / CRP
Acute Coronary Syndromes
Early
Detection 2
HRAP: High Risk Asymptomatic Patient - >2% y - >20% 10y
IRAP: Intermediate Risk Asymptomatic Patient – 0.5-2% y - 5-20% 10y
LOW RISK: FRS - < 0.5%y - < 5% 10 y
1) RISK FACTORS FOR WHICH INTERVENTION
IS PROVEN TO LOWER RISK –
GOVERNMENT ?
Cessation1
↓ 10%2
DP ↓ 6 mmHg3
↓
Cigarette Smoking1
50% ↓ CHD ------ ------
Cholesterol2
------ 30% ↓ CHD ------
Hypertension3
------ ------ 16% ↓ CHD
42% ↓ Stroke
CH Hennekens, Circ 1998; 97:1095
2) EFFECT OF INGREDIENTS OF POLYMEAL
IN REDUCING RISK OF CVD
% Reduction (95% CI)
Ingredients in Risk of CVD Source
Wine (150 ml/d) 32 (23 to 41) DiCastelnuovo, 2002 (MA)
Fish (114 g x 4 w) 14 (8 to 19) Whelton, 2004 (MA)
Dark Chocolate (100 g/d) 21 (14 to 27) Taubert, 2003 (RCT)
Fruit/Vegetables (400 g/d) 21 (14 to 27) John, 2002 (RCT)
Garlic (2.7 g/d) 25 (21 to 27) Ackerman, 2001 (MA)
Almonds (68 g/d) 12.5 (10.5 to 13.5) Jenkins, Sabate. 2002,03 (RCT)
Combined Effect 76 (63 to 84)
MA = meta-analysis; RCT = randomized controlled trial
OH Franco et al., BMJ 2004; 329:1447
Polypill - NJ Wald et al., BMJ 2003; 326:1419
Statin, ASA, Folic Acid, BP (ACE-I, β-blocker, Thiazide) - % Reduction 85%
3) NIH Launches Study of 100,000 U.S. Kids 2.7 Billion
Kaiser, J Science 2004;306:1883.
Random sampling across the US to follow the health of children from birth to age 21.
THE EPIDEMIC OF CVD – NEED FOR NEW APPROACHES
Epidemiology and Change in Emphasis
- From the High Risk Plaque to the High Risk Symptomatic Patient
- From the High Risk Asymptomati to the Intermediate and Low Risk Patient
HRSP - Therapeutic Polypill & Single Pill
HRAP - BAD, Diagnostic MR Imaging
- BAD, Diagnostic & Rx - MR Plaque Composition
- BAD, Diagnostic Molecular MR Contrast Enhanced,
IRAP - Diagnostic CACS & CRP Biomarkers
LRAP - Preventive - Government, Polymeal, Children
SHAPE & AEHA. Innovative, Feasible (RF)?, Simple?, Preventive?, Polyauthor?
Orlando, March 05, 2005
2) C-Reactive Protein
Structure Affects Function
Dissociation from pentameric to monomeric form of CRP to exert
proatherosclerotic effects
Verma, S et. al. Circulation 2004;109:1914.
AngiographyCTA-MIP
1) CT- Calcified and Obstructive lesion LAD
Wyttenbach R……..Corti R. Circ 2004;110:1156
EFFECTs OF PTA & EVBT ON VASCULAR REMODELING
HUMAN FEMOROPOPLITEAL ARTERY - MRI
1) ROLE FOR GOVERNMENTS ON PREVENTION
TA Pearson et al., Circ 2003; 107:645
Diet
Sedentary
Lifestyle
Tobacco
Hyperlipidemia
Hypertension
Earlyrecognition
ofSymptomatic
Disease
Risk Factor/Risk Behavior
Community
Setting
Essential Public
Health Services
Policy/Legislation
Assuring Personal Health Services
Religious
Organizations
Organizational Partnerships
Education/media
Surveillance
Whole
communities
Schools
Worksites
Healthcare
Facilities
Descriptive Statistics: Image Parameters
Parameter Count Mean Stdev Min Max Range
Average Wall
AreaCarotids
(mm2
)
100 29.28 11.45 13.14 60.81 47.67
Normalized
Plaque Index
Carotid
100 4.98 1.89 2.19 14.56 12.37
Average Wall
Area Aorta
(mm2
)
100 144.78 62.41 36.43 309.91 273.47
Normalized
Plaque Index
Aorta
100 7.20 2.21 3.60 13.18 9.58
Max Wall
Thickness
Carotid (mm)
100 5.82 2.63 1.41 16.27 14.86
Max Wall
Thickness
Aorta (mm)
100 5.97 3.18 2.83 18.44 15.61
Contrast-Enhanced MRI for
Atherosclerotic Plaque Tissue Characterization
Yuan C, Kerwin S, Ferguson MS, et al.
Journal of Magnetic Resonance Imaging 2002; 15: 62
T1W PDW T2W
RGB
Fibrous cap
Lipid Core
Clustered
Itskovich VV, Samber D, Mani V, et al Magn Reson Med 2004; 52: 515
In-Vivo Cluster Analysis for Plaque Characterization
X
x
Patient Transport In-hospital Reperfusion
2004
2014
0 1 2 3 4
A B C D
Hours
Methods of Speeding Time to Reperfusion:
A B C D
Media Campaign 911 Expansion Regionalization PCI-Eluted Stents
Patient Education Pre-hosp. Rx MI protocol New devices / demand
3a) MI - TIME TO REPERFUSION – 2005, 2014
CORONARY CALCIUM AND CORONARY DISEASE EVENTS
Calcium Score Threshold
> 0 ≥ 100 ≥ 200 ≥ 600
Subjects above threshold (%) 64 19 12 4
Sensitivity (%) 91 71 54 26
Specificity (%) 36 82 89 96
Positive predictive value (%) 3.2 8.6 10.5 14.1
Negative predictive value (%) 99.5 99.2 98.8 98.2
Relative risk 5.9 10.7 8.9 8.0
(95% CI) (3.0-11.6) (7.1-16.3) (6.1-12.9) (5.3-12.1)
St. Francis Study (AD Guerci et al.) 2005 (Submitted)
Actin
Actin
Macrophages
Macrophages
MMP-1
MMP-1
Endothelin-1
Endothelin-1
Apoptosis
Apoptosis
TPinhibitorControl
The Selective TP Receptor Antagonist S18886 has
Anti-atherosclerotic and Plaque Stabilizing Effects
S18886 transforms lesions towards a more stable phenotype
Viles-Gonzalez JF, Fuster V, Corti R, Badimon JJ.Viles-Gonzalez JF, Fuster V, Corti R, Badimon JJ. EHJEHJ,, 20052005 (In Press(In Press
R Corti, J J Wentzel, Z A Fayad, J J Badimon, V Fuster 2005 (Subm)
18
FDG-PET CT PET/CT
Fluorodeoxygluose 18 PET / CT
Monocytes / Thrombus
Rudd JHF et al. Circ 2002;105:2708-2711
ICA
CT AND MR IMAGING OF MAIN COMPONENTS
OF ATHEROTHROMBOTIC PLAQUE
Modality CT MR
Unit HU SI*
Sequence 200† T1W PDW T2W TOF
Thrombus 20 +/- +/- +/- +
Lipid 50 + + - +/-
Fibrous 100 +/- + +/- +/-
Calcium > 300 - - - -
Z.A. Fayad, V.Fuster., Circ Res 2001;89:305
ZA Fayad, V Fuster, K Nikolaou, C Becker. Circ 2002;106:2026
RP Choudhury, V Fuster, JJ Badimon et al., ATVB 2002; 22:1065
† Vessel contrast enhancement - * Signal intensity (SI) relative to adjacent muscle
+ = hyperintense; +/- = isointense; - = hypointense
COMPARISON OF SOFT, INTERMEDIATE, AND CALCIFIED PLAQUES
BY MDCT (PLAQUE MAP) AND IVUS
S Komatsu et al., Circ J 2005; 69:72
IVUS
Soft Intermediate Calcified
MDCT-positive 144 134 84
MDCT-negative 12 19 10
Sensitivity (%) 92 87 89
0 5 10 15 20
0
1
0.1
0.8
0.4
0.6
Years
Survival
ST Depression
0 5 10 15 20
0
1
0.1
0.8
0.4
0.6
Years
Failure THR
0 5 10 15 20
0
1
0.1
0.8
0.4
0.6
Years
Low METs
Absent Present
SURVIVAL FREE OF CHD IN HIGH-RISK MEN
CJ Balady et al., Circ 2004; 110:1920 (Framingham)
CAD (N=167) – STATIN vs NIACIN / STATIN
CIMT
-0.01
0
0.01
0.07
0.02
0.03
0.04
0.05
0.06
Placebo PlaceboER Niacin ER Niacin
No DM / MS DM / MS Present
ChangeinCIMT(mm±SEM)
ARBITER 2 (AJ Taylor et al.) Circ 2004; 110:3510
CVMR-ISL
Zahi Fayad, PhD
Gilbert Aguinaldo, MD
Robin P Choudhury, MD
Vitalii Itskovich, PhD
Michael J Lipinski
Teresa Rius, MD
Frank Macalusso, RT
Karen Metroka, RT
Javier Sanz, MD
M.Sirol,MD
Cardiology
Valentin Fuster, MD, PhD
Juan Badimon, PhD
Michael Poon, MD
Stella Palentia, RN
Don Smith, MD
Meir Shinnar, MD, PhD
Pedro R Moreno MD
Pathology
John Fallon, MD, PhD
KR Purushothaman,MD
Molecular Biology
Yale Nemerson, MD
Mark Taubman, MD
Edward Fisher, MD, PhD
Ernane Reis, MD
K-R Purushothaman
Funding
NIH-HL 94013
NIH-HL 61801
NIH-HL 07208
BMS Inv. Award
Merck, GSK,
Schering AG
CV Research Fellows
Ursula Rauch MD
Roberto Corti, MD
Julio Osende, MD
Antonia Sambola, MD
Stephen Worthley, MD
Juan F Viles MD
Randolph Hutter MD
The Mount Sinai Medical Center
The Cardiovascular Institute
Radiology
Burton Drayer, MD
Jeff Goldman, MD
Neurology
Jessey Weinberger, MD
15
16
17
18
19
20
21
22
23
Baseline End of Follow-up
TREATMENT
CONTROL
Total Vessel Area (mm2
) Vessel Wall Area (mm2
)
The Selective TP Receptor Antagonist S18886 has
Anti-atherosclerotic and Plaque Stabilizing Effects
S18886 induces regression of advanced atherosclerotic plaques
Viles-Gonzalez JF, Fuster V, Corti R, Badimon JJ.Viles-Gonzalez JF, Fuster V, Corti R, Badimon JJ. European Heart JournalEuropean Heart Journal, 2005, 2005
The Selective TP Receptor Antagonist S18886 has
Anti-atherosclerotic and Plaque Stabilizing Effects
Viles-Gonzalez JF, Fuster V, Corti R, Badimon JJ.Viles-Gonzalez JF, Fuster V, Corti R, Badimon JJ. European Heart JournalEuropean Heart Journal, 2005, 2005
Detection of Occlusive thrombus in the Rabbit
Using Fibrin-Targeted MR Contrast Agent
Pre Contrast Post Contrast
T1-Weighted
sequence
2D BB FSE
Sirol M. et al. Circ 2004 (In Press) - AHA 2004
Chronic Thrombus Detection
Age Characterization Using Fibrin-Targeted MR Contrast
Agent
N=14 NZW Rabbits
Acute 1 Week 2 Weeks 4 Weeks 6 Weeks 8 WeeksNormal
Artery
Pre
Post
contrast
Sirol M. et al. Circ 2004 (In Press) - AHA 2004
Descriptive Statistics: Image Parameters
Parameter Count Mean Stdev Min Max Range
Average Wall
AreaCarotids
(mm2
)
100 29.28 11.45 13.14 60.81 47.67
Normalized
Plaque Index
Carotid
100 4.98 1.89 2.19 14.56 12.37
Average Wall
Area Aorta
(mm2
)
100 144.78 62.41 36.43 309.91 273.47
Normalized
Plaque Index
Aorta
100 7.20 2.21 3.60 13.18 9.58
Max Wall
Thickness
Carotid (mm)
100 5.82 2.63 1.41 16.27 14.86
Max Wall
Thickness
Aorta (mm)
100 5.97 3.18 2.83 18.44 15.61
In vivo MR evaluation of aortic
Atherosclerosis, risk factors and CAD at angiography
MRI slices of aorta and
plaque scores
Taniguchi H, ZA Fayad et. al. Am Heart J 2004;148:137 (Japan).
BAD (Fayad ZA, Mani V, Fuster V et al.) 2005
0
1
2
3
4
5
6
Baseline 6 months
PlaqueVolume(cm3
)
0
0.5
1
1.5
2
2.5
Baseline 6 months
PlaqueArea(cm2
)
0
2
4
6
8
10
12
Baseline 6 months
LumenVolume(cm3
)
0
1
2
3
4
5
6
Baseline 6 months
LumenArea(cm2
)
14
16
7
8
SIMVASTATIN –TE MRI
AORTIC PLAQUE VOLUME AORTIC LUMEN VOLUME
JAC Lima et al., Circ 2004; 110:2336
PREVENTING CARDIOVASCULAR DISEASE,
DIABETES AND CANCER
AHA, ADA, ACS – Circulation 2004;109:3244
Eat right - Mediterranean, serving size
Get active - >30min, >3days/week
Do not smoke - Advocacy, programs …
GENERAL PREVENTION GUIDELINES FOR CANCER, CVD AND
DIABETES IN ADULTS
20 30 40 50+AGETEST
BMI
Blood Pressure
Lipid Profile
Blood Glucose test
Clinical Breast Exam (CBE)
and Mammography
Pap test
Colorectal Screening
Prostate specific antigen
test and/digital rectal exam
Each regular health care visit
Each regular health care visit (or at least
once every 2 years if BP < 120/80 mm Hg)
Every 5 years
Every 3 years
CBE every 3 yrs
Yearly CBE and
Mammography
Yearly
Every 1-3 years; depends on
type of test and past results.
Frequency depends
on test preferred
Offer yearly, assist
informed decisions
ACS/ADA/AHA - Circ 2004; 109:3244
3) CARDIOVASCULAR HEALTH IN CHILDHOOD
CHALLENGES 20021
1
Multidisciplinary - Schools
2
Above 10 years and less demanding levels than in adults
AHA Statement (CL Williams et al.) Circ 2002; 106:143
1. Physical Activity Promotion methods
2. Obesity (< IR Type II Diabetes) Prevention methods
Nutrition
3. Hypertension Identification
4. Cholesterol Identification
Nutrition
Statins2
LDL > 190
LDL > 160 + FU
5. Cigarette Smoking Prevention methods
Lipid-Rich Atherosclerotic Plaques Detected by
Gadofluorine-Enhanced In Vivo Magnetic Resonance Imaging
Sirol, M et. al. Circulation 2004; 109: 2890.
In vivo T1W MR image of the rabbit abdominal aorta
24-hours post-gadofluorine injection
-1 0 1 2 3 4 5Years
Cardiovascular disease
Perinatal disease
Injuries
Cancer
Chronic obstructive
pulmonary disease
HIV infection or AIDS
Other causes
Coronary heart
disease
Stroke
Other heart
disease
U.S. LIFE EXPECTANCY 1970 & 2000 – SUCCESS OF RESEARCH ON THERAPIES
C Lenfant et al., NEJM 2003; 349:9
NCHS and AHA 2002 - Leading cause of death -
Ischemic stroke
Transient ischemic attack
Myocardial infarction
Angina pectoris (stable, unstable)
Sudden death
Critical limb ischemia, gangrene,
Systemic – Clinical Regions 2, 25-30%; 3, 5-10%
Atherothrombotic Disease (CAPRI & TASC)
Viles-Gonzalez J, Fuster V, Badimon JJ. EHJViles-Gonzalez J, Fuster V, Badimon JJ. EHJ 20042004; 25:1; 25:1
HIGH RISK PLAQUES - HRP
HIGH RISK BLOOD - HRB
BURDEN OF ATHEROTHROMBOSIS DISEASE - BAD
a) HRP / HRB / BAD - Systemic
b) HRP – Abundant
c) HRP AND HRB – Regionally Different
Maseri A, Fuster V, Circulation 2003; 107: 2068
Fuster V, Kim RJ, Circulation 2005 (In Press)
HIGH RISK PLAQUES - HRP
HIGH RISK BLOOD - HRB
BURDEN OF ATHEROTHROMBOSIS DISEASE - BAD
a) HRP / HRB / BAD - Systemic
b) HRP – Abundant
c) HRP AND HRB – Regionally Different
Maseri A, Fuster V, Circulation 2003; 107: 2068
Fuster V, Kim RJ, Circulation 2005 (In Press)
CAD (N=167) – STATIN vs NIACIN / STATIN
CIMT
-0.01
0
0.01
0.07
0.02
0.03
0.04
0.05
0.06
Placebo PlaceboER Niacin ER Niacin
No DM / MS DM / MS Present
ChangeinCIMT(mm±SEM)
ARBITER 2 (AJ Taylor et al.) Circ 2004; 110:3510
BAA 62 HU
DC
Despite the increasedDespite the increased spatial resolutionspatial resolution of the new generation ofof the new generation of
MDCTMDCT scanners,scanners, MRIMRI is better foris better for plaqueplaque characterization (Rabbitcharacterization (Rabbit
model)model)
Viles JF, Poon M, Sanz J, Rius T, Fuster V, Badimon JJ.Viles JF, Poon M, Sanz J, Rius T, Fuster V, Badimon JJ. Circ.Circ. 20042004
(In Press)(In Press)
CT Evaluation
Fuster V, Kim RJ, Circ 2005 (In Press)
C ) Selective TP Receptor Antagonist S18886 has
Anti-atherosclerotic and Plaque Stabilizing Effects
Baseline End of Treatment
Follow-up With Serial High Resolution Magnetic Resonance
Viles-Gonzalez JF, Fuster V, Corti R, Badimon JJ.Viles-Gonzalez JF, Fuster V, Corti R, Badimon JJ. EHJEHJ,, 20052005 (In(In
THE EPIDEMIC OF CVD – NEED FOR NEW APPROACHES
Epidemiology and Change in Emphasis
- From the High Risk Plaque to the High Risk Symptomatic Patient
- From the High Risk Asymptomati to the Intermediate and Low Risk Patient
HRSP - Therapeutic Polypill & Single Pill
HRAP - BAD, Diagnostic MR Imaging
- BAD, Diagnostic & Rx - MR Plaque Composition
- BAD, Diagnostic Molecular MR Contrast Enhanced,
IRAP - Diagnostic CACS & CRP Biomarkers
LRAP - Government, Polymeal, Children
SHAPE & AEHA. Within This Context
Orlando, March 05, 2005
FROM GENES TO HEALTH AND HEALTH TO GENES 1,2
TRAINING / MENTORS
Imaging: Non Inv. Molec.
Clinical Proteinomics
Inform. / Science / Techn.
Behav. Instrum./ Technol.
Clinical Trials Infrastr.
TRANSLATIONAL
GENES ⇔ CELL ⇔ TISSUE ⇔ PHYSIOL. ⇔ PHENOTYPE ⇔ POPUL. ⇔HEALTH
ENVIROMENT
Regenerative Biol./ Replac.Therapy.
.
Embryogenesis / Development
Immunobiol./ Inflammation / Thromb.
Public Health / Genom.Protein.
Health Promotion
1
NHLBI SPARK I 1998-2002
Circ 1999; 99:1132 & 2064 - Defined
Circ 2002;106:162 - Update
2
1
42
ClinicalTrials
ENABLING APPROACHES3
SPECIFIC AIMS

Acc 2005-1, v pl-vp

  • 1.
    THE EPIDEMIC OFCVD – NEED FOR NEW APPROACHES Epidemiology and Change in Emphasis - From the High Risk Plaque to the High Risk Symptomatic Patient - From the High Risk Asymptomati to the Intermediate and Low Risk Patient HRSP - Therapeutic Polypill & Single Pill HRAP - BAD, Diagnostic MR Imaging - BAD, Diagnostic & Rx - MR Plaque Composition - BAD, Diagnostic Molecular MR Contrast Enhanced, IRAP - Diagnostic CACS & CRP Biomarkers LRAP - Government, Polymeal, Children SHAPE & AEHA. Orlando, March 05, 2005
  • 2.
    0 5 10 15 20 25 30 1990 2020 MillionsofDeaths fromCardiovascularCauses Western countries Non-Western(developing) countries 5 9 6 19 DEATHS FROM CARDIOVASCULAR CAUSES, WORLDWIDE, IN 1990 AND ESTIMATED FOR 2020 KS Reddy. NEJM 2004; 350:2438
  • 3.
    Prevalence of Obesity& Diabetes in the U.S. 1990/19911990/1991 20002000 ejt 0901–120 Mokdad et al., JAMA 286:1195–1200, 2001Mokdad et al., JAMA 286:1195–1200, 2001 No DataNo Data < 4%< 4% 4%-6%4%-6% > 6%> 6% No DataNo Data < 10%< 10% 10%-14%10%-14% 15%-19%15%-19% ≥≥ 20%20% ObesityObesity DiabetesDiabetes
  • 4.
  • 5.
    THE EPIDEMIC OFCVD – NEED FOR NEW APPROACHES Epidemiology and Change in Emphasis - From the High Risk Plaque to the High Risk Symptomatic Patient - From the High Risk Asymptomati to the Intermediate and Low Risk Patient HRSP - Therapeutic Polypill & Single Pill HRAP - BAD, Diagnostic MR Imaging - BAD, Diagnostic & Rx - MR Plaque Composition - BAD, Diagnostic Molecular MR Contrast Enhanced, IRAP - Diagnostic CACS & CRP Biomarkers LRAP - Government, Polymeal, Children SHAPE & AEHA. Within This Context Orlando, March 05, 2005
  • 7.
    ATHEROTHROMBOSIS: APPROACH IN2005 Aggressive Intervention3 Effective Prevention1 2.Chronic Atherothrombosis 2. CAD Equivalents HRAP- Subclinical MRI / CT Low Risk Modified from V Fuster, Circulation 1999; 99:1132 IRAP – Risk Frs CACS / CRP 1.Acute Coronary Syndromes Early Detection 2 HRAP: High Risk Asymptomatic Patient - >2% y - >20% 10y IRAP: Intermediate Risk Asymptomatic Patient – 0.5-2% y - 5-20% 10y LOW RISK: FRS - < 0.5%y - < 5% 10 y
  • 8.
    METHODS TO ASSESSPLAQUE VULNERABILITY Intravascular ultrasound Three-dimensional reconstruction Ultrasound elastography Intravascular ultrasound flow measurements Virtual histology Angiography Direct visualization Optical coherence tomography RAMAN (near infrared) spectroscopy Thermography Computed tomography Contrast Ultrafast Magnetic Resonance Phase Contrast Nuclear Intravascular B Meier. Heart 2004; 90:1395
  • 9.
    HIGH RISK PLAQUES- HRP HIGH RISK BLOOD - HRB BURDEN OF ATHEROTHROMBOSIS DISEASE - BAD a) HRP / HRB / BAD - Systemic b) HRP – Abundant c) HRP AND HRB – Regionally Different Maseri A, Fuster V, Circulation 2003; 107: 2068 Fuster V, Kim RJ, Circulation 2005 (In Press)
  • 10.
    ACS (N=198) &SYSTEMIC ENDOTHELIAL DYSFUNCTION (FBF) – 5 DAYS 1 ADJUSTED RISK FACTORS, CV EVENTS (DEATH, MI, STROKE)- Av 4 YRS Fichtlscherer et al., Circ 2004; 110:1926 (Frankfurt) 70 80 90 100 0 365 730 1095 1460 1825 days of follow up Proportionofpatients withouCVevents(%) Logrank test p<0.03 Acetylcholine - dose - response 70 80 90 100 0 365 730 1095 1460 1825 days of follow up Proportionofpatients withouCVevents(%) Logrank test p<0.08 Sodium nitroprusside - dose - response ≥ 35.0 (1. quartile) < 34.9 (2. quartile) < 24.3 (3. quartile) < 15.6 (4. quartile) ≥ 31.6 (1. quartile) < 31.5 (2. quartile) < 18.7 (4. quartile) < 24.1 (3. quartile) 1 Improved response at 8 weeks adds to the prediction (ACH)
  • 11.
    CAD (ACS 54%)- CULPRIT VESSEL / LESION – N=843 NON-STENOTIC YELLOW PLAQUES / THROMBUS – N=1253 0 20 40 60 80 100 1 2 3 Color Grade of Plaque PrevalenceofThrombosis * † ‡ (%) *P=.0003 vs grade 1. †P<.0001 vs grade 1. ‡P<.0001 vs grade 2 Y Ueda et al., AHJ 2004; 148:842 (Osaka)
  • 12.
    CAROTID ACTIVE PLAQUES(ENDARTERECTOMY) CAP RUPTURE AND CAP EROSION BY STUDY GROUP ICTB (LG Spagnoli et al.) JAMA 2004; 292:1895 (Rome, Mineapolis, Mayo) C Yuan et al Circ 2002;105:181 (Seattle) – MRI – Several Plaques No. of Plaques (%) P Val Ipsilat. Stroke With TIA Asymptom. Stroke vs Stroke vs TIA vs (n=96) (n=91) (n=82) TIA Asympt. Asympt. Thromb. active % 74.0 35.2 14.6 <.001 <.001 .002 Cap rupture 66.7 23.1 13.4 <.001 <.001 .004 Cap erosion 7.3 12.1 1.2 .51 .09 .03
  • 14.
    THE EPIDEMIC OFCVD – NEED FOR NEW APPROACHES Epidemiology and Change in Emphasis - From the High Risk Plaque to the High Risk Symptomatic Patient - From the High Risk Asymptomatic to the Intermediate and Low Risk Patient HRSP - Therapeutic Polypill & Single Pill HRAP - BAD, Diagnostic MR Imaging - BAD, Diagnostic & Rx - MR Plaque Composition - BAD, Diagnostic Molecular MR Contrast Enhanced, IRAP - Diagnostic CACS & CRP Biomarkers LRAP - Government, Polymeal, Children SHAPE & AEHA. Orlando, March 05, 2005
  • 15.
    ATHEROTHROMBOSIS: APPROACH IN2005 Aggressive Intervention3 Effective Prevention1 Chronic Atherothrombosis CHD Equivalents HRAP- Subclinical CT / MRI Low Risk Modified from V Fuster, Circulation 1999; 99:1132 IRAP – Risk Frs CACS / CRP Acute Coronary Syndromes Early Detection 2 HRAP: High Risk Asymptomatic Patient - >2% y - >20% 10y IRAP: Intermediate Risk Asymptomatic Patient – 0.5-2% y - 5-20% 10y LOW RISK: FRS - < 0.5%y - < 5% 10 y
  • 16.
    THE EPIDEMIC OFCVD – NEED FOR NEW APPROACHES Epidemiology and Change in Emphasis - From the High Risk Plaque to the High Risk Symptomatic Patient - From the High Risk Asymptomati to the Intermediate and Low Risk Patient HRSP - Therapeutic Polypill & Single Pill HRAP - BAD, Diagnostic MR Imaging - BAD, Diagnostic & Rx - MR Plaque Composition - BAD, Diagnostic Molecular MR Contrast Enhanced, IRAP - Diagnostic CACS & CRP Biomarkers LRAP - Government, Polymeal, Children SHAPE & AEHA. Orlando, March 05, 2005
  • 17.
    ATHEROTHROMBOSIS: APPROACH IN2005 Aggressive Intervention3 Effective Prevention1 2.Chronic Atherothrombosis 2. CAD Equivalents HRAP- Subclinical MRI / CT Low Risk Modified from V Fuster, Circulation 1999; 99:1132 IRAP – Risk Frs CACS / CRP 1.Acute Coronary Syndromes Early Detection 2 HRAP: High Risk Asymptomatic Patient - >2% y - >20% 10y IRAP: Intermediate Risk Asymptomatic Patient – 0.5-2% y - 5-20% 10y LOW RISK: FRS - < 0.5%y - < 5% 10 y
  • 18.
    x Patient Transport In-hospitalReperfusion 2004 2014 0 1 2 3 A B C D Hours Methods of Speeding Time to Reperfusion: A B C D Media Campaign 911 Expansion Regionalization PCI-Eluted Stents Patient Education Pre-hosp. Rx MI protocol New devices / demand 1. MI - TIME TO REPERFUSION – 2005, 2015 X New antithrombotics, Myoc-Imaging., AICD, RF modification x X
  • 19.
    1. ACS –A PRE-HOSPITAL POLYPILL V Fuster 2005 Definite ACS with Possible ACS Definite ACS High risk/intervention Tx R Bl. Tx R Bl. Tx R Bl + + Clopidogrel - Like Clopidogrel - Like + + Oral Fr Xa Inhib Oral Fr Xa Inhib + + Statin Statin + Oral Antithrombin
  • 20.
    2. CAD EQUIVALENTS,CHRONIC ATHEROTHROMBOSIS AND A POLYPILL • ASA • CLOPIDOGREL • STATINS / LDL- C (HDL- C) • ACE INHIBITORS • BEHAVIOR MODIFICATION • INTERVENTION (PCI VS CABG): LIFE QUALITY VS QUANTITY CHALLENGES: COMPLIANCE, COSTS
  • 21.
    THE EPIDEMIC OFCVD – NEED FOR NEW APPROACHES Epidemiology and Change in Emphasis - From the High Risk Plaque to the High Risk Symptomatic Patient - From the High Risk Asymptomati to the Intermediate and Low Risk Patient HRSP - Therapeutic Polypill & Single Pill HRAP - BAD, Diagnostic MR Imaging - BAD, Diagnostic & Rx - MR Plaque Composition - BAD, Diagnostic Molecular MR Contrast Enhanced, IRAP - Diagnostic CACS & CRP Biomarkers LRAP - Government, Polymeal, Children SHAPE & AEHA. Orlando, March 05, 2005
  • 22.
    ATHEROTHROMBOSIS: APPROACH IN2005 Aggressive Intervention3 Effective Prevention1 Chronic Atherothrombosis CHD Equivalents HRAP- Subclinical CT / MRI Low Risk Modified from V Fuster, Circulation 1999; 99:1132 IRAP – Risk Frs CACS / CRP Acute Coronary Syndromes Early Detection 2 HRAP: High Risk Asymptomatic Patient - >2% y - >20% 10y IRAP: Intermediate Risk Asymptomatic Patient – 0.5-2% y - 5-20% 10y LOW RISK: FRS - < 0.5%y - < 5% 10 y
  • 23.
    CHD RISK INWOMEN - FRAMINGHAM SCORING (FRS) - 10 y Age, y HDL cholesterol < 35 -9 ≥ 60 -3 35-39 -4 50-59 0 40-44 0 45-49 1 45-49 3 35-44 2 50-54 6 < 35 5 55-59 7 Syst BP 60-64 8 < 120 -3 65-69 8 120-129 0 70-74 8 130-139 1 Cholesterol 140-149 2 < 160 -2 > 160 3 169-199 0 Diabetes 200-239 1 No 0 240-279 2 Yes 4 ≥ 280 3 Smoking No 0 Yes 2 Points 0 1 2 3 4 5 6 7 8 9 10 11 12 13 >14 Total CHD (%) 2 3 4 5 7 8 10 13 16 20 25 31 37 45 > 53 Hard CHD (%) 2 2 3 4 5 6 7 9 13 16 20 25 30 35 > 45 Grundy SM, Pasternak R, Greenland P, Smith S, Fuster V, Circ 1999; 100:1481 ATP III - Aggressive Rx: Framingham, Diabetes, Metab. Synd: obese, BP, HDL, TC, Gluc - Physical inactivity JAMA 2001; 285:2475
  • 24.
    Longitudinal View Ca++ BAD (FayadZA, Mani V, Fuster V et al.) 2005 Multi Slice Black Blood Imaging Rapid Extended Coverage (REX) Turbo Spin Echo Technique Mid heart Aorta- 12 slices
  • 25.
    Descriptive StatisticsParameter No MeanSt dev Min Max Range Age 100 54.3 20.55 9 87 78 Framingham Score 44 7.27 3.99 1 20 19 10-Year Risk 42 0.118 0.069 0.03 0.31 0.28 Total Chol 84 199.9 57.3 105 366 261 LDL 83 120.7 54.5 46 303 257 HDL 84 53.2 16.8 20 100 80 TGC 83 139.3 122.9 32 891 859 HbA1C 20 6.75 1.57 4.7 10.9 6.2 BMI 82 25.98 5.2 15.1 42.5 27.3 BSA (m2 ) 80 1.89 0.30 1.13 2.85 1.72 BAD (Fayad ZA, Mani V, Fuster V et al.) 2005
  • 26.
    Comparing Framingham RiskFactor Score and Coronary Artery Disease (CAD) 0 2 4 6 8 10 12 14 NO YES CAD FraminghamScore p = 0.447 BAD (Fayad ZA, Mani V, Fuster V et al.) 2005
  • 27.
    Comparing Wall Area(mm2 ) and Coronary Artery Disease (CAD) Wall Area Aorta - CAD 100 150 200 250 300 NO YES CAD WADA p < 0.001 * BAD (Fayad ZA, Mani V, Fuster V et al.) 2005
  • 28.
    CAD (N=167) –STATIN vs NIACIN / STATIN CIMT -0.01 0 0.01 0.07 0.02 0.03 0.04 0.05 0.06 Placebo PlaceboER Niacin ER Niacin No DM / MS DM / MS Present ChangeinCIMT(mm±SEM) ARBITER 2 (AJ Taylor et al.) Circ 2004; 110:3510
  • 29.
    THE FREEDOM TRIAL FUTUREREVASCULARIZATION EVALUATION IN PATIENTS WITH DIABETES MELLITUS: OPTIMAL MANAGEMENT OF MULTIVESSEL DISEASE Risk Factor modification and Rx are critical. 1) BAD-MRI: Diabetics vs Non Diabetics NHLBI 2005 (PI V Fuster)
  • 30.
    THE EPIDEMIC OFCVD – NEED FOR NEW APPROACHES Epidemiology and Change in Emphasis - From the High Risk Plaque to the High Risk Symptomatic Patient - From the High Risk Asymptomati to the Intermediate and Low Risk Patient HRSP - Therapeutic Polypill & Single Pill HRAP - BAD, Diagnostic MR Imaging - BAD, Diagnostic & Rx - MR Plaque Composition - BAD, Diagnostic Molecular MR Contrast Enhanced, IRAP - Diagnostic CACS & CRP Biomarkers LRAP - Government, Polymeal, Children SHAPE & AEHA. Orlando, March 05, 2005
  • 31.
    0 10 20 30 40 50 60 70 80 90 100 MRI (1st) Histology Percent 66.364 23.7 5.1 5 20.3 6.3 9.4 CAROTID PLAQUE COMPOSITION (AS PERCENTAGE OF THE WALL) Fibrous Tissue Lipid Necrotic Core Loose Matrix Calcification T Saam et al., ATVB 2005; 25:234 – In Vivo (Seattle, Wash) M Shinnar et al., ATVB 1999; 19:2756 - Ex Vivo (New York)
  • 32.
    MRI (no fatsat) MRI (fat sat) LAD Lumen LV RV RVOT LAD WallX-ray angiogram LAD ~6 mm max wall thickness Fayad ZA et al. Circ. 2000;102;506-510 Eccentric (“lipid-rich”) MRI - Plaque Composition
  • 33.
    Baseline 24 monthsfollow up R Corti, J J Wentzel, Z A Fayad, J J Badimon, V Fuster 2005 (Subm) A ) MRI-LIPID LOWERING (SIMVASTATIN 20 or 80 mg/d) AND REGRESSION OF ATHEROSCLEROSIS R Corti, ZA Fayad, V Fuster, et al. Circ. 2001;104:249-252 R Corti, V Fuster, ZA Fayad, JJ Badimon et al. Circ 2002;106:2884
  • 34.
    Independent of dose,LDL-C < 100 mg/dl had more regresion Corti, J J Wentzel, Z A Fayad, J J Badimon, V Fuster 2005 (Subm)
  • 35.
    R Corti, JJ Wentzel, Z A Fayad, J J Badimon, V Fuster 2005 (Subm) PROVE IT - TIMI 22 (C Cannon et al.), NEJM 2004; 350:15 - Clinical
  • 36.
    Abdominal Aorta Thoracic Aorta Baseline MRIRepeat MRI after 12 months treatment 3 contiguous slice (no interslice gap Lower corner of Th9 Upper corner of L4 Total vascular area Lumen area Maximal vessel wall thickness Minimal vessel wall thickness Yonemura A; Momiyama Y; Fayad ZA et al. JACC 2005;45:733-42 MRI - ATHEROSCLEROSIS AORTA – ATORVASTATIN (12mo,N=40)
  • 37.
    -60 - 40 -20 0 20 40 60 80 ΔVWA Thoracic Aorta AbdominalAorta(%) -60 -50 -40 -30 -20 -10 0 ΔLDL-C (%) r=0.64 P<0.001 -60 -50 -40 -30 -20 -10 0 ΔLDL-C (%) -60 - 40 -20 0 20 40 60 80 ΔVWA (%) r=0.34 P<0.005 5-mg dose 20-mg dose Yonemura A; Momiyama Y; Fayad ZA et al. JACC 2005;45:733-42 MRI - ATHEROSCLEROSIS AORTA – ATORVASTATIN (12mo,N=40)
  • 38.
    Baseline 12 months A) B) LDL-C(mg/dl)VWA(mm C) D) 316 ↓ 195 -38% 161 ↓ 107 -34% 110 ↓ 79 -28% 224 ↓ 202 -10% 20 mg/day 5 mg/day 230 ↓ 180 -20% 212 ↓ 130 -39% 95 ↓ 109 +15% 119 ↓ 129 +9% 20 mg/day 5 mg/day Yonemura A; Momiyama Y; Fayad ZA et al. JACC 2005;45:733-42
  • 39.
    B) MRI -HDL-Cholesterol Rabbit / IV HDL, Apo E / HDL, Rabbit / PPAR-y / Fenofibrate 1 10 J.X. Rong et al. Circ 2001;104:2447 High-chol. Diet Simv. + PPAR-y Badimon JJ, Badimon L, Fuster V, JCI 1990; 85:1234, 1990 Rong JX et al Circ 2001;104:2447
  • 40.
    PPARs in Atherosclerosis: CastrilloA et. al. J Clin Invest. 2004;114:1538. A C Li et al. J Clin Invest 2004;114:1564 PPAR signaling pathways influence macrophage gene expression and foam cell formation
  • 41.
    T2WPDWT1W ClusterRGB l nc iph fc lf df pvf l nc iph fc lf df pvf l-lumen nc-necrotic core iph-intra plaque hemorrhage fc-fibrocellular tissue df-densefibrous tissue lf=loose fibrous tissue pvf-perivascular fat Itskovich VV, Samber D, Mani V, et al Magn Reson Med 2004; 52: 515 In-Vivo Cluster Analysis for Plaque Characterization
  • 42.
    THE FREEDOM TRIAL FUTUREREVASCULARIZATION EVALUATION IN PATIENTS WITH DIABETES MELLITUS:OPTIMAL MANAGEMENT OF MULTIVESSEL DISEASE 2) MRI-Diabetics: Reversibility, Statins-PPAR NHLBI 2005 (PI V Fuster)
  • 43.
    THE EPIDEMIC OFCVD – NEED FOR NEW APPROACHES Epidemiology and Change in Emphasis - From the High Risk Plaque to the High Risk Symptomatic Patient - From the High Risk Asymptomati to the Intermediate and Low Risk Patient HRSP - Therapeutic Polypill & Single Pill HRAP - BAD, Diagnostic MR Imaging - BAD, Diagnostic & Rx - MR Plaque Composition - BAD, Diagnostic Molecular MR Contrast Enhanced, IRAP - Diagnostic CACS & CRP Biomarkers LRAP - Government, Polymeal, Children SHAPE & AEHA. Orlando, March 05, 2005
  • 44.
    Cell & MolecularMRI Targets In Atherothrombotic Plaques Lipinski MJ, Fuster V, Fisher EA, Fayad ZA, Nature Cardiov. Med. 2004;1:1
  • 45.
    Targeted Contrast Agent- Approaches Choudhury RP; Fuster V; Fayad ZA Nature Drug Disc. 2004;3:1
  • 46.
    Lipid Rich AtheroscleroticRabbit 24h Post Gadofluorine n=10 NZW Atherosclerotic rabbits No Enhancement in Controls (n=6) Pre Contrast 24 H Post Gadofluorine Sirol, M et. al. Circulation 2004; 109: 2890 – AHA 2004 -
  • 47.
    Pre-contrast 48 hourspost-contrast1 hr post-contrast 24 hr post-contrast 20x lumen wall 40x Frias JC, Fayad ZA, Fuster V et al. ISMRM 2004 rHDL-Gd-DTPA-DMPE-NBD conjugate (green) rHDL-Gd-DTPA-DMPE apoE-KO mice, 4.36 mmol/kg, 9.4T MRM
  • 48.
    In Vivo Detectionof Macrophages in Human Carotid Atheroma Use of Post-Ultrasmall Superparamagnetic Particles of Iron (USPIO) MRI Pre-USPIO Post-USPIO 24h Post-USPIO 36h Areas of USPIO accumulation (Pearls staining, b) colocalizing with areas of high macrophage content (MAC 387 stain, c) in the fibrous cap region Trivedi AR et al. Stroke 2004; 35: 1631
  • 49.
    Pre Contrast Post Contrast 3day old thrombus Crush injured left carotid artery 30 minutes P.I. 60 minutes P.I. Molecular Imaging of Fibrin with MR Chronic Rabbit Model Thrombus in Left CCA fibrin MRA Fayad ZA Imaging Science Laboratories Control H&E Sirol M. et al. Circulation 2005 (In Press)
  • 50.
    Diabetes and PAD- Proposed Sequence for an Integrated Plaque (IP)-MRI Diagnostic Protocol Combination of multi-weighted, post-Gadolinium and post-USPIO imaging Dellegrottaglie S, Mani V, Fayad Z, Moreno P, Fuster V, Rajagopalan S. 2005 PDW MRI of the Superficial femoral artery
  • 51.
    THE FREEDOM TRIAL FUTUREREVASCULARIZATION EVALUATION IN PATIENTS WITH DIABETES MELLITUS: OPTIMAL MANAGEMENT OF MULTIVESSEL DISEASE 3) MRI - Contrast Enhanced PAD NHLBI 2005 (PI V Fuster)
  • 52.
    THE EPIDEMIC OFCVD – NEED FOR NEW APPROACHES Epidemiology and Change in Emphasis - From the High Risk Plaque to the High Risk Symptomatic Patient - From the High Risk Asymptomati to the Intermediate and Low Risk Patient HRSP - Therapeutic Polypill & Single Pill HRAP - BAD, Diagnostic MR Imaging - BAD, Diagnostic & Rx - MR Plaque Composition - BAD, Diagnostic Molecular MR Contrast Enhanced, IRAP - Diagnostic CACS & CRP Biomarkers LRAP - Government, Polymeal, Children SHAPE & AEHA. Orlando, March 05, 2005
  • 53.
    ATHEROTHROMBOSIS: APPROACH IN2005 Aggressive Intervention3 Effective Prevention1 Chronic Atherothrombosis CHD Equivalents HRAP- Subclinical CT / MRI Low Risk Modified from V Fuster, Circulation 1999; 99:1132 IRAP- Risk Frs CACS / CRP Acute Coronary Syndromes Early Detection 2 HRAP: High Risk Asymptomatic Patient - >2% y - >20% 10y IRAP: Intermediate Risk Asymptomatic Patient – 0.5-2% y - 5-20% 10y LOW RISK: FRS - < 0.5%y - < 5% 10 y
  • 54.
    CHD RISK INWOMEN - FRAMINGHAM SCORING (FRS) - 10 y Age, y HDL cholesterol < 35 -9 ≥ 60 -3 35-39 -4 50-59 0 40-44 0 45-49 1 45-49 3 35-44 2 50-54 6 < 35 5 55-59 7 Syst BP 60-64 8 < 120 -3 65-69 8 120-129 0 70-74 8 130-139 1 Cholesterol 140-149 2 < 160 -2 > 160 3 169-199 0 Diabetes 200-239 1 No 0 240-279 2 Yes 4 ≥ 280 3 Smoking No 0 Yes 2 Points 0 1 2 3 4 5 6 7 8 9 10 11 12 13 >14 Total CHD (%) 2 3 4 5 7 8 10 13 16 20 25 31 37 45 > 53 Hard CHD (%) 2 2 3 4 5 6 7 9 13 16 20 25 30 35 > 45 Grundy SM, Pasternak R, Greenland P, Smith S, Fuster V, Circ 1999; 100:1481 ATP III - Aggressive Rx: Framingham, Diabetes, Metab. Synd: obese, BP, HDL, TC, Gluc - Physical inactivity JAMA 2001; 285:2475
  • 55.
    0 5 1020 30 40 10 20 30 40 Initial Probability (%) Posterior Probability(%) 40% 25%35% Identity Line TRADITIONAL RISK PROBABILITY – IRAP & HRAP (FRS) AND POSTERIOR NON-INVASIVE PROBABILITY PWF Wilson et al., JACC 2003; 41:1898 NAHNES III (TA Jacobson et al.) Arch Int Med 2000; 160:1361 5
  • 56.
    1) PREDICTED 7-YEAREVENT RATES FOR CHD DEATH OR NONFATAL MI FOR CATEGORIES OF FRS OR CACS P Greenland et al., JAMA 2004; 291:210 0-9 10-15 16-20 ≥ 21 Framingham Risk Score, % CoronaryDeathor NonfatalMI,% 0 4 8 12 16 20 CACS 0 1-100 101-300 ≥ 301
  • 57.
    0.0 5.0 10.0 15.0 20.0 25.0 Framingham 10-Year CADRisk (%) 0-1 2-4 5-9 >10 MultivariableRelativeRisk <1.0 1.0-3.0 >3.0 High-Sensitivity C-Reactive Protein (mg/L) 2) RELATIVE RISK OF CV EVENT – FRS & CRP WHS (PM Ridker et al.) NEJM 2002; 347:1557
  • 58.
    THE EPIDEMIC OFCVD – NEED FOR NEW APPROACHES Epidemiology and Change in Emphasis - From the High Risk Plaque to the High Risk Symptomatic Patient - From the High Risk Asymptomati to the Intermediate and Low Risk Patient HRSP - Therapeutic Polypill & Single Pill HRAP - BAD, Diagnostic MR Imaging - BAD, Diagnostic & Rx - MR Plaque Composition - BAD, Diagnostic Molecular MR Contrast Enhanced, IRAP - Diagnostic CACS & CRP Biomarkers LRAP - Government, Polymeal, Children SHAPE & AEHA. Orlando, March 05, 2005
  • 59.
    ATHEROTHROMBOSIS: APPROACH IN2005 Aggressive Intervention3 Effective Prevention1 Coronary Atherothrombosis CHD Equivalents HRAP- Subclinical CT / MRI Low Risk Modified from V Fuster, Circulation 1999; 99:1132 IRAP - Risk Frs. CACS / CRP Acute Coronary Syndromes Early Detection 2 HRAP: High Risk Asymptomatic Patient - >2% y - >20% 10y IRAP: Intermediate Risk Asymptomatic Patient – 0.5-2% y - 5-20% 10y LOW RISK: FRS - < 0.5%y - < 5% 10 y
  • 60.
    1) RISK FACTORSFOR WHICH INTERVENTION IS PROVEN TO LOWER RISK – GOVERNMENT ? Cessation1 ↓ 10%2 DP ↓ 6 mmHg3 ↓ Cigarette Smoking1 50% ↓ CHD ------ ------ Cholesterol2 ------ 30% ↓ CHD ------ Hypertension3 ------ ------ 16% ↓ CHD 42% ↓ Stroke CH Hennekens, Circ 1998; 97:1095
  • 61.
    2) EFFECT OFINGREDIENTS OF POLYMEAL IN REDUCING RISK OF CVD % Reduction (95% CI) Ingredients in Risk of CVD Source Wine (150 ml/d) 32 (23 to 41) DiCastelnuovo, 2002 (MA) Fish (114 g x 4 w) 14 (8 to 19) Whelton, 2004 (MA) Dark Chocolate (100 g/d) 21 (14 to 27) Taubert, 2003 (RCT) Fruit/Vegetables (400 g/d) 21 (14 to 27) John, 2002 (RCT) Garlic (2.7 g/d) 25 (21 to 27) Ackerman, 2001 (MA) Almonds (68 g/d) 12.5 (10.5 to 13.5) Jenkins, Sabate. 2002,03 (RCT) Combined Effect 76 (63 to 84) MA = meta-analysis; RCT = randomized controlled trial OH Franco et al., BMJ 2004; 329:1447 Polypill - NJ Wald et al., BMJ 2003; 326:1419 Statin, ASA, Folic Acid, BP (ACE-I, β-blocker, Thiazide) - % Reduction 85%
  • 62.
    3) NIH LaunchesStudy of 100,000 U.S. Kids 2.7 Billion Kaiser, J Science 2004;306:1883. Random sampling across the US to follow the health of children from birth to age 21.
  • 63.
    THE EPIDEMIC OFCVD – NEED FOR NEW APPROACHES Epidemiology and Change in Emphasis - From the High Risk Plaque to the High Risk Symptomatic Patient - From the High Risk Asymptomati to the Intermediate and Low Risk Patient HRSP - Therapeutic Polypill & Single Pill HRAP - BAD, Diagnostic MR Imaging - BAD, Diagnostic & Rx - MR Plaque Composition - BAD, Diagnostic Molecular MR Contrast Enhanced, IRAP - Diagnostic CACS & CRP Biomarkers LRAP - Preventive - Government, Polymeal, Children SHAPE & AEHA. Innovative, Feasible (RF)?, Simple?, Preventive?, Polyauthor? Orlando, March 05, 2005
  • 71.
    2) C-Reactive Protein StructureAffects Function Dissociation from pentameric to monomeric form of CRP to exert proatherosclerotic effects Verma, S et. al. Circulation 2004;109:1914.
  • 72.
    AngiographyCTA-MIP 1) CT- Calcifiedand Obstructive lesion LAD
  • 73.
    Wyttenbach R……..Corti R.Circ 2004;110:1156 EFFECTs OF PTA & EVBT ON VASCULAR REMODELING HUMAN FEMOROPOPLITEAL ARTERY - MRI
  • 74.
    1) ROLE FORGOVERNMENTS ON PREVENTION TA Pearson et al., Circ 2003; 107:645 Diet Sedentary Lifestyle Tobacco Hyperlipidemia Hypertension Earlyrecognition ofSymptomatic Disease Risk Factor/Risk Behavior Community Setting Essential Public Health Services Policy/Legislation Assuring Personal Health Services Religious Organizations Organizational Partnerships Education/media Surveillance Whole communities Schools Worksites Healthcare Facilities
  • 75.
    Descriptive Statistics: ImageParameters Parameter Count Mean Stdev Min Max Range Average Wall AreaCarotids (mm2 ) 100 29.28 11.45 13.14 60.81 47.67 Normalized Plaque Index Carotid 100 4.98 1.89 2.19 14.56 12.37 Average Wall Area Aorta (mm2 ) 100 144.78 62.41 36.43 309.91 273.47 Normalized Plaque Index Aorta 100 7.20 2.21 3.60 13.18 9.58 Max Wall Thickness Carotid (mm) 100 5.82 2.63 1.41 16.27 14.86 Max Wall Thickness Aorta (mm) 100 5.97 3.18 2.83 18.44 15.61
  • 76.
    Contrast-Enhanced MRI for AtheroscleroticPlaque Tissue Characterization Yuan C, Kerwin S, Ferguson MS, et al. Journal of Magnetic Resonance Imaging 2002; 15: 62
  • 77.
    T1W PDW T2W RGB Fibrouscap Lipid Core Clustered Itskovich VV, Samber D, Mani V, et al Magn Reson Med 2004; 52: 515 In-Vivo Cluster Analysis for Plaque Characterization
  • 78.
    X x Patient Transport In-hospitalReperfusion 2004 2014 0 1 2 3 4 A B C D Hours Methods of Speeding Time to Reperfusion: A B C D Media Campaign 911 Expansion Regionalization PCI-Eluted Stents Patient Education Pre-hosp. Rx MI protocol New devices / demand 3a) MI - TIME TO REPERFUSION – 2005, 2014
  • 79.
    CORONARY CALCIUM ANDCORONARY DISEASE EVENTS Calcium Score Threshold > 0 ≥ 100 ≥ 200 ≥ 600 Subjects above threshold (%) 64 19 12 4 Sensitivity (%) 91 71 54 26 Specificity (%) 36 82 89 96 Positive predictive value (%) 3.2 8.6 10.5 14.1 Negative predictive value (%) 99.5 99.2 98.8 98.2 Relative risk 5.9 10.7 8.9 8.0 (95% CI) (3.0-11.6) (7.1-16.3) (6.1-12.9) (5.3-12.1) St. Francis Study (AD Guerci et al.) 2005 (Submitted)
  • 80.
    Actin Actin Macrophages Macrophages MMP-1 MMP-1 Endothelin-1 Endothelin-1 Apoptosis Apoptosis TPinhibitorControl The Selective TPReceptor Antagonist S18886 has Anti-atherosclerotic and Plaque Stabilizing Effects S18886 transforms lesions towards a more stable phenotype Viles-Gonzalez JF, Fuster V, Corti R, Badimon JJ.Viles-Gonzalez JF, Fuster V, Corti R, Badimon JJ. EHJEHJ,, 20052005 (In Press(In Press
  • 81.
    R Corti, JJ Wentzel, Z A Fayad, J J Badimon, V Fuster 2005 (Subm)
  • 82.
    18 FDG-PET CT PET/CT Fluorodeoxygluose18 PET / CT Monocytes / Thrombus Rudd JHF et al. Circ 2002;105:2708-2711 ICA
  • 83.
    CT AND MRIMAGING OF MAIN COMPONENTS OF ATHEROTHROMBOTIC PLAQUE Modality CT MR Unit HU SI* Sequence 200† T1W PDW T2W TOF Thrombus 20 +/- +/- +/- + Lipid 50 + + - +/- Fibrous 100 +/- + +/- +/- Calcium > 300 - - - - Z.A. Fayad, V.Fuster., Circ Res 2001;89:305 ZA Fayad, V Fuster, K Nikolaou, C Becker. Circ 2002;106:2026 RP Choudhury, V Fuster, JJ Badimon et al., ATVB 2002; 22:1065 † Vessel contrast enhancement - * Signal intensity (SI) relative to adjacent muscle + = hyperintense; +/- = isointense; - = hypointense
  • 84.
    COMPARISON OF SOFT,INTERMEDIATE, AND CALCIFIED PLAQUES BY MDCT (PLAQUE MAP) AND IVUS S Komatsu et al., Circ J 2005; 69:72 IVUS Soft Intermediate Calcified MDCT-positive 144 134 84 MDCT-negative 12 19 10 Sensitivity (%) 92 87 89
  • 85.
    0 5 1015 20 0 1 0.1 0.8 0.4 0.6 Years Survival ST Depression 0 5 10 15 20 0 1 0.1 0.8 0.4 0.6 Years Failure THR 0 5 10 15 20 0 1 0.1 0.8 0.4 0.6 Years Low METs Absent Present SURVIVAL FREE OF CHD IN HIGH-RISK MEN CJ Balady et al., Circ 2004; 110:1920 (Framingham)
  • 86.
    CAD (N=167) –STATIN vs NIACIN / STATIN CIMT -0.01 0 0.01 0.07 0.02 0.03 0.04 0.05 0.06 Placebo PlaceboER Niacin ER Niacin No DM / MS DM / MS Present ChangeinCIMT(mm±SEM) ARBITER 2 (AJ Taylor et al.) Circ 2004; 110:3510
  • 87.
    CVMR-ISL Zahi Fayad, PhD GilbertAguinaldo, MD Robin P Choudhury, MD Vitalii Itskovich, PhD Michael J Lipinski Teresa Rius, MD Frank Macalusso, RT Karen Metroka, RT Javier Sanz, MD M.Sirol,MD Cardiology Valentin Fuster, MD, PhD Juan Badimon, PhD Michael Poon, MD Stella Palentia, RN Don Smith, MD Meir Shinnar, MD, PhD Pedro R Moreno MD Pathology John Fallon, MD, PhD KR Purushothaman,MD Molecular Biology Yale Nemerson, MD Mark Taubman, MD Edward Fisher, MD, PhD Ernane Reis, MD K-R Purushothaman Funding NIH-HL 94013 NIH-HL 61801 NIH-HL 07208 BMS Inv. Award Merck, GSK, Schering AG CV Research Fellows Ursula Rauch MD Roberto Corti, MD Julio Osende, MD Antonia Sambola, MD Stephen Worthley, MD Juan F Viles MD Randolph Hutter MD The Mount Sinai Medical Center The Cardiovascular Institute Radiology Burton Drayer, MD Jeff Goldman, MD Neurology Jessey Weinberger, MD
  • 88.
    15 16 17 18 19 20 21 22 23 Baseline End ofFollow-up TREATMENT CONTROL Total Vessel Area (mm2 ) Vessel Wall Area (mm2 ) The Selective TP Receptor Antagonist S18886 has Anti-atherosclerotic and Plaque Stabilizing Effects S18886 induces regression of advanced atherosclerotic plaques Viles-Gonzalez JF, Fuster V, Corti R, Badimon JJ.Viles-Gonzalez JF, Fuster V, Corti R, Badimon JJ. European Heart JournalEuropean Heart Journal, 2005, 2005
  • 89.
    The Selective TPReceptor Antagonist S18886 has Anti-atherosclerotic and Plaque Stabilizing Effects Viles-Gonzalez JF, Fuster V, Corti R, Badimon JJ.Viles-Gonzalez JF, Fuster V, Corti R, Badimon JJ. European Heart JournalEuropean Heart Journal, 2005, 2005
  • 90.
    Detection of Occlusivethrombus in the Rabbit Using Fibrin-Targeted MR Contrast Agent Pre Contrast Post Contrast T1-Weighted sequence 2D BB FSE Sirol M. et al. Circ 2004 (In Press) - AHA 2004
  • 91.
    Chronic Thrombus Detection AgeCharacterization Using Fibrin-Targeted MR Contrast Agent N=14 NZW Rabbits Acute 1 Week 2 Weeks 4 Weeks 6 Weeks 8 WeeksNormal Artery Pre Post contrast Sirol M. et al. Circ 2004 (In Press) - AHA 2004
  • 92.
    Descriptive Statistics: ImageParameters Parameter Count Mean Stdev Min Max Range Average Wall AreaCarotids (mm2 ) 100 29.28 11.45 13.14 60.81 47.67 Normalized Plaque Index Carotid 100 4.98 1.89 2.19 14.56 12.37 Average Wall Area Aorta (mm2 ) 100 144.78 62.41 36.43 309.91 273.47 Normalized Plaque Index Aorta 100 7.20 2.21 3.60 13.18 9.58 Max Wall Thickness Carotid (mm) 100 5.82 2.63 1.41 16.27 14.86 Max Wall Thickness Aorta (mm) 100 5.97 3.18 2.83 18.44 15.61
  • 93.
    In vivo MRevaluation of aortic Atherosclerosis, risk factors and CAD at angiography MRI slices of aorta and plaque scores Taniguchi H, ZA Fayad et. al. Am Heart J 2004;148:137 (Japan). BAD (Fayad ZA, Mani V, Fuster V et al.) 2005
  • 94.
    0 1 2 3 4 5 6 Baseline 6 months PlaqueVolume(cm3 ) 0 0.5 1 1.5 2 2.5 Baseline6 months PlaqueArea(cm2 ) 0 2 4 6 8 10 12 Baseline 6 months LumenVolume(cm3 ) 0 1 2 3 4 5 6 Baseline 6 months LumenArea(cm2 ) 14 16 7 8 SIMVASTATIN –TE MRI AORTIC PLAQUE VOLUME AORTIC LUMEN VOLUME JAC Lima et al., Circ 2004; 110:2336
  • 95.
    PREVENTING CARDIOVASCULAR DISEASE, DIABETESAND CANCER AHA, ADA, ACS – Circulation 2004;109:3244 Eat right - Mediterranean, serving size Get active - >30min, >3days/week Do not smoke - Advocacy, programs …
  • 96.
    GENERAL PREVENTION GUIDELINESFOR CANCER, CVD AND DIABETES IN ADULTS 20 30 40 50+AGETEST BMI Blood Pressure Lipid Profile Blood Glucose test Clinical Breast Exam (CBE) and Mammography Pap test Colorectal Screening Prostate specific antigen test and/digital rectal exam Each regular health care visit Each regular health care visit (or at least once every 2 years if BP < 120/80 mm Hg) Every 5 years Every 3 years CBE every 3 yrs Yearly CBE and Mammography Yearly Every 1-3 years; depends on type of test and past results. Frequency depends on test preferred Offer yearly, assist informed decisions ACS/ADA/AHA - Circ 2004; 109:3244
  • 97.
    3) CARDIOVASCULAR HEALTHIN CHILDHOOD CHALLENGES 20021 1 Multidisciplinary - Schools 2 Above 10 years and less demanding levels than in adults AHA Statement (CL Williams et al.) Circ 2002; 106:143 1. Physical Activity Promotion methods 2. Obesity (< IR Type II Diabetes) Prevention methods Nutrition 3. Hypertension Identification 4. Cholesterol Identification Nutrition Statins2 LDL > 190 LDL > 160 + FU 5. Cigarette Smoking Prevention methods
  • 98.
    Lipid-Rich Atherosclerotic PlaquesDetected by Gadofluorine-Enhanced In Vivo Magnetic Resonance Imaging Sirol, M et. al. Circulation 2004; 109: 2890. In vivo T1W MR image of the rabbit abdominal aorta 24-hours post-gadofluorine injection
  • 99.
    -1 0 12 3 4 5Years Cardiovascular disease Perinatal disease Injuries Cancer Chronic obstructive pulmonary disease HIV infection or AIDS Other causes Coronary heart disease Stroke Other heart disease U.S. LIFE EXPECTANCY 1970 & 2000 – SUCCESS OF RESEARCH ON THERAPIES C Lenfant et al., NEJM 2003; 349:9 NCHS and AHA 2002 - Leading cause of death -
  • 100.
    Ischemic stroke Transient ischemicattack Myocardial infarction Angina pectoris (stable, unstable) Sudden death Critical limb ischemia, gangrene, Systemic – Clinical Regions 2, 25-30%; 3, 5-10% Atherothrombotic Disease (CAPRI & TASC) Viles-Gonzalez J, Fuster V, Badimon JJ. EHJViles-Gonzalez J, Fuster V, Badimon JJ. EHJ 20042004; 25:1; 25:1
  • 101.
    HIGH RISK PLAQUES- HRP HIGH RISK BLOOD - HRB BURDEN OF ATHEROTHROMBOSIS DISEASE - BAD a) HRP / HRB / BAD - Systemic b) HRP – Abundant c) HRP AND HRB – Regionally Different Maseri A, Fuster V, Circulation 2003; 107: 2068 Fuster V, Kim RJ, Circulation 2005 (In Press)
  • 102.
    HIGH RISK PLAQUES- HRP HIGH RISK BLOOD - HRB BURDEN OF ATHEROTHROMBOSIS DISEASE - BAD a) HRP / HRB / BAD - Systemic b) HRP – Abundant c) HRP AND HRB – Regionally Different Maseri A, Fuster V, Circulation 2003; 107: 2068 Fuster V, Kim RJ, Circulation 2005 (In Press)
  • 103.
    CAD (N=167) –STATIN vs NIACIN / STATIN CIMT -0.01 0 0.01 0.07 0.02 0.03 0.04 0.05 0.06 Placebo PlaceboER Niacin ER Niacin No DM / MS DM / MS Present ChangeinCIMT(mm±SEM) ARBITER 2 (AJ Taylor et al.) Circ 2004; 110:3510
  • 104.
    BAA 62 HU DC Despitethe increasedDespite the increased spatial resolutionspatial resolution of the new generation ofof the new generation of MDCTMDCT scanners,scanners, MRIMRI is better foris better for plaqueplaque characterization (Rabbitcharacterization (Rabbit model)model) Viles JF, Poon M, Sanz J, Rius T, Fuster V, Badimon JJ.Viles JF, Poon M, Sanz J, Rius T, Fuster V, Badimon JJ. Circ.Circ. 20042004 (In Press)(In Press)
  • 105.
    CT Evaluation Fuster V,Kim RJ, Circ 2005 (In Press)
  • 106.
    C ) SelectiveTP Receptor Antagonist S18886 has Anti-atherosclerotic and Plaque Stabilizing Effects Baseline End of Treatment Follow-up With Serial High Resolution Magnetic Resonance Viles-Gonzalez JF, Fuster V, Corti R, Badimon JJ.Viles-Gonzalez JF, Fuster V, Corti R, Badimon JJ. EHJEHJ,, 20052005 (In(In
  • 107.
    THE EPIDEMIC OFCVD – NEED FOR NEW APPROACHES Epidemiology and Change in Emphasis - From the High Risk Plaque to the High Risk Symptomatic Patient - From the High Risk Asymptomati to the Intermediate and Low Risk Patient HRSP - Therapeutic Polypill & Single Pill HRAP - BAD, Diagnostic MR Imaging - BAD, Diagnostic & Rx - MR Plaque Composition - BAD, Diagnostic Molecular MR Contrast Enhanced, IRAP - Diagnostic CACS & CRP Biomarkers LRAP - Government, Polymeal, Children SHAPE & AEHA. Within This Context Orlando, March 05, 2005
  • 108.
    FROM GENES TOHEALTH AND HEALTH TO GENES 1,2 TRAINING / MENTORS Imaging: Non Inv. Molec. Clinical Proteinomics Inform. / Science / Techn. Behav. Instrum./ Technol. Clinical Trials Infrastr. TRANSLATIONAL GENES ⇔ CELL ⇔ TISSUE ⇔ PHYSIOL. ⇔ PHENOTYPE ⇔ POPUL. ⇔HEALTH ENVIROMENT Regenerative Biol./ Replac.Therapy. . Embryogenesis / Development Immunobiol./ Inflammation / Thromb. Public Health / Genom.Protein. Health Promotion 1 NHLBI SPARK I 1998-2002 Circ 1999; 99:1132 & 2064 - Defined Circ 2002;106:162 - Update 2 1 42 ClinicalTrials ENABLING APPROACHES3 SPECIFIC AIMS

Editor's Notes

  • #25 DLMP
  • #33 .
  • #49 Post-USPIO MRI can be used to identify macrophages accumulation within the plaque in vivo
  • #77 Pre- and post-contrast (Omniscan) enhanced images show regional variation in contrast enhancement A region of strong enhancement adjacent to the lumen (arrow 1) indicates neovasculature Also indicated are a necrotic core with minor enhancement (arrow 2) and an enhancing region of neovasculature near the outer wall (arrow 3) The presence of neovessels was confirmed in the correpsonding histological slice
  • #101 Vascular disease is the result of a generalized process that affects multiple vascular beds, including the cerebral, coronary, and peripheral arteries. Coexistence of vascular disease in multiple beds increases the risk for developing ischemic events such as MI and stroke.[1] Vascular disease in cerebral arteries may precipitate a transient ischemic attack (TIA) or an ischemic stroke. A TIA, by definition, lasts for fewer than 24 hours, but the majority clear within 1 hour. A TIA may be a warning of an impending stroke, with the risk for a stroke being 4% to 8% during the first month following a TIA and 24% to 29% during the next 5 years.[2] Vascular disease in coronary arteries produces a spectrum of ischemic coronary syndromes that include stable angina, unstable angina, non–ST-segment elevation myocardial infarction (NSTEMI; also known as non–Q-wave MI), and ST-segment elevation (STEMI; also known as Q-wave MI). Cardiovascular disease is the single largest cause of death in the United States.[3] Vascular disease in peripheral vessels, peripheral arterial disease (PAD), produces a variety of symptoms ranging from intermittent claudication to pain at rest.[4] Patients with the most serious PAD have critical limb ischemia that produces pain at rest and threatens the viability of the limb by increasing the risk for gangrene and necrosis.[4] PAD is a strong marker for cardiovascular disease. Over a 10-year period, PAD increases risk for death due to cardiovascular disease approximately 6-fold.[5] Note: Plavix® (clopidogrel) is not indicated for all the conditions listed on this slide.