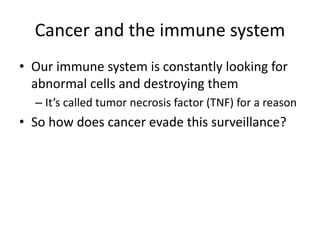
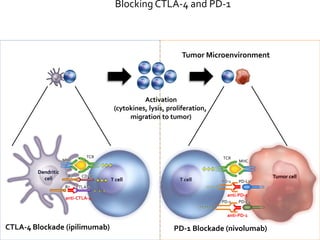
Immunotherapy 101
Claire Friedman
10/8/15
Let’s take a step back…
• To basic immunology!
• T cells
– Two main subsets: CD4+ (helper) and CD8+ (effector)
– CD4+ cells can be broken down further into Th1, Th2
and Treg
– Th1 : proinflammatory, stimulated by IFN-ɣ, support
anti-viral and anti-tumor responses.
– Th2: anti-inflammatory, associated with secretion of
IL-10. Favor anti-parasitic responses.
– T reg: Inhibit and dampen immune response
T cells
• Cytotoxic T cells
– Upon activation can proliferate and directly kill
infected or cancerous cells
– Activation requires two signals: One from an APC,
one from a costimulatory molecule such as CD28
• Helper T cells
– Facilitate a coordinated immune response
– Can differentiate down a number of pathways
based on the cytokine milieu
Antigen Presenting Cells
• Cells that display foreign antigens complexed
with MHCs
• Examples: Dendritic cells, macrophages, some
B-cells
• Can interact with T cells via the T cell receptor
and direct the pathway of the T cell
Cancer and the immune system
• Our immune system is constantly looking for
abnormal cells and destroying them
– It’s called tumor necrosis factor (TNF) for a reason
• So how does cancer evade this surveillance?
Tumor Intrinsic Factors
• Antigen Loss or MHC loss
• Secretion of immunosuppressive cytokines
• Expression of cell-surface markers such as
programmed death ligand 1 (PD-L1) that alter
T cell function
• Like the invisibility cloak from Harry Potter
Tumor Extrinsic Factors
• Geographic barriers
• Suppressive or regulatory immune cells
– Tregs
– Myeloid derived suppressor cells (MDSCs)
– Tumor-associated macrophages (TAMs)
So, where do we go from here?
• How can we train our immune systems to
overcome both types of resistance?
Driving the T cell
T cells have both a gas pedal and a brake pedal (otherwise
known as activating receptors and inhibitor receptors)
(Mellman I., Coukos G., and Dranoff G. Nature.2011;480(7378):480-9)
Ipilimumab AugmentsT-Cell Activation and Proliferation
Adapted from O’Day et al. Plenary session presentation, abstract #4, ASCO 2010.
T-cell
APC
TCR
HLA CD80/
CD86
T-cell
inhibition
CTLA-4
CD28
T-cell
APC
TCR
HLA
T-cell
activation
CD28TCR
HLA
T-cell
APC
CD80/
CD86
T-cell
remains active
Ipilimumab
blocks
CTLA-4
T-cell
APC
CTLA-4
CD80/
CD86
TCR
HLA
Immune-RelatedAdverse Events
• Rash (approx 20%)
• Colitis/enteritis (approx 15%)
• Elevated AST/ALT (approx 10%)
• Endocrinopathies: Thyroiditis, Hypophysitis, Adrenal
insufficiency(2-5%)
Severity is inversely related to vigilance of surveillance.
If detected early, most are easily treated and reversible.
Ipilimumab Pattern of Response:
Responses After the Appearance and Subsequent Disappearance of
New Lesions
3 mg/kg
ipilimumab
Q3W X 4
Pre-treatment
Week 36: Still Regressing
Week 12: Progression
Week 20: Regression
New lesions
Source: 2008 ASCO
Abstract #3020 Wolchok.
July 2006
irRC Identifies Survivors in Patients with Progressive Disease
by mWHO
Pooled data from phase II studies CA184-008 and CA184-022:
ipilimumab monotherapy 10 mg/kg (N=227)
Wolchok et al, Clin Cancer Res, 2009
Patients at Risk
Ipilimumab 4846 1786 612 392 200 170 120 26 15 5 0
0.0
0.1
0.2
0.3
0.4
0.5
0.6
0.7
0.8
0.9
1.0
0 12 24 36 48 60 72 84 96 108 120
Ipilimumab
CENSORED
Ipilimumab LongTerm Pooled Survival Analysis:
4846 Patients
Median OS (95% CI): 9.5 (9.0–10.0)
3-year OS Rate (95% CI): 21% (20–22%)
ProportionAlive
Months
Schadendorf, Hodi Wolchok, ESMO, 2013
MHC
PD-L1
PD-1 PD-1
PD-1 PD-1
Nivolumab, Pembrolizumab:
PD-1 Receptor Blocking Abs
Recognition of tumor by T cell through
MHC/antigen interaction mediates IFNγ release
and PD-L1/2 up-regulation on tumor
Priming and activation of T cells through
MHC/antigen & CD28/B7 interactions with
antigen-presenting cells
T-cell
receptor
T-cell
receptor
PD-L1
PD-L2
PD-L2
MHC
CD28 B7
T cell
NFκB
Other
PI3K
Dendritic
cellTumor cell
IFNγ
IFNγR
Shp-2
Shp-2
Role of PD-1 Pathway inTumor Immunity
18
Sznol et al., ASCO, 2013
Tumor Burden in Patients with Melanoma Receiving Nivolumab
19
Vertical line at 96 weeks = maximum duration of continuous nivolumab therapy
Horizontal line at −30% = threshold for defining objective response (partial tumor regression) in absence of new lesions or non-target disease
according to RECIST
Unconventional response = response patterns that did not meet RECIST criteria (e.g., persistent reduction in target lesions in the presence of new
lesions, or regression following initial progression)
All Mel patients treated with 3 mg/kg nivolumab 4 Mel patients treated with unconventional responses
from nivolumab
1st occurrence
of new lesion
3 mg/kg
Weeks since treatment initiation
Changeintargetlesionsfrombaseline(%)
1st occurrence
of new lesion
Weeks since treatment initiation
Changeintargetlesionsfrombaseline(%)
1 mg/kg
1 mg/kg1 mg/kg
10 mg/kg
Sznol et al., ASCO, 2013
Georgina V. Long, Victoria Atkinson, Paolo A. Ascierto, Benjamin Brady,
Caroline Dutriaux, Michele Maio, Laurent Mortier, Jessica C. Hassel, Piotr Rutkowski,
Catriona McNeil, Ewa Kalinka-Warzocha, Kerry J. Savage, Micaela Hernberg,
Celeste Lebbé, Julie Charles, Catalin Mihalcioiu, Vanna Chiarion-Sileni, Cornelia Mauch,
Henrik Schmidt, Dirk Schadendorf, Helen Gogas, Christine Horak, Brian Sharkey,
Ian Waxman, Caroline Robert
Nivolumab Improved Survival
vs Dacarbazine in Patients with
Untreated Advanced Melanoma
Phase 3 CA209-066: Study Design
*Patients may be treated beyond initial RECIST v1.1-defined progression if considered by the investigator to be experiencing
clinical benefit and tolerating study drug
Treat until
progression* or
unacceptable
toxicity
Primary endpoint:
• OS
Secondary endpoints:
• PFS
• ORR
• PD-L1 correlates
R
1:1
Nivolumab
3 mg/kg IV Q2W
+
Placebo
IV Q3W
N=210
(206 treated)
Placebo
IV Q2W
+
Dacarbazine
1000 mg/m2 IV Q3W
N=208
(205 treated)
Double-
blind
Eligible patients with
unresectable stage III
or IV melanoma
(N=418)
• BRAF wild-type
• Treatment-naïve
Stratified by:
• PD-L1 status
(≥ 5% cell-surface
staining cutoff)
• M-stage
Best Overall Response
Nivolumab
(N = 210)
Dacarbazine
(N = 208)
ORR, % (95% CI) 40% (33–47%) 14% (10–19%)
Best overall response
Complete response 8% 1%
Partial response 32% 13%
Stable disease 17% 22%
Progressive disease 33% 49%
Unable to determine 11% 15%
Based on 5 August 2014 database lock.
0 3 6 9 12 15 18
Primary Endpoint: Overall Survival
Patients who died,
n/N
Median OS
mo (95% CI)
Nivolumab 50/210 NR
Dacarbazine 96/208 10.8 (9.3–12.1)
NR = not reached.
Based on 5 August 2014 database lock.
100
90
80
70
60
0
50
40
30
20
10
HR 0.42 (99.79% CI, 0.25–0.73; P < 0.0001)
(Boundary for statistical significance 0.0021)
210
208
185
177
150
123
105
82
45
22
8
3
0
0
Nivolumab (N = 210)
Dacarbazine (N = 208)
Months
PatientsSurviving(%)
1-yr OS 73%
1-yr OS 42%
Patients at Risk
Nivolumab
Dacarbazine
Follow-up since randomization: 5.2–16.7 months.
Improved OS irrespective of PD-L1 status
OS by PD-L1 Status*
100
90
80
70
60
0
50
40
30
20
10
0 3 6 9 12 15 18
Months
Nivolumab PD-L1+
Dacarbazine PD-L1+
Nivolumab PD-L1-
Dacarbazine PD-L1-
Patients at Risk
Dacarbazine PD-L1-
Nivolumab PD-L1-
Dacarbazine PD-L1+
Nivolumab PD-L1+
74
128
74
126
69
108
64
107
56
88
44
78
39
63
30
52
18
26
11
11
1
7
1
2
0
0
0
0
PatientsSurviving(%)
1-Yr OS
% (95% CI)
82.1 (69.6–89.8)
67.8 (58.3–75.7)
52.7 (37.7–65.7)
37.4 (26.4–48.3)
Patients
who died,
n/N
Median OS
mo (95% CI)
Nivolumab PD-L1+ 11/74 NR
Nivolumab PD-L1- 37/128 NR
Dacarbazine PD-L1+ 29/74 12.4 (9.2–NR)
Dacarbazine PD-L1- 64/126 10.2 (7.6–11.8)
*PD-L1 positive: ≥ 5% tumor cell surface staining. PD-L1 negative: < 5% tumor cell surface staining. NR=not reached.
Based on 5 August 2014 database lock.
KEYNOTE-006 (NCT01866319):
International, Randomized, Phase III Study
Patients
• Unresectable, stage III or IV
melanoma
• ≤1 prior therapy, excluding anti–
CTLA-4, PD-1, or PD-L1 agents
• Known BRAF statusa
• ECOG PS 0-1
• No active brain metastases
• No serious autoimmune disease
Pembrolizumab
10 mg/kg IV Q2W
Pembrolizumab
10 mg/kg IV Q3W
R
1:1:1
Stratification factors:
• ECOG PS (0 vs 1)
• Line of therapy (first vs second)
• PD-L1 status (positiveb vs negative)
Ipilimumab
3 mg/kg IV Q3W
x 4 doses
aPrior anti-BRAF targeted therapy was not required for patients with normal LDH levels and no clinically significant tumor-related symptoms or evidence of rapidly
progressing disease.
bDefined as membranous PD-L1 expression in ≥1% of tumor cells as assessed by IHC using the 22C3 antibody.
• Primary end points: PFS and OS
• Secondary end points: ORR, duration of
response, safety
0 2 4 6 8 10 12 14
0
10
20
30
40
50
60
70
80
90
100
Time, months
Progression-FreeSurvival,%
No. at risk
279 231 147 98 49 7 2 0
277 235 133 95 53 7 1 1
278 186 88 42 18 2 0 0
PFS at Interim Analysis 1 (IA1)
Analysis cut-off date: September 3, 2014.
Median
(95% CI), mo
Rate at
6 mo
HR
(95% CI) P
5.5 (3.4-6.9) 47.3% 0.58
(0.46-0.72)
<0.00001
4.1 (2.9-6.9) 46.4% 0.58
(0.47-0.72)
<0.00001
2.8 (2.8-2.9) 26.5% — —
Pembrolizumab Q2W
Pembrolizumab Q3W
Ipilimumab
0 2 4 6 8 10 12 14 16 18
30
40
50
60
70
80
90
100
Time, months
OverallSurvival,%
No. at risk
279 266 248 233 219 212 177 67
277 266 251 238 215 202 158 71
278 242 212 188 169 157 117 51
19
18
17
0
0
0
OS at the Second Interim Analysis (IA2)
Analysis cut-off date: March 3, 2015.
Treatment Arm
Median
(95% CI), mo
Rate at
12 mo
HR
(95% CI) P
Pembrolizumab
Q2W
NR (NR-NR) 74.1% 0.63
(0.47-0.83)
0.00052
Pembrolizumab
Q3W
NR (NR-NR) 68.4% 0.69
(0.52-0.90)
0.00358
Ipilimumab NR (12.7-NR) 58.2% — —
What about other malignancies
besides melanoma?
Ansell SM et al. N Engl J Med 2015;372:311-319.
Response Characteristics and Changes in Tumor Burden in Patients with Hodgkin's
Lymphoma Receiving Nivolumab.
Brahmer J et al. N Engl J Med 2015;373:123-135.
Efficacy of Nivolumab versus Docetaxel in Patients with Advanced Squamous-Cell Non–
Small-Cell Lung Cancer.
Motzer RJ et al. N Engl J Med 2015. DOI: 10.1056/NEJMoa1510665
Nivolumab vs Everolimus for the treatment of metastatic RCC
Blocking CTLA-4 and PD-1
T cell
Tumor cell
MHC
TCR
PD-L1PD-1
- - -
T cell
Dendritic
cell
MHC
TCR
CD28
B7 CTLA-4
- - -
Activation
(cytokines, lysis, proliferation,
migration to tumor)
B7
+++
+++
CTLA-4 Blockade (ipilimumab) PD-1 Blockade (nivolumab)
anti-CTLA-4
anti-PD-1
Tumor Microenvironment
+++
PD-L2PD-1
anti-PD-1
- - -
Larkin J et al. N Engl J Med 2015;373:23-34.
Nivolumab vs ipilimumab vs combination therapy in patients with metastatic
melanoma: progression-free survival.
Larkin J et al. N Engl J Med 2015;373:23-34.
Tumor-Burden Change in Target Lesions.
Where do we go from here?
• Combination immunotherapy in other disease
areas (AML, CLL, head and neck)
• Other checkpoint antibodies (LAG3, GITR,
OX40) alone and in combination with PD-1
• Checkpoint inhibitors in combination with
therapeutic vaccines (Ty-Vec with anti-PD-1)
Questions?

Immunotherapy 101

  • 1.
  • 2.
    Let’s take astep back… • To basic immunology! • T cells – Two main subsets: CD4+ (helper) and CD8+ (effector) – CD4+ cells can be broken down further into Th1, Th2 and Treg – Th1 : proinflammatory, stimulated by IFN-ɣ, support anti-viral and anti-tumor responses. – Th2: anti-inflammatory, associated with secretion of IL-10. Favor anti-parasitic responses. – T reg: Inhibit and dampen immune response
  • 3.
    T cells • CytotoxicT cells – Upon activation can proliferate and directly kill infected or cancerous cells – Activation requires two signals: One from an APC, one from a costimulatory molecule such as CD28 • Helper T cells – Facilitate a coordinated immune response – Can differentiate down a number of pathways based on the cytokine milieu
  • 4.
    Antigen Presenting Cells •Cells that display foreign antigens complexed with MHCs • Examples: Dendritic cells, macrophages, some B-cells • Can interact with T cells via the T cell receptor and direct the pathway of the T cell
  • 6.
    Cancer and theimmune system • Our immune system is constantly looking for abnormal cells and destroying them – It’s called tumor necrosis factor (TNF) for a reason • So how does cancer evade this surveillance?
  • 9.
    Tumor Intrinsic Factors •Antigen Loss or MHC loss • Secretion of immunosuppressive cytokines • Expression of cell-surface markers such as programmed death ligand 1 (PD-L1) that alter T cell function • Like the invisibility cloak from Harry Potter
  • 10.
    Tumor Extrinsic Factors •Geographic barriers • Suppressive or regulatory immune cells – Tregs – Myeloid derived suppressor cells (MDSCs) – Tumor-associated macrophages (TAMs)
  • 11.
    So, where dowe go from here? • How can we train our immune systems to overcome both types of resistance?
  • 12.
    Driving the Tcell T cells have both a gas pedal and a brake pedal (otherwise known as activating receptors and inhibitor receptors) (Mellman I., Coukos G., and Dranoff G. Nature.2011;480(7378):480-9)
  • 13.
    Ipilimumab AugmentsT-Cell Activationand Proliferation Adapted from O’Day et al. Plenary session presentation, abstract #4, ASCO 2010. T-cell APC TCR HLA CD80/ CD86 T-cell inhibition CTLA-4 CD28 T-cell APC TCR HLA T-cell activation CD28TCR HLA T-cell APC CD80/ CD86 T-cell remains active Ipilimumab blocks CTLA-4 T-cell APC CTLA-4 CD80/ CD86 TCR HLA
  • 14.
    Immune-RelatedAdverse Events • Rash(approx 20%) • Colitis/enteritis (approx 15%) • Elevated AST/ALT (approx 10%) • Endocrinopathies: Thyroiditis, Hypophysitis, Adrenal insufficiency(2-5%) Severity is inversely related to vigilance of surveillance. If detected early, most are easily treated and reversible.
  • 15.
    Ipilimumab Pattern ofResponse: Responses After the Appearance and Subsequent Disappearance of New Lesions 3 mg/kg ipilimumab Q3W X 4 Pre-treatment Week 36: Still Regressing Week 12: Progression Week 20: Regression New lesions Source: 2008 ASCO Abstract #3020 Wolchok. July 2006
  • 16.
    irRC Identifies Survivorsin Patients with Progressive Disease by mWHO Pooled data from phase II studies CA184-008 and CA184-022: ipilimumab monotherapy 10 mg/kg (N=227) Wolchok et al, Clin Cancer Res, 2009
  • 17.
    Patients at Risk Ipilimumab4846 1786 612 392 200 170 120 26 15 5 0 0.0 0.1 0.2 0.3 0.4 0.5 0.6 0.7 0.8 0.9 1.0 0 12 24 36 48 60 72 84 96 108 120 Ipilimumab CENSORED Ipilimumab LongTerm Pooled Survival Analysis: 4846 Patients Median OS (95% CI): 9.5 (9.0–10.0) 3-year OS Rate (95% CI): 21% (20–22%) ProportionAlive Months Schadendorf, Hodi Wolchok, ESMO, 2013
  • 18.
    MHC PD-L1 PD-1 PD-1 PD-1 PD-1 Nivolumab,Pembrolizumab: PD-1 Receptor Blocking Abs Recognition of tumor by T cell through MHC/antigen interaction mediates IFNγ release and PD-L1/2 up-regulation on tumor Priming and activation of T cells through MHC/antigen & CD28/B7 interactions with antigen-presenting cells T-cell receptor T-cell receptor PD-L1 PD-L2 PD-L2 MHC CD28 B7 T cell NFκB Other PI3K Dendritic cellTumor cell IFNγ IFNγR Shp-2 Shp-2 Role of PD-1 Pathway inTumor Immunity 18 Sznol et al., ASCO, 2013
  • 19.
    Tumor Burden inPatients with Melanoma Receiving Nivolumab 19 Vertical line at 96 weeks = maximum duration of continuous nivolumab therapy Horizontal line at −30% = threshold for defining objective response (partial tumor regression) in absence of new lesions or non-target disease according to RECIST Unconventional response = response patterns that did not meet RECIST criteria (e.g., persistent reduction in target lesions in the presence of new lesions, or regression following initial progression) All Mel patients treated with 3 mg/kg nivolumab 4 Mel patients treated with unconventional responses from nivolumab 1st occurrence of new lesion 3 mg/kg Weeks since treatment initiation Changeintargetlesionsfrombaseline(%) 1st occurrence of new lesion Weeks since treatment initiation Changeintargetlesionsfrombaseline(%) 1 mg/kg 1 mg/kg1 mg/kg 10 mg/kg Sznol et al., ASCO, 2013
  • 20.
    Georgina V. Long,Victoria Atkinson, Paolo A. Ascierto, Benjamin Brady, Caroline Dutriaux, Michele Maio, Laurent Mortier, Jessica C. Hassel, Piotr Rutkowski, Catriona McNeil, Ewa Kalinka-Warzocha, Kerry J. Savage, Micaela Hernberg, Celeste Lebbé, Julie Charles, Catalin Mihalcioiu, Vanna Chiarion-Sileni, Cornelia Mauch, Henrik Schmidt, Dirk Schadendorf, Helen Gogas, Christine Horak, Brian Sharkey, Ian Waxman, Caroline Robert Nivolumab Improved Survival vs Dacarbazine in Patients with Untreated Advanced Melanoma
  • 21.
    Phase 3 CA209-066:Study Design *Patients may be treated beyond initial RECIST v1.1-defined progression if considered by the investigator to be experiencing clinical benefit and tolerating study drug Treat until progression* or unacceptable toxicity Primary endpoint: • OS Secondary endpoints: • PFS • ORR • PD-L1 correlates R 1:1 Nivolumab 3 mg/kg IV Q2W + Placebo IV Q3W N=210 (206 treated) Placebo IV Q2W + Dacarbazine 1000 mg/m2 IV Q3W N=208 (205 treated) Double- blind Eligible patients with unresectable stage III or IV melanoma (N=418) • BRAF wild-type • Treatment-naïve Stratified by: • PD-L1 status (≥ 5% cell-surface staining cutoff) • M-stage
  • 22.
    Best Overall Response Nivolumab (N= 210) Dacarbazine (N = 208) ORR, % (95% CI) 40% (33–47%) 14% (10–19%) Best overall response Complete response 8% 1% Partial response 32% 13% Stable disease 17% 22% Progressive disease 33% 49% Unable to determine 11% 15% Based on 5 August 2014 database lock.
  • 23.
    0 3 69 12 15 18 Primary Endpoint: Overall Survival Patients who died, n/N Median OS mo (95% CI) Nivolumab 50/210 NR Dacarbazine 96/208 10.8 (9.3–12.1) NR = not reached. Based on 5 August 2014 database lock. 100 90 80 70 60 0 50 40 30 20 10 HR 0.42 (99.79% CI, 0.25–0.73; P < 0.0001) (Boundary for statistical significance 0.0021) 210 208 185 177 150 123 105 82 45 22 8 3 0 0 Nivolumab (N = 210) Dacarbazine (N = 208) Months PatientsSurviving(%) 1-yr OS 73% 1-yr OS 42% Patients at Risk Nivolumab Dacarbazine Follow-up since randomization: 5.2–16.7 months.
  • 24.
    Improved OS irrespectiveof PD-L1 status OS by PD-L1 Status* 100 90 80 70 60 0 50 40 30 20 10 0 3 6 9 12 15 18 Months Nivolumab PD-L1+ Dacarbazine PD-L1+ Nivolumab PD-L1- Dacarbazine PD-L1- Patients at Risk Dacarbazine PD-L1- Nivolumab PD-L1- Dacarbazine PD-L1+ Nivolumab PD-L1+ 74 128 74 126 69 108 64 107 56 88 44 78 39 63 30 52 18 26 11 11 1 7 1 2 0 0 0 0 PatientsSurviving(%) 1-Yr OS % (95% CI) 82.1 (69.6–89.8) 67.8 (58.3–75.7) 52.7 (37.7–65.7) 37.4 (26.4–48.3) Patients who died, n/N Median OS mo (95% CI) Nivolumab PD-L1+ 11/74 NR Nivolumab PD-L1- 37/128 NR Dacarbazine PD-L1+ 29/74 12.4 (9.2–NR) Dacarbazine PD-L1- 64/126 10.2 (7.6–11.8) *PD-L1 positive: ≥ 5% tumor cell surface staining. PD-L1 negative: < 5% tumor cell surface staining. NR=not reached. Based on 5 August 2014 database lock.
  • 25.
    KEYNOTE-006 (NCT01866319): International, Randomized,Phase III Study Patients • Unresectable, stage III or IV melanoma • ≤1 prior therapy, excluding anti– CTLA-4, PD-1, or PD-L1 agents • Known BRAF statusa • ECOG PS 0-1 • No active brain metastases • No serious autoimmune disease Pembrolizumab 10 mg/kg IV Q2W Pembrolizumab 10 mg/kg IV Q3W R 1:1:1 Stratification factors: • ECOG PS (0 vs 1) • Line of therapy (first vs second) • PD-L1 status (positiveb vs negative) Ipilimumab 3 mg/kg IV Q3W x 4 doses aPrior anti-BRAF targeted therapy was not required for patients with normal LDH levels and no clinically significant tumor-related symptoms or evidence of rapidly progressing disease. bDefined as membranous PD-L1 expression in ≥1% of tumor cells as assessed by IHC using the 22C3 antibody. • Primary end points: PFS and OS • Secondary end points: ORR, duration of response, safety
  • 26.
    0 2 46 8 10 12 14 0 10 20 30 40 50 60 70 80 90 100 Time, months Progression-FreeSurvival,% No. at risk 279 231 147 98 49 7 2 0 277 235 133 95 53 7 1 1 278 186 88 42 18 2 0 0 PFS at Interim Analysis 1 (IA1) Analysis cut-off date: September 3, 2014. Median (95% CI), mo Rate at 6 mo HR (95% CI) P 5.5 (3.4-6.9) 47.3% 0.58 (0.46-0.72) <0.00001 4.1 (2.9-6.9) 46.4% 0.58 (0.47-0.72) <0.00001 2.8 (2.8-2.9) 26.5% — — Pembrolizumab Q2W Pembrolizumab Q3W Ipilimumab
  • 27.
    0 2 46 8 10 12 14 16 18 30 40 50 60 70 80 90 100 Time, months OverallSurvival,% No. at risk 279 266 248 233 219 212 177 67 277 266 251 238 215 202 158 71 278 242 212 188 169 157 117 51 19 18 17 0 0 0 OS at the Second Interim Analysis (IA2) Analysis cut-off date: March 3, 2015. Treatment Arm Median (95% CI), mo Rate at 12 mo HR (95% CI) P Pembrolizumab Q2W NR (NR-NR) 74.1% 0.63 (0.47-0.83) 0.00052 Pembrolizumab Q3W NR (NR-NR) 68.4% 0.69 (0.52-0.90) 0.00358 Ipilimumab NR (12.7-NR) 58.2% — —
  • 28.
    What about othermalignancies besides melanoma?
  • 29.
    Ansell SM etal. N Engl J Med 2015;372:311-319. Response Characteristics and Changes in Tumor Burden in Patients with Hodgkin's Lymphoma Receiving Nivolumab.
  • 30.
    Brahmer J etal. N Engl J Med 2015;373:123-135. Efficacy of Nivolumab versus Docetaxel in Patients with Advanced Squamous-Cell Non– Small-Cell Lung Cancer.
  • 31.
    Motzer RJ etal. N Engl J Med 2015. DOI: 10.1056/NEJMoa1510665 Nivolumab vs Everolimus for the treatment of metastatic RCC
  • 32.
    Blocking CTLA-4 andPD-1 T cell Tumor cell MHC TCR PD-L1PD-1 - - - T cell Dendritic cell MHC TCR CD28 B7 CTLA-4 - - - Activation (cytokines, lysis, proliferation, migration to tumor) B7 +++ +++ CTLA-4 Blockade (ipilimumab) PD-1 Blockade (nivolumab) anti-CTLA-4 anti-PD-1 Tumor Microenvironment +++ PD-L2PD-1 anti-PD-1 - - -
  • 33.
    Larkin J etal. N Engl J Med 2015;373:23-34. Nivolumab vs ipilimumab vs combination therapy in patients with metastatic melanoma: progression-free survival.
  • 34.
    Larkin J etal. N Engl J Med 2015;373:23-34. Tumor-Burden Change in Target Lesions.
  • 35.
    Where do wego from here? • Combination immunotherapy in other disease areas (AML, CLL, head and neck) • Other checkpoint antibodies (LAG3, GITR, OX40) alone and in combination with PD-1 • Checkpoint inhibitors in combination with therapeutic vaccines (Ty-Vec with anti-PD-1)
  • 36.