
Download to read offline

![From:From: Morteza Naghavi, M.D.Morteza Naghavi, M.D. [mailto:mn2@vp.org]
Sent:Sent: Thu 3/3/2005 1:29 AMThu 3/3/2005 1:29 AM
To: Erling Falk
Subject:
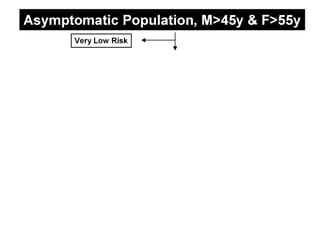
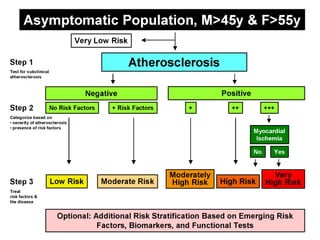
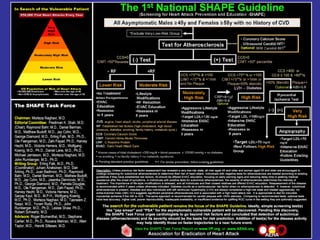
Erling, please note the yellow box is Lower Risk not Low Risk, … . Mort](https://image.slidesharecdn.com/qyglpvbus3e08f0kpz1q-signature-ff2318a174bfd4e5f1d417a23528cae62d8d53b9035de413ac0871ada57f583e-poli-160914033508/85/Dr-falk-s-slides-part-ii-52-320.jpg)
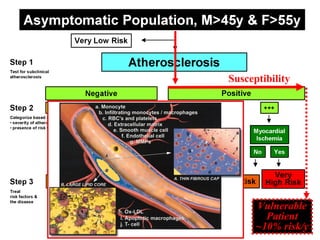
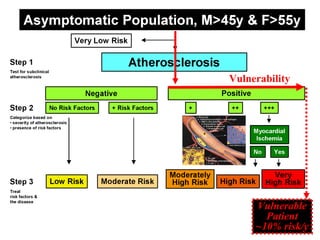
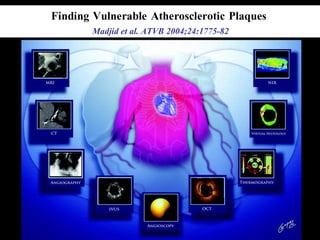
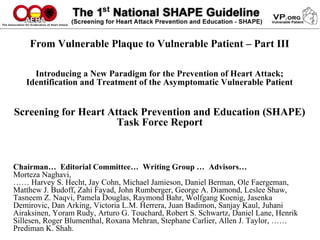
This document summarizes key points from a task force report on identifying and treating asymptomatic patients vulnerable to heart attack. It introduces a new paradigm focused on outcomes studies, measuring disease activity, and identifying the vulnerable plaque and patient. The report was chaired by Morteza Naghavi and had writing contributions from experts in cardiovascular imaging, risk assessment, and prevention. It aims to advance the field beyond traditional risk factor assessment alone.


