Download as PDF, PPTX

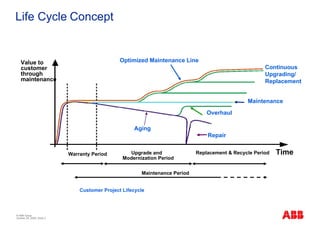
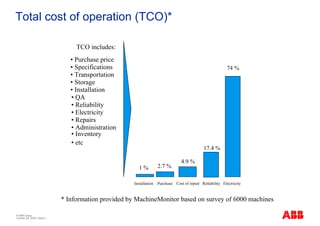
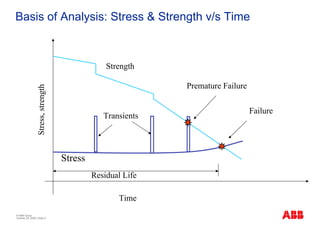
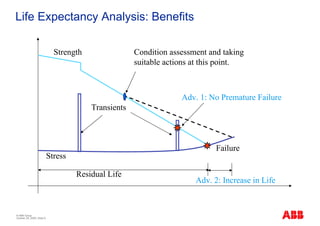
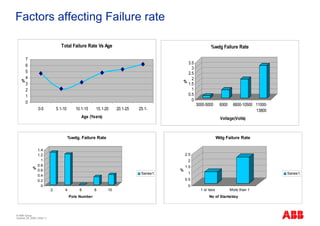
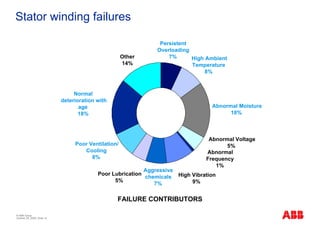
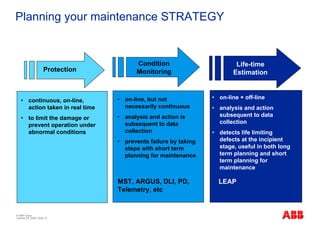
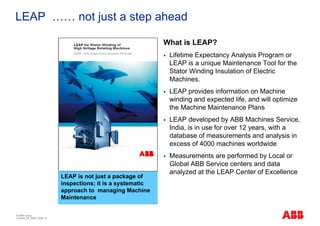
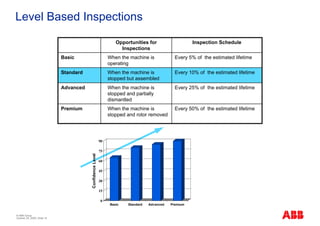
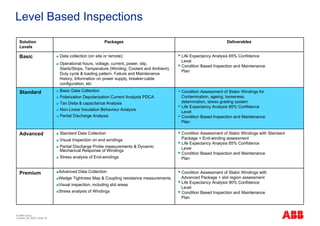
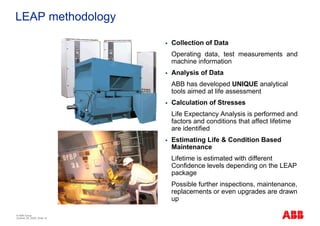
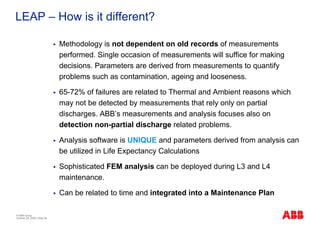


The document outlines the Life Expectancy Analysis Program (LEAP) for electrical machine insulation, focusing on its methodology, benefits, and statistical analysis of failures. LEAP provides a systematic approach to maintenance, facilitating optimized strategies and extending the life of machines by assessing conditions and recommending suitable actions. The program leverages extensive data collected globally to inform maintenance planning and improve operational reliability.