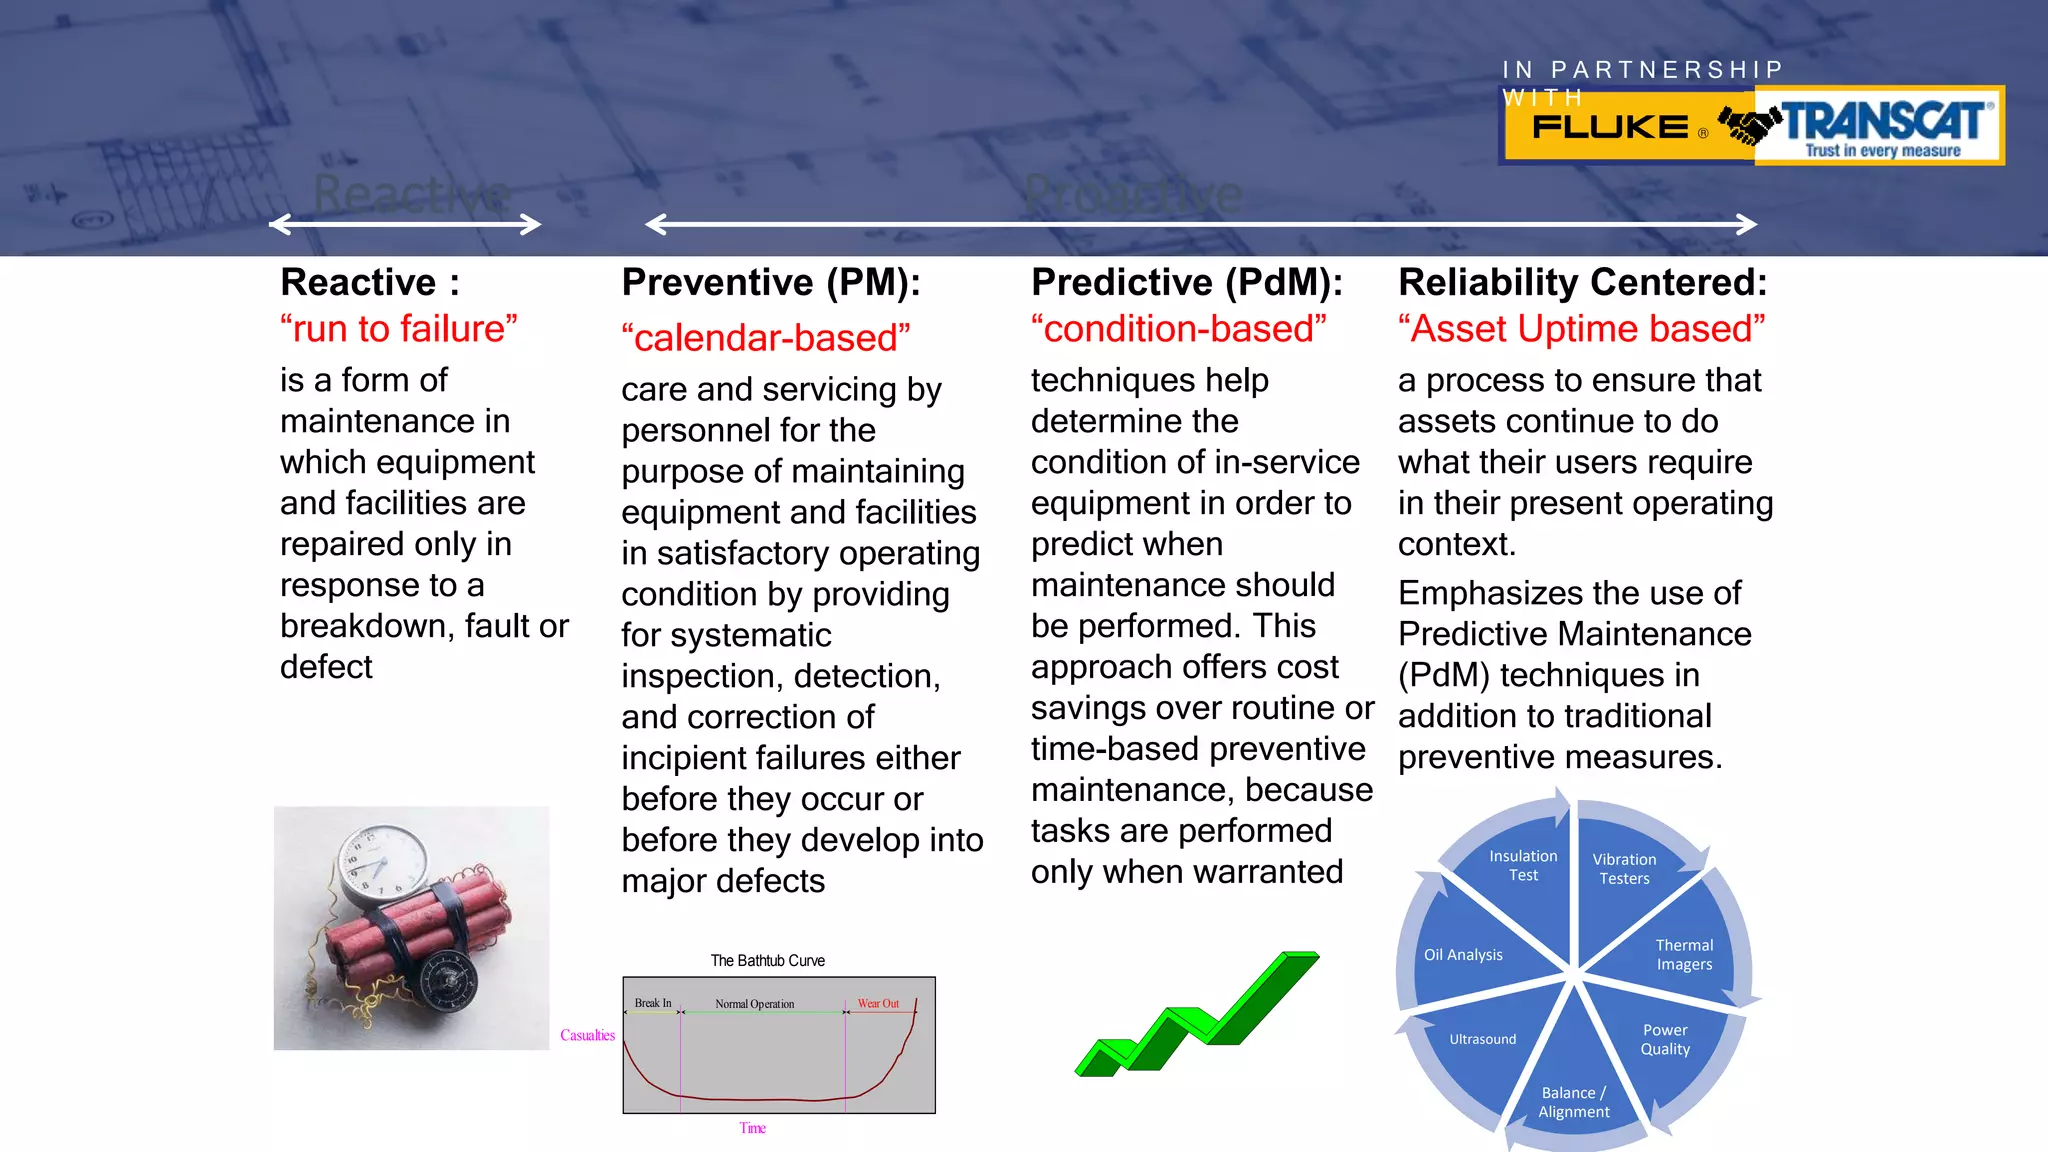
I N P A R T N E R S H I P
W I T H
Welcome to The Fluke Predictive Maintenance Webinar
This webinar is being hosted on GoToWebinar,
so there are just a few things to keep in mind:
Triple check that you
are muted!
Limit your distractions
and have fun!
Ask lots of questions and
share your thoughts!
X
1 2
3
I N P A R T N E R S H I P
W I T H
Today’s Agenda
24 years with Fluke
• NYC & Philly Metro Markets
• Sr Sales Engineer
• Sales Applications Mgr. –Northeast U.S.
40 years in the Test Equipment industry
• 12 years in Test Equipment Distribution
• 4+ years in Mfg representation-
• NAED Accreditation
• Level 1 Thermographer
• Level 1 Vibration Specialist
• Power Quality SME
• ISA Certified in Process Calibration
Curt Geeting
Sales Application Manager –Corporate Trainer
Fluke Industrial Group -Northeast
Bethlehem, PA
Keep your world up and running. ®
September 2023
Predictive Maintenance
Best Practices
Proactive testing to reduce
downtime and lost revenue
I N P A R T N E R S H I P
W I T H
Keep your world up and running. ®
Leading Test Technologies to start a
Predictive Maintenance program:
Thermal Imaging
Ultrasonic Imaging
Vibration Analysis
Energy Measurement Principles
Power Quality Analyzers
I N P A R T N E R S H I P
W I T H
I N P A R T N E R S H I P
W I T H
Today’s Agenda
• Maintenance Practices: Which is Best?
• Trends in Industrial Maintenance
• Leading Technologies
• Thermal Imaging
• Vibration
• Power Quality
• Conclusion: ROI and Savings
I N P A R T N E R S H I P
W I T H
Maintenance Practices: Which is Best?
• Maintenance Practices: Which is Best?
• Trends in Industrial Maintenance
• Leading Technologies
• Thermal Imaging
• Vibration
• Power Quality
• Conclusion: ROI & Savings
9/7/2023 6
9/7/2023 6
9/7/2023 6
I N P A R T N E R S H I P
W I T H
Before we begin
Ask yourself…
What is the cost of doing nothing
in your plant or facility ?
9/7/2023 7
I N P A R T N E R S H I P
W I T H
Case Study
Date: Nov 2009
Industry: Pulp & Paper
Fail Point: Motor Windings
Impact:
• $26K lost revenue from 6 hours of unplanned downtime
• $3K from expedite charges
• $4K from materials and overtime charges
Total financial cost of this single event exceeded $33K.
9/7/2023 8
9/7/2023 8
Did you know…A 10% reduction in maintenance costs at one manufacturing
plant had the same impact on the bottom line as a 40% increase in sales!
I N P A R T N E R S H I P
W I T H
9/7/2023 9
Reactive Maintenance Practices
Reactive Maintenance: Often called “run to failure” No repair or
maintenance actions are taken on machinery until the designed life span
is reached…or other variables cause the machinery to fail.
9/7/2023 9
Pros Cons
• Lower upfront maintenance costs
• Lower maintenance staff costs
• Unplanned, sometimes catastrophic,
downtime and overtime hours
• Secondary damage caused by failure
• Risk of higher capital costs
• Machines failures dictate
• Maintenance staffing schedule
I N P A R T N E R S H I P
W I T H
9/7/2023 10
Preventive Maintenance: Often called “calendar-based
maintenance”. Repairs or maintenance actions are taken on machinery
on a scheduled basis, regardless of actual condition of equipment.
9/7/2023 10
Pros Cons
• 50% of electrical failures can be prevented
with regular maintenance and inspection
• Increased equipment life
• Reduced equipment failure
• More predictable staffing schedule
• Fault free machines are serviced
unnecessarily
• More labor intensive than reactive
Reactive Maintenance Practices
I N P A R T N E R S H I P
W I T H
9/7/2023 11
Mean Time to Failure (MTTF)
9/7/2023 11
Break in or
start-up
Normal life Equipment worn
out
High probability of
failure, due to
manufacturing or
installation problems
Low probability of failure Degradation of
machine parts,
over time
Time
Number
of
failures
I N P A R T N E R S H I P
W I T H
9/7/2023 12
Predictive Maintenance (PdM) Practices
Predictive Maintenance: Often called “condition-based maintenance”. Repairs
or maintenance actions are taken based on changes in machine performance,
monitored over time with various test equipment.
9/7/2023 12
Pros Cons
• Equipment is serviced when needed • Most labor intensive testing
• Lowest repair part and expedite costs • Increased investment in diagnostic / test
equipment
• Increased equipment life • Increased investment in staff training
• Reduced equipment failure • Cost/benefit of routine monitoring not readily
apparent to management
I N P A R T N E R S H I P
W I T H
Spectrum of Maintenance Practices
9/7/2023 13
Reactive Preventive Predictive
•Non-critical, low cost
equipment
•Run to fail
•Mission Critical, high
cost equipment
•Anticipate equipment
degradation
• How is maintenance performed in your facility?
• How often do breakdowns occur?
• What do you do to keep breakdowns from recurring?
I N P A R T N E R S H I P
W I T H
Which Practice is Best?
9/7/2023 14
Reactive Preventive Predictive
BLENDED
I N P A R T N E R S H I P
W I T H
Why use a blended approach?
• Not All Equipment is Created Equal
• Cost of machinery / equipment
• Ease of replacement
• Risk of interruption to business processes
• Cost Benefit Tradeoffs
• Balance costs of active programs with the benefits received
• Cultural Fit
• Not all organizational cultures are supportive of a full Preventive or PdM maintenance program
• Attitudes toward maintenance are evolving
9/7/2023 15
Reactive
Predictive
Preventive
I N P A R T N E R S H I P
W I T H
16
Reactive :
“run to failure”
is a form of
maintenance in
which equipment
and facilities are
repaired only in
response to a
breakdown, fault or
defect
Preventive (PM):
“calendar-based”
care and servicing by
personnel for the
purpose of maintaining
equipment and facilities
in satisfactory operating
condition by providing
for systematic
inspection, detection,
and correction of
incipient failures either
before they occur or
before they develop into
major defects
Predictive (PdM):
“condition-based”
techniques help
determine the
condition of in-service
equipment in order to
predict when
maintenance should
be performed. This
approach offers cost
savings over routine or
time-based preventive
maintenance, because
tasks are performed
only when warranted
Time
Normal Operation Wear Out
Break In
The Bathtub Curve
Casualties
Reactive Proactive
Reliability Centered:
“Asset Uptime based”
a process to ensure that
assets continue to do
what their users require
in their present operating
context.
Emphasizes the use of
Predictive Maintenance
(PdM) techniques in
addition to traditional
preventive measures.
Vibration
Testers
Thermal
Imagers
Power
Quality
Balance /
Alignment
Ultrasound
Oil Analysis
Insulation
Test
I N P A R T N E R S H I P
W I T H
Next Up: Thermal Imaging
9/7/2023 22
9/7/2023 22
• Maintenance Practices: Which is Best?
• Trends in Industrial Maintenance
• Leading Technologies
• Thermal Imaging
• Vibration
• Power Quality
• Conclusion
9/7/2023 22
I N P A R T N E R S H I P
W I T H
What is infrared?
9/7/2023 23
I N P A R T N E R S H I P
W I T H
How can infrared help me?
• Most electrical and mechanical defects cause increase in
temperature
• Thermal imaging provides a fast and clear picture of this
temperature increase
• Safety: Thermal images can be taken while production is running
without any contact
• Anybody can take a picture
9/7/2023 24
I N P A R T N E R S H I P
W I T H
Understanding modes of heat transfer
9/7/2023 25
I N P A R T N E R S H I P
W I T H
Thermal imaging considerations
• Ensure adequate thermal gradients
• Understand thermal capacitance
• Account for wind effects
• Avoid angular variations
• Remember heat transfers from hot to cold
• Be aware of your surroundings
9/7/2023 26
I N P A R T N E R S H I P
W I T H
Thermal imaging considerations (cont’d)
• Know when qualitative measurements are sufficient
• Compare similar components under similar conditions
• Understand present and future loading conditions
• Inspect with highest load possible (at least 40%)
9/7/2023 27
I N P A R T N E R S H I P
W I T H
Thermal imaging applications
• Electrical
• Mechanical
• Process
• Building Diagnostics
9/7/2023 28
I N P A R T N E R S H I P
W I T H
Causes of electrical hot spots
• Unbalanced loads
• Harmonics (3rd harmonic current in Neutral)
• Overloaded systems/excessive current
• Loose or corroded connections increased resistance in the circuit
• Insulation failure
• Component failure
• Wiring mistakes
• Underspecified components
9/7/2023 29
I N P A R T N E R S H I P
W I T H
9/7/2023 30
Hot phase
Fuse disconnect
Substation
Lighting Circuit
Motor Control Center
Buss
I N P A R T N E R S H I P
W I T H
Inspection Frequency
Equipment Type Frequency of Inspection
High voltage substations 1 - 3 Years
Transformers Annually
440V Motor Control Centers 6 - 12 Months
(Air conditioned)
Non-air conditioned or older 4 - 6 Months
Electrical distribution Equipment 4 - 6 Months
Large Motors * Annually
Smaller motors 4 - 6 Months
* Assumes vibration, MCA or lube is being also being used
I N P A R T N E R S H I P
W I T H
Causes of mechanical hot spots
• Bad cooling- due to reduced airflow
• PQ problems like unbalance, overload
or 5th harmonic (voltage)
• Insulation problems with motor windings
• Bearing problems – lubrication, wear,
tolerance
• Bad alignment
9/7/2023 32
I N P A R T N E R S H I P
W I T H
9/7/2023 33
Compressors - normal
Hydraulic pumps Misaligned belt
Small bearing issue
Electric motor
Roller bearings
Coupling
I N P A R T N E R S H I P
W I T H
Causes of process hot spots
• Damaged structures caused by worn pipes
• Abnormal heat flow/heat gradients
• Defective valves/traps
• Normal tank level fluctuations
9/7/2023 34
I N P A R T N E R S H I P
W I T H
9/7/2023 35
High temp cement kiln
Observe weld cooling
Tank Levels
1 1 9 .
3 0 2 .
1 5 0
2 0 0
2 5 0
3 0 0
Steam Traps
Cement Kiln
Pipe Integrity
Chiller Operation
I N P A R T N E R S H I P
W I T H
Causes of building diagnostic hot spots
• Roof leaks
• Air Leak
• In-floor heating
• Missing insulation
9/7/2023 36
I N P A R T N E R S H I P
W I T H
9/7/2023 37
Roof deck moisture
In-floor heat verification
Missing insulation
Moisture
Air Leak Attic access – air leak
I N P A R T N E R S H I P
W I T H
How is the Image Created?
Thousands of IR Temperature Measurements
Each “Pixel” represents a temperature measurement
I N P A R T N E R S H I P
W I T H
Spot Size & Resolution
• Larger area for average temperature when further away.
• Distance to spot ratio.
• Zoom lens decreases spot size.
9/7/2023 39
I N P A R T N E R S H I P
W I T H
Heat Capacity
Thermal capacitance can help
find the liquid level in a tank
Also leaks in a flat roof, Sun heats roof
and after Sun goes down dry
insulation cools faster than higher heat
capacity wet insulation
I N P A R T N E R S H I P
W I T H
What is an IR Window?
• Access point for inspection
• Permanently installed
• Can be retro-fitted
Fluke Sales Meeting 2009 41
I N P A R T N E R S H I P
W I T H
Easy to Use
Transmission correction
• On-imager adjustment for transmission loss
• Accurate temperature readings even when using an IR-window
I N P A R T N E R S H I P
W I T H
Ultrasonic Leak Detection – ii900 / ii910
Air/Gas Leak Detection in Manufacturing Facilities
I N P A R T N E R S H I P
W I T H
Compressed air leaks are a recurrent and expensive problem that cost thousands of $ per year.
• A typical plant that has not been well maintained leaks 20-30% of total compressed air
production capacity
• Example: 200 HP compressor operating 8760 hrs/yr @ $0.08/KWh costs almost $90K to operate
annually, estimated $26K wasted energy cost annually
• Proactive leak detection and repair can reduce leaks to less than 10% of compressor output.
• Leaks cause a drop in system pressure, which can make air tools function less efficiently,
adversely affecting production.
• By forcing the equipment to cycle more frequently, leaks shorten the life of almost all system
equipment (including the compressor package itself).
• Finally, leaks can lead to adding unnecessary compressor capacity.
Source: Best Practices for Compressed Air Systems
BACKGROUND FACTS
I N P A R T N E R S H I P
W I T H
Where compressed air and gas is used
This Photo by Unknown Author is licensed under CC BY-SA
Airbrush
This Photo by Unknown Author is licensed under CC BY-SA
Industrial robots
Industrial compressors
This Photo by Unknown Author is licensed under CC BY-SA
Air operated valves
This Photo by Unknown Author is
licensed under CC BY-SA
This Photo by Unknown Author is licensed under CC BY-SA
I N P A R T N E R S H I P
W I T H
Value of Leak Detection
Compressed air leaks an expensive problem. Detecting and repairing them is resource consuming
• A single 1/8” leak in a compressed
air line can cost $2,000 to $5,000 a
year
• Plants generally leak 20-30% of total
compressed air capacity
• Production quality can be adversely
affected by fluctuating air pressure
Source: U.S Department of Energy, Energy Efficiency and Renewable Energy : Energy Tips – Compressed Air (August 2004)
I N P A R T N E R S H I P
W I T H
What is Acoustic Imaging?
I N P A R T N E R S H I P
W I T H
Acoustic Imaging basics
• A technique to create an image of an issue based
on the sounds in the scene
• The sound image is then overlaid onto a visible
image
I N P A R T N E R S H I P
W I T H
How the Sound Map™ is created
How does imager know where to put
sound on the image?
I N P A R T N E R S H I P
W I T H
How the Sound Map™ is created
• 64 microphones
• Microphones receive sound in real time
(frequency and db levels)
• Proprietary algorithm calculates a sound
image
• Superimposes sound image on a visual
image.
I N P A R T N E R S H I P
W I T H
Time savings
Scan point-by-point, listening
for potential leaks, using a long-
range sensor.
Get close, swap ultrasonic
sensors, confirm it is a
leak, pinpoint leak source.
Manually tag the
leak and write
down its location
• Scan large areas at a glance
• Take a picture that pinpoints the leak location
• See multiple leaks on a single image
• Save and tag leaks with info
• Quantify leak severity – generate reports
Acoustic Imaging
2 leaks in under 5 minutes
• Trained inspector with educated ear listens to
identify whether noise is from a leak
• Requires experience, training and certifications
• Involves point by point meticulous inspections
• Manual tagging
Traditional Ultrasonic methods
1 leak in 10 minutes
Find leaks in a fraction of the time
I N P A R T N E R S H I P
W I T H
Next Up: Vibration
9/7/2023 52
9/7/2023 52
9/7/2023 52
• Maintenance Practices: Which is Best?
• Trends in Industrial Maintenance
• Leading Technologies
• Thermal Imaging
• Vibration
• Power Quality
I N P A R T N E R S H I P
W I T H
What is mechanical vibration?
• Vibration is the oscillation of a point, an object, or
a part of an object around a fixed reference, or
rest, position.
• Some types of vibration are by design…most types
are symptoms of other problems such as bearing
condition, shaft misalignment, looseness or out-of-
balance conditions.
9/7/2023 53
I N P A R T N E R S H I P
W I T H
Early Indicators of Machine Health
• In the world of mechanical maintenance, vibration remains one of
the earliest indicators of a machine’s health.
• With over half of unplanned downtime attributed to mechanical
failures, why aren’t more companies investing in vibration
analysis?
Point where
failure starts to
occur
Changes in Vibration P-F Interval 1-9 months
Wear Debris in Oil P-F Interval 1-6 mos
IR Thermography P-F Interval 3-12 wks
Quantitative PM P-F Interval 5-8 wks
Audible Noise P-F Interval 1-4 wks
Heat By Touch P-F Interval 1-5 days
F
P P
1
P
2 P
3 P
4 P
5
P6
P = Potential Failure
F = Failure
The P-F Curve, Adapted from John Moubray’s book “Reliability Centered Maintenance II”
I N P A R T N E R S H I P
W I T H
What problems does vibration cause?
• Equipment failure
• Unplanned downtime
• Safety Concerns
• Financial Loss
9/7/2023 55
Belt failure
Electric motor failure Roller bearings failure
Coupling Failure
I N P A R T N E R S H I P
W I T H
Four common causes of vibration
9/7/2023 56
Bearing
Failure
Misalignment
Unbalance
Looseness
1.
2.
3.
4.
I N P A R T N E R S H I P
W I T H
Sources of bearing failure
• Heavier than anticipated loading
• Inadequate or incorrect lubrication
• Ineffective sealing
• Shaft misalignment
• Incorrect fit
9/7/2023 57
Bearing Failure
Misalignment
Unbalance
Looseness
Sources of
Vibration
I N P A R T N E R S H I P
W I T H
Types of misalignment
9/7/2023 58
Bearing Failure
Misalignment
Unbalance
Looseness
Sources of
Vibration
Angular – the centerline of the two shafts
intersect but are not parallel.
Parallel – the centerline of the two shafts
are parallel but not concentric.
Parallel and Angular (Common) – most
misalignment is a combination of
angular and parallel
I N P A R T N E R S H I P
W I T H
Sources of misalignment
• Poor assembly or shifting after assembly
• Distortion due to pipe strain
• Distortion due to torque combined with flexible
support
• Temperature induced growth of the machine
structure
• Poorly machined coupling
• Inadequate coupling lubrication
9/7/2023 59
Bearing Failure
Misalignment
Unbalance
Looseness
Sources of
Vibration
I N P A R T N E R S H I P
W I T H
Sources of unbalance
• Dirt accumulation or missing balance weights
• Lack of homogeneity in materials, especially in
castings (e.g. porous sections, blow-holes)
• Difference in dimension of mating parts (e.g.
shaft, bore…)
• Roller deflection (e.g. paper mill rolls) or
machining errors
• Uneven mass distribution in electrical windings
• Uneven corrosion, eccentric rotor or erosion of
rotors
9/7/2023 60
Bearing Failure
Misalignment
Unbalance
Looseness
Sources of
Vibration
I N P A R T N E R S H I P
W I T H
Two types of looseness
9/7/2023 61
Bearing Failure
Misalignment
Unbalance
Looseness
Sources of
Vibration
Rotating – excessive clearance between
rotating and stationary elements of the
machine such as in a bearing.
Non-Rotating – gaps between two normally
stationary parts, such as a foot and a
foundation, or a bearing housing and a
machine.
I N P A R T N E R S H I P
W I T H
Benefits of vibration testing
• Vibration testing enables you to
detect installation errors, component
wear, and lubrication problems
• Vibration provides the earliest
indicator of machine condition
• Vibration addresses all the moving
parts of rotating equipment – and
can identify root cause
9/7/2023 62
I N P A R T N E R S H I P
W I T H
How does vibration testing work?
• All rotating equipment generate a
unique vibration signal or “signature”
• These unique signals are usually
captured in series through a
transducer, with the signal’s amplitude
(y-axis) depicted over time (x-axis).
This is called a time waveform.
• Proper interpretation of the time
waveform enables diagnosis of a
problem
9/7/2023 63
I N P A R T N E R S H I P
W I T H
History of vibration testing
• Technology was very difficult to use
• Limited to vibration testing professionals
• Equipment was cost prohibitive
Few customers could realize the value that vibration offers
9/7/2023 64
I N P A R T N E R S H I P
W I T H
Fluke 810 Vibration Tester
9/7/2023 65
Get Answers Now.
I N P A R T N E R S H I P
W I T H
Fluke makes vibration testing easier
• With the Fluke 810, vibration testing is within reach
• It’s easy to use
• It gives you answers when you need them
• It includes everything you need to get started immediately
• You will understand
• Root cause of faults and fix it right the first time
• Severity of failures and prioritize your repairs
• Location of faults and focus your repair work
• Minimal upfront investment…but the ROI is significant
9/7/2023 66
I N P A R T N E R S H I P
W I T H
How does the Fluke 810 work?
• Traditional vibration analysis
takes a long-term view, where a
baseline condition is established
and a machine’s condition is
compared over time to the
original baseline.
• Fluke 810 feeds the setup and
measurement data into a set of
powerful algorithms to identify a
machine’s mechanical faults
• Fluke 810 uses an innovative
“synthetic baseline” to determine
fault severity
9/7/2023 67
Diagnostic
Engine
marks
abnormal
peaks
I N P A R T N E R S H I P
W I T H
Vibration testing in three simple steps
9/7/2023 68
Setup your unique machine configuration
The 810 asks for basic machine information customers
already know. Its onboard Info feature gives field tips for
setting up and taking measurements like a pro
Measure the machine conditions
Use the transducer to measure vibration at key locations
along your mechanical system.
Diagnose the specific problems
With the press of a button, the Fluke 810 identifies the root
cause, its location, and how severe the problem is
I N P A R T N E R S H I P
W I T H
Sample of machine setup fields
• Machine Name: Pump 1
• AC Motor
• No Variable Frequency Drive
• RPM: 1800 (Minimum 200 RPM)
• HP: 40
• Motor Mounting: Horizontal
• Motor Bearing Type: Roller Bearing
• Next Component: Flexible Coupling
• Driven Component: Centrifugal
Pump
• Impeller is supported by: Two
Bearings
• Number of Vanes [optional]: 5
9/7/2023 69
I N P A R T N E R S H I P
W I T H
Mounting Options Advantages: Highest frequency response, very repeatable
data over time.
Disadvantages: Less practical for “walk-around”
troubleshooting due to time needed to screw/unscrew the
Sensor from machinery, often difficult to tap a hole in the
desired measurement location.
Advantages: High frequency response approaching that of
a stud mount without having to tap a hole, very repeatable
data over time.
Disadvantages: Less practical for “walkaround”
troubleshooting due to time needed to screw/unscrew the
Sensor from mounting pad.
Advantages: Fastest, most convenient method for
“walkaround” troubleshooting.
Disadvantages: While typically adequate for
troubleshooting, the magnetic mount does not have as
high a frequency range as options that are more
permanent.
• Fluke 810 ships with a magnetic mount and 10 mounting pads with adhesive
• Additional mounting pad packs are available as accessories
I N P A R T N E R S H I P
W I T H
Understanding the diagnosis
9/7/2023 71
WHAT IS THE PROBLEM?
WHERE IS THE PROBLEM?
HOW BAD IS THE PROBLEM?
The Fluke 810 Vibration
Tester will provide you
actionable answers NOW.
I N P A R T N E R S H I P
W I T H
810 Vibration Tester Features
9/7/2023 72
• On-board diagnosis and location of the four most
common standard mechanical faults: bearings,
looseness, misalignment, unbalance and other
(nonstandard faults)
• Fault severity scale with four severity levels: Slight,
Moderate, Serious, and Extreme
• Prioritized repair recommendations
• Diagnostic details include cited peaks and vibration
spectra
• Context Sensitive Help
• 2 GB expandable on-board memory
• Data export (via USB connection) for more detailed
Analysis
• Laser tachometer for accurate machine running
speed
• 100 mV/g TEDS tri-axial accelerometer
• Data storage and tracking with included VIEWER
Software
• Languages: English, French, German, Italian,
Portuguese, Spanish, Japanese, Simplified Chinese
I N P A R T N E R S H I P
W I T H
Viewer PC Software
9/7/2023 73
• Transfer machine data to and from the Tester
• Export machine data for additional expert analysis
• Create, edit, delete machine setups easily with the keyboard
• Review full machine diagnosis,
• View spectra in full detail
• Modify application settings (e.g. language, date/time, units, sub units,
etc.
VIEWER Software enables the users to upload their machine data
(machine setups and diagnostic data) to store, keep track and view in
greater detail. Also users can use the PC to set up machinery fast and
easy.
I N P A R T N E R S H I P
W I T H
Viewer PC screen shot
9/7/2023 74
• Simple user interface, enabling
quick access to the most important
features
•Easy access to diagnostic reports
from prior tests
•Integrated support for thermal
images to reinforce findings
I N P A R T N E R S H I P
W I T H
Machine Setup
• Create and manage your machine setups in the Viewer software, then sync it
up with the 810 Vibration Tester
I N P A R T N E R S H I P
W I T H
Diagnosis Details – Spectra
• Viewing the spectra is
simple on the 810
• Export the data to the
Viewer software and view
spectra in greater detail
I N P A R T N E R S H I P
W I T H
Everything you need – out of the box
9/7/2023 77
• Vibration Tester
• Laser tachometer with pouch
• Triaxial-TEDS accelerometer
(sensor)
• Quick disconnect cable
• Sensor mounting pad kit with
adhesive
• USB cable
• Viewer PC software
• Shoulder and hand straps
• Hard carrying case
• Quick Reference Guide
• Getting Started Guide
• User Manual CD
• FREE Product/Application Training
DVD (available separately)
I N P A R T N E R S H I P
W I T H
Cost of Downtime / Repair Cost (RTF)
1. Net income per hour of output for production line or other critical process $20,000/hr (critical & non-critical machine failures)
2. Calculate the average downtime (due to mechanical failures) for each equipment
failure and number of events per year.
8 hrs down, 5 motors, 1x/yr
3. Multiply the results of step 1 by both values in step 2. ($20,000 * 8) * 5 = $800,000
4. Estimate labor (overtime) and equipment parts cost per downtime incident $30/hr * 8 hrs * 2 techs = $480 + $5000/motor = $5480
5. Add step 3 and step 4. This is the annual cost in lost revenue plus repair costs $805,480 (due to critical/non-critical failures)
Fluke 810 Pays for Itself…And Then Some
Cost of Program Implementation Cost
1. Cost of Fluke 810 $10,000
2. Average cost of dedicated, experienced vibration technician (FTE)(Assume 1 man
hour/motor/month)
$0 (Use existing technician resources – no incremental cost)
3. Average upfront equipment training costs + “maintenance training” $0 (Training DVD included – no incremental training costs)
4. Add steps 1 through step 3. This is the total first year cost of program startup $10,000
Vibration Testing Payback Cost
1. Assume 50% of unplanned downtime and repair costs savings $805,480 * 50% = $402,740
2. Return on Investment & Payback of Fluke 810 (total cost per year / total savings
per year)
$10,000 / $402,740 = 1 wk
Fluke 810 makes vibration testing easy for maintenance teams – no additional
training costs, software and support fees, fits into existing preventive maintenance
routines
I N P A R T N E R S H I P
W I T H
Fluke 810 Vibration Tester
9/7/2023 79
Visit www.fluke.com/machinehealth for
more information
I N P A R T N E R S H I P
W I T H
Next Up: Power Quality
• Maintenance Practices: Which is Best?
• Trends in Industrial Maintenance
• Leading Technologies
• Thermal Imaging
• Vibration
• Power Quality
• Conclusion : ROI & Savings
9/7/2023 80
9/7/2023 80
9/7/2023 80
I N P A R T N E R S H I P
W I T H
Energy Logging
81
Why is my Energy bill so high and where is this power being wasted ?
I N P A R T N E R S H I P
W I T H
Beer Power Analogy and the Power Triangle
I N P A R T N E R S H I P
W I T H
• What is it?
• Rate at which AC energy
is expended. Watts
measure the energy
required to do actual
work, such as running a
motor.
• Customer Pain Point
• Energy waste
• Value to the Customer
• Trending V, A, W over
extended periods can
expose potential waste
and savings
Quantity: Power, kW
I N P A R T N E R S H I P
W I T H
• What is it?
• Total voltage and current
required from the utility,
regardless of its efficiency or
whether it does actual work.
• Customer Pain Point
• Need to reduce energy waste
and find energy savings.
• Value to the Customer
• Energy Loss Calculator feature
equates energy loss to dollars
Quantity: Demand, kVA
I N P A R T N E R S H I P
W I T H
• What is it?
• When a circuit operates at 100% efficiency, demand = power. When power is
less than demand, the difference, kW/kVA, is power factor. PF below 0.90 or
0.95 is inefficient (depending on supply)
• Customer Pain Point
• Inefficient power means paying more for energy.
• Value to the Customer
• PF is measured directly by PQ instruments, so the customer does not need to
calculate manually and has quick snapshot (or trend) of the PF.
Quantity: Power Factor, PF
I N P A R T N E R S H I P
W I T H
Power, Demand or Consumption?
86
What to measure? You need to map your consumption
• Compare against utility meter/bills
• Evaluate peak demand and any power factor charges
“The Speedometer Analogy”
kW = speed (mph)
kWh = distance (miles)
I N P A R T N E R S H I P
W I T H
• Peak demand determines how big the “electricity pipe” must be to deliver the power needed for the
facility
• Peak demand is the highest of consecutively-measured, 15-minute average kW readings (technique may
vary by supplier)
• For some larger consumers utilities include a demand charge to cover the cost of investing in the
required equipment to deliver the power
Peak Demand - the most expensive power
87
Continuous kW
15-minute Average kW
15min 15min 15min 15min
I N P A R T N E R S H I P
W I T H
Quantity: The Utility Bill
Maximum demand
charges
Fixed demand charges
Utility energy consumption charges are broken into
• Active (or true) power (kW) delivered by the utility
• Variances due to Power Factor
• Variances due to market demand
Understand what to measure.
Energy consumption is
the accumulation of power
over time expressed in
kilo watt hours (kWh)
I N P A R T N E R S H I P
W I T H
220.87 Determining Existing Loads. The calculation of a feeder or service load for existing installations shall be permitted to use actual
maximum demand to determine the existing load under all of the following conditions:
(1)The maximum demand data is available for a 1-year period.
Exception: If the maximum demand data for a 1-year period is not available, the calculated load shall be permitted to be based on the maximum demand (measure of average power demand over a 15- minute period) continuously recorded
over a minimum 30-day period using a recording ammeter or power meter connected to the highest loaded phase of the feeder or service, based on the initial loading at the start of the recording. The recording shall reflect the maximum
demand of the feeder or service by being taken when the building or space is occupied and shall include by measurement or calculation the larger of the heating or cooling equipment load, and other loads that may be periodic in nature due
to seasonal or similar conditions.
(2) The maximum demand at 125 percent plus the new load does not exceed the ampacity of the feeder or rating of the service.
(3) The feeder has overcurrent protection in accordance with 240.4, and the service has overload protection in accordance with 230.90.
NFPA 70E NEC Code 220
89
I N P A R T N E R S H I P
W I T H
Electric Utility,
IT/Computers HVAC,
Motors &
Drives
Lighting,
Compressed
Air, Steam
Systems
Building
Envelope
Fluke tools identify equipment inefficiency and
behavioral process waste.
Industrial Facilities Energy Efficiency
I N P A R T N E R S H I P
W I T H
Loads: Lighting, computers etc.
Main Service
Entrance
Load #1 50 kVA
Load #2
100 kVA
Motor #1
Sub-
panel
#1.1
Sub-
panel
#1.2
480 V
panel
Motor #2
Starter
Disconnect
Disconnect
Transformer
Disconnect
Capacitor
How Should You Measure Energy Consumption?
91
Measure your energy consumption by at each point for roughly one week and
know your operation limits.
I N P A R T N E R S H I P
W I T H
Common Causes of Energy Waste
Energy Study,
Power Trend
PQ Health.
Harmonics, Power
Factor & Unbalance
Energy Study, Power
Trend with Motor
State
Human and Process Inefficiencies.
“The lights are on, but no one is home”,
“The machines are running but nothing is
being produced”
Operating loads exceed utility peak
demand rate
Poor Power Quality
Worn or faulty loads. Compressor air
leaks, worn pump impellers or
constricted orifices, clogged air
filters
Energy Study,
Consumption
Calendar
Level load process or move to off
peak hours
Eliminate source of power quality
issues
Correlate motor excessive on/off
cycle to energy consumption
profile. Check load amperage to
name plate rating
Install automatic switches and
timers
Causes or Conditions Measurements Solutions
I N P A R T N E R S H I P
W I T H
Power Quality Components
93
Why is equipment not working in my facility ?
I N P A R T N E R S H I P
W I T H
• What is it?
• Multiples of the supply frequency, i.e. the fifth
harmonic would be 250 Hz if the supply
frequency is 50 Hz. Caused by non-linear
power electronic loads.
• Customer Pain Point
• Unusable power, drawn from utility but not
converted to actual work
• Failures in neutral conductors
• Motors and transformers run hot, decreasing
efficiency and shortening lifespan
• Reduced transformer efficiency — or, a larger
unit is required to accommodate harmonics
• Value to the Customer
• Pinpoint the source of harmonics by using
1736/38, 177x series, and 1760.
Quality: Harmonics
I N P A R T N E R S H I P
W I T H
• What is it?
• The line voltage is higher or lower than
the nominal voltage for a shorter period.
Caused by e.g. network faults, switching
of capacitive loads, and excessive
loading.
• Customer Pain Point
• Intermittent loss of power
• Potentially damage equipment
• Value to the Customer
• Count the number of dips and swells in a
system in order to locate which piece of a
system is causing issues.
Quality: Dips & Swells
I N P A R T N E R S H I P
W I T H
• What is it?
• Rapid change in the sine wave that
occurs in both voltage and current
waveforms. Caused by switching devices,
start- and stop of high power equipment.
• Customer Pain Point
• Breaker trips and leads to downtime
• Damaged equipment
• Value to the Customer
• Avoid downtime and damaged equipment
due to transients by providing capture of
transients.
Quality: Transients
I N P A R T N E R S H I P
W I T H
• Requires high pass filter to remove fundamental signal
• High sampling rates are important for accurate measurements
• Typical loggers sample at 10.24 kHz
• Fluke 177X Series capture transients at 1 MHz and 20 MHz
Quality: Transients
97
3.8 kHz Sampling
865 volts
30 kHz Sampling
866 volts
5 MHz Sampling
2,800 volts
I N P A R T N E R S H I P
W I T H
• What is it?
• Different line voltages or currents. Caused
by single-phase loads, phase to phase
loads and unbalanced three-phase loads
like welding equipment.
• Customer Pain Point
• Voltage unbalance causes stress on
3-phase loads, leading to inefficient
consumption and eventual device failure.
• Unbalance can also cause intermittent
circuit breaker issues.
• Value to the Customer
• Avoid nuisance tripping and overheating of
equipment. Fluke meters provide the
unbalance percentage, so the customer
does not need to make the calculations.
Quality: Unbalance
I N P A R T N E R S H I P
W I T H
• What is it?
• Visible change in brightness of a lamp due to rapid fluctuations in
voltage of the power supply as defined in IEC 61000-4-15. Can be
caused by electric arc furnaces, large motors (when starting),
welders, boilers, etc.
• Customer Pain Point
• Nuisance tripping due to mis-operation of relays and contactors
• Unwanted triggering of UPS units to switch to battery mode
• Problems with some sensitive electronic equipment, which require
constant voltage (i.e. medical laboratories)
• Value to the Customer
• Avoid nuisance tripping and find what equipment is causing flicker
issues. Events capture allows for engineer to step away from
measurement and do other work while the instrument provides a
tally count of any flicker events.
Quality: Flicker
I N P A R T N E R S H I P
W I T H
Causes of Poor Power Quality
Harmonics
Dips & Swells
Unbalance
Transients
Inductive & Capacitive Loads.
An oven element is pure resistive. Whereas
motors, ballasts, and most electronic devices are
inductive or capacitive
Non-Linear Loads. Operating loads whose
demand for energy rapidly changes, sub-cycle
fast changes
High energy loads turning on or off causing
variation in voltage.
Loads improperly distributed across each phase
Transients. Fast (Sub-half cycle) change in
voltage. Often exceeding devices insulation
breakdown voltage rating. Caused by switch
contacts (arcing) or lightning
Voltage & Current
Phase Angle
Static or Dynamic Filters
Check circuit load capacity,
resize if needed. Adjust
transformer tapping
Rebalance distribution of loads
Replace switches, add transient
suppression devices
Power Factor Correction
Equipment
Causes or Conditions Measurements Solutions
I N P A R T N E R S H I P
W I T H
History of Power Quality
• Early power quality mainly concerned utilities, targeting T&D
• Electronics entered scope in 1930’s, adding complexity to power grid
• First power quality standards written in 1930’s by manufacturers
• 1980’s and 1990’s saw first revisions that consolidated standards, providing no manufacturer advantage, and taking measurement
technology into account
• In 2002, IEC61000-4-30 (I-E-C-six-one-thousand) was released, describing what to measure and for how long, in detail
• Additional standards have been created as backup, IEC61000-4-7 for harmonics and IEC61000-4-15 for flicker, for example
• IEEE519 and EN50160 are standards that govern allowable levels of power anomalies, using IEC61000 as a basis for measurement
• New and anticipated standards include high frequency harmonics (9kHz-130kHz) and Direct Current
101
I N P A R T N E R S H I P
W I T H
Power Quality Applications
• Frontline Troubleshooting
• How is this broken and how do I fix it?
• Load studies (Logging)
• How heavily is my system loaded? Can I add more loads? (EG: NEC 220.87 in USA)
• Long-Term Recording
• What is causing this intermittent problem?
• Quality of service studies
• Is the power from the utility in compliance with standards or contracts? (EG: EN50160 in Europe)
• Predictive Maintenance
• Is this system going to perform well over the long term?
• Energy optimization or Energy Studies
• How can I find out how much energy I’m using?
102
I N P A R T N E R S H I P
W I T H
Range of Power Quality Tools
Quantity
• Power (kW)
• Demand (kVA)
• Power Factor (PF)
Quality
• Harmonics
• Dips & Swells
• Transients
• Flicker
• Unbalance
• Mains Signaling
Fluke 1773
Fluke 1775
Fluke 1777
Fluke VR1710
Fluke 3540
Fluke 1732
Fluke 1734
Fluke 1736
Fluke 1738
Fluke 1742
Fluke 1746
Fluke 1748
Fluke
1760
Recorders
Troubleshooters
Loggers
Quantity
Quality
Quantity
Tool
Categories
Tool
Purpose
Norma 6000
Power Analysis
• Inverter Efficiency
• Transformer Performance
• Harmonics
• Torque and Speed Effect
Measures, Records and Triggers on Events/Standards Measures and Records
I N P A R T N E R S H I P
W I T H
Next Up: Conclusion- ROI & Savings
• Maintenance Practices: Which is Best?
• Trends in Industrial Maintenance
• Leading Technologies
• Thermal Imaging
• Vibration
• Power Quality
• Conclusion : ROI & Savings
9/7/2023 104
9/7/2023 104
9/7/2023 104
I N P A R T N E R S H I P
W I T H
Benefits of a functioning program
Studies by the Federal Energy Management Program (FEMP), estimate
that a properly functioning predictive maintenance program can provide
a savings of 30 % to 40 % over reactive maintenance.
Other independent surveys indicate that, on average, starting an
industrial predictive the following savings:
 Return on investment: 10 times
 Reduction in maintenance costs: 25 % to 30 %
 Elimination of breakdowns: 70 % to 75 %
 Reduction in downtime: 35 % to 45 %
 Increase in production: 20 % to 25 %
I N P A R T N E R S H I P
W I T H
Seminar Summary
• It’s best to take a blended approach to your maintenance program, utilizing reactive, preventive,
and predictive practices based on your unique business needs
• Best practices in maintenance can be a source of competitive advantage
• Thermography is easiest way to scan large areas for problems manifest by heat
• Vibration analysis delivers earliest indicators of common equipment failures
• Power Quality & Quantity Recording / Logging allows a customer to see who are the Energy hogs
in their facility and replace with higher efficiency loads to save way more than lighting. Between
65% and 75% of a building’s energy use is Electro-Mechanical –Motor loads.
9/7/2023 106
I N P A R T N E R S H I P
W I T H
Thank you for your time today!
Questions?
Use the question box to
the right, in your webinar
controls.
Email Katarina Ost:
katarina.ost@transcat.com
For related product information, go to:
www.transcat.com/brand/fluke-store

Predictive Maintenance Best Practices Presented by Fluke.pptx

  • 1.
    I N PA R T N E R S H I P W I T H Welcome to The Fluke Predictive Maintenance Webinar This webinar is being hosted on GoToWebinar, so there are just a few things to keep in mind: Triple check that you are muted! Limit your distractions and have fun! Ask lots of questions and share your thoughts! X 1 2 3
  • 2.
    I N PA R T N E R S H I P W I T H Today’s Agenda 24 years with Fluke • NYC & Philly Metro Markets • Sr Sales Engineer • Sales Applications Mgr. –Northeast U.S. 40 years in the Test Equipment industry • 12 years in Test Equipment Distribution • 4+ years in Mfg representation- • NAED Accreditation • Level 1 Thermographer • Level 1 Vibration Specialist • Power Quality SME • ISA Certified in Process Calibration Curt Geeting Sales Application Manager –Corporate Trainer Fluke Industrial Group -Northeast Bethlehem, PA
  • 3.
    Keep your worldup and running. ® September 2023 Predictive Maintenance Best Practices Proactive testing to reduce downtime and lost revenue I N P A R T N E R S H I P W I T H
  • 4.
    Keep your worldup and running. ® Leading Test Technologies to start a Predictive Maintenance program: Thermal Imaging Ultrasonic Imaging Vibration Analysis Energy Measurement Principles Power Quality Analyzers I N P A R T N E R S H I P W I T H
  • 5.
    I N PA R T N E R S H I P W I T H Today’s Agenda • Maintenance Practices: Which is Best? • Trends in Industrial Maintenance • Leading Technologies • Thermal Imaging • Vibration • Power Quality • Conclusion: ROI and Savings
  • 6.
    I N PA R T N E R S H I P W I T H Maintenance Practices: Which is Best? • Maintenance Practices: Which is Best? • Trends in Industrial Maintenance • Leading Technologies • Thermal Imaging • Vibration • Power Quality • Conclusion: ROI & Savings 9/7/2023 6 9/7/2023 6 9/7/2023 6
  • 7.
    I N PA R T N E R S H I P W I T H Before we begin Ask yourself… What is the cost of doing nothing in your plant or facility ? 9/7/2023 7
  • 8.
    I N PA R T N E R S H I P W I T H Case Study Date: Nov 2009 Industry: Pulp & Paper Fail Point: Motor Windings Impact: • $26K lost revenue from 6 hours of unplanned downtime • $3K from expedite charges • $4K from materials and overtime charges Total financial cost of this single event exceeded $33K. 9/7/2023 8 9/7/2023 8 Did you know…A 10% reduction in maintenance costs at one manufacturing plant had the same impact on the bottom line as a 40% increase in sales!
  • 9.
    I N PA R T N E R S H I P W I T H 9/7/2023 9 Reactive Maintenance Practices Reactive Maintenance: Often called “run to failure” No repair or maintenance actions are taken on machinery until the designed life span is reached…or other variables cause the machinery to fail. 9/7/2023 9 Pros Cons • Lower upfront maintenance costs • Lower maintenance staff costs • Unplanned, sometimes catastrophic, downtime and overtime hours • Secondary damage caused by failure • Risk of higher capital costs • Machines failures dictate • Maintenance staffing schedule
  • 10.
    I N PA R T N E R S H I P W I T H 9/7/2023 10 Preventive Maintenance: Often called “calendar-based maintenance”. Repairs or maintenance actions are taken on machinery on a scheduled basis, regardless of actual condition of equipment. 9/7/2023 10 Pros Cons • 50% of electrical failures can be prevented with regular maintenance and inspection • Increased equipment life • Reduced equipment failure • More predictable staffing schedule • Fault free machines are serviced unnecessarily • More labor intensive than reactive Reactive Maintenance Practices
  • 11.
    I N PA R T N E R S H I P W I T H 9/7/2023 11 Mean Time to Failure (MTTF) 9/7/2023 11 Break in or start-up Normal life Equipment worn out High probability of failure, due to manufacturing or installation problems Low probability of failure Degradation of machine parts, over time Time Number of failures
  • 12.
    I N PA R T N E R S H I P W I T H 9/7/2023 12 Predictive Maintenance (PdM) Practices Predictive Maintenance: Often called “condition-based maintenance”. Repairs or maintenance actions are taken based on changes in machine performance, monitored over time with various test equipment. 9/7/2023 12 Pros Cons • Equipment is serviced when needed • Most labor intensive testing • Lowest repair part and expedite costs • Increased investment in diagnostic / test equipment • Increased equipment life • Increased investment in staff training • Reduced equipment failure • Cost/benefit of routine monitoring not readily apparent to management
  • 13.
    I N PA R T N E R S H I P W I T H Spectrum of Maintenance Practices 9/7/2023 13 Reactive Preventive Predictive •Non-critical, low cost equipment •Run to fail •Mission Critical, high cost equipment •Anticipate equipment degradation • How is maintenance performed in your facility? • How often do breakdowns occur? • What do you do to keep breakdowns from recurring?
  • 14.
    I N PA R T N E R S H I P W I T H Which Practice is Best? 9/7/2023 14 Reactive Preventive Predictive BLENDED
  • 15.
    I N PA R T N E R S H I P W I T H Why use a blended approach? • Not All Equipment is Created Equal • Cost of machinery / equipment • Ease of replacement • Risk of interruption to business processes • Cost Benefit Tradeoffs • Balance costs of active programs with the benefits received • Cultural Fit • Not all organizational cultures are supportive of a full Preventive or PdM maintenance program • Attitudes toward maintenance are evolving 9/7/2023 15 Reactive Predictive Preventive
  • 16.
    I N PA R T N E R S H I P W I T H 16 Reactive : “run to failure” is a form of maintenance in which equipment and facilities are repaired only in response to a breakdown, fault or defect Preventive (PM): “calendar-based” care and servicing by personnel for the purpose of maintaining equipment and facilities in satisfactory operating condition by providing for systematic inspection, detection, and correction of incipient failures either before they occur or before they develop into major defects Predictive (PdM): “condition-based” techniques help determine the condition of in-service equipment in order to predict when maintenance should be performed. This approach offers cost savings over routine or time-based preventive maintenance, because tasks are performed only when warranted Time Normal Operation Wear Out Break In The Bathtub Curve Casualties Reactive Proactive Reliability Centered: “Asset Uptime based” a process to ensure that assets continue to do what their users require in their present operating context. Emphasizes the use of Predictive Maintenance (PdM) techniques in addition to traditional preventive measures. Vibration Testers Thermal Imagers Power Quality Balance / Alignment Ultrasound Oil Analysis Insulation Test
  • 17.
    I N PA R T N E R S H I P W I T H Next Up: Thermal Imaging 9/7/2023 22 9/7/2023 22 • Maintenance Practices: Which is Best? • Trends in Industrial Maintenance • Leading Technologies • Thermal Imaging • Vibration • Power Quality • Conclusion 9/7/2023 22
  • 18.
    I N PA R T N E R S H I P W I T H What is infrared? 9/7/2023 23
  • 19.
    I N PA R T N E R S H I P W I T H How can infrared help me? • Most electrical and mechanical defects cause increase in temperature • Thermal imaging provides a fast and clear picture of this temperature increase • Safety: Thermal images can be taken while production is running without any contact • Anybody can take a picture 9/7/2023 24
  • 20.
    I N PA R T N E R S H I P W I T H Understanding modes of heat transfer 9/7/2023 25
  • 21.
    I N PA R T N E R S H I P W I T H Thermal imaging considerations • Ensure adequate thermal gradients • Understand thermal capacitance • Account for wind effects • Avoid angular variations • Remember heat transfers from hot to cold • Be aware of your surroundings 9/7/2023 26
  • 22.
    I N PA R T N E R S H I P W I T H Thermal imaging considerations (cont’d) • Know when qualitative measurements are sufficient • Compare similar components under similar conditions • Understand present and future loading conditions • Inspect with highest load possible (at least 40%) 9/7/2023 27
  • 23.
    I N PA R T N E R S H I P W I T H Thermal imaging applications • Electrical • Mechanical • Process • Building Diagnostics 9/7/2023 28
  • 24.
    I N PA R T N E R S H I P W I T H Causes of electrical hot spots • Unbalanced loads • Harmonics (3rd harmonic current in Neutral) • Overloaded systems/excessive current • Loose or corroded connections increased resistance in the circuit • Insulation failure • Component failure • Wiring mistakes • Underspecified components 9/7/2023 29
  • 25.
    I N PA R T N E R S H I P W I T H 9/7/2023 30 Hot phase Fuse disconnect Substation Lighting Circuit Motor Control Center Buss
  • 26.
    I N PA R T N E R S H I P W I T H Inspection Frequency Equipment Type Frequency of Inspection High voltage substations 1 - 3 Years Transformers Annually 440V Motor Control Centers 6 - 12 Months (Air conditioned) Non-air conditioned or older 4 - 6 Months Electrical distribution Equipment 4 - 6 Months Large Motors * Annually Smaller motors 4 - 6 Months * Assumes vibration, MCA or lube is being also being used
  • 27.
    I N PA R T N E R S H I P W I T H Causes of mechanical hot spots • Bad cooling- due to reduced airflow • PQ problems like unbalance, overload or 5th harmonic (voltage) • Insulation problems with motor windings • Bearing problems – lubrication, wear, tolerance • Bad alignment 9/7/2023 32
  • 28.
    I N PA R T N E R S H I P W I T H 9/7/2023 33 Compressors - normal Hydraulic pumps Misaligned belt Small bearing issue Electric motor Roller bearings Coupling
  • 29.
    I N PA R T N E R S H I P W I T H Causes of process hot spots • Damaged structures caused by worn pipes • Abnormal heat flow/heat gradients • Defective valves/traps • Normal tank level fluctuations 9/7/2023 34
  • 30.
    I N PA R T N E R S H I P W I T H 9/7/2023 35 High temp cement kiln Observe weld cooling Tank Levels 1 1 9 . 3 0 2 . 1 5 0 2 0 0 2 5 0 3 0 0 Steam Traps Cement Kiln Pipe Integrity Chiller Operation
  • 31.
    I N PA R T N E R S H I P W I T H Causes of building diagnostic hot spots • Roof leaks • Air Leak • In-floor heating • Missing insulation 9/7/2023 36
  • 32.
    I N PA R T N E R S H I P W I T H 9/7/2023 37 Roof deck moisture In-floor heat verification Missing insulation Moisture Air Leak Attic access – air leak
  • 33.
    I N PA R T N E R S H I P W I T H How is the Image Created? Thousands of IR Temperature Measurements Each “Pixel” represents a temperature measurement
  • 34.
    I N PA R T N E R S H I P W I T H Spot Size & Resolution • Larger area for average temperature when further away. • Distance to spot ratio. • Zoom lens decreases spot size. 9/7/2023 39
  • 35.
    I N PA R T N E R S H I P W I T H Heat Capacity Thermal capacitance can help find the liquid level in a tank Also leaks in a flat roof, Sun heats roof and after Sun goes down dry insulation cools faster than higher heat capacity wet insulation
  • 36.
    I N PA R T N E R S H I P W I T H What is an IR Window? • Access point for inspection • Permanently installed • Can be retro-fitted Fluke Sales Meeting 2009 41
  • 37.
    I N PA R T N E R S H I P W I T H Easy to Use Transmission correction • On-imager adjustment for transmission loss • Accurate temperature readings even when using an IR-window
  • 38.
    I N PA R T N E R S H I P W I T H Ultrasonic Leak Detection – ii900 / ii910 Air/Gas Leak Detection in Manufacturing Facilities
  • 39.
    I N PA R T N E R S H I P W I T H Compressed air leaks are a recurrent and expensive problem that cost thousands of $ per year. • A typical plant that has not been well maintained leaks 20-30% of total compressed air production capacity • Example: 200 HP compressor operating 8760 hrs/yr @ $0.08/KWh costs almost $90K to operate annually, estimated $26K wasted energy cost annually • Proactive leak detection and repair can reduce leaks to less than 10% of compressor output. • Leaks cause a drop in system pressure, which can make air tools function less efficiently, adversely affecting production. • By forcing the equipment to cycle more frequently, leaks shorten the life of almost all system equipment (including the compressor package itself). • Finally, leaks can lead to adding unnecessary compressor capacity. Source: Best Practices for Compressed Air Systems BACKGROUND FACTS
  • 40.
    I N PA R T N E R S H I P W I T H Where compressed air and gas is used This Photo by Unknown Author is licensed under CC BY-SA Airbrush This Photo by Unknown Author is licensed under CC BY-SA Industrial robots Industrial compressors This Photo by Unknown Author is licensed under CC BY-SA Air operated valves This Photo by Unknown Author is licensed under CC BY-SA This Photo by Unknown Author is licensed under CC BY-SA
  • 41.
    I N PA R T N E R S H I P W I T H Value of Leak Detection Compressed air leaks an expensive problem. Detecting and repairing them is resource consuming • A single 1/8” leak in a compressed air line can cost $2,000 to $5,000 a year • Plants generally leak 20-30% of total compressed air capacity • Production quality can be adversely affected by fluctuating air pressure Source: U.S Department of Energy, Energy Efficiency and Renewable Energy : Energy Tips – Compressed Air (August 2004)
  • 42.
    I N PA R T N E R S H I P W I T H What is Acoustic Imaging?
  • 43.
    I N PA R T N E R S H I P W I T H Acoustic Imaging basics • A technique to create an image of an issue based on the sounds in the scene • The sound image is then overlaid onto a visible image
  • 44.
    I N PA R T N E R S H I P W I T H How the Sound Map™ is created How does imager know where to put sound on the image?
  • 45.
    I N PA R T N E R S H I P W I T H How the Sound Map™ is created • 64 microphones • Microphones receive sound in real time (frequency and db levels) • Proprietary algorithm calculates a sound image • Superimposes sound image on a visual image.
  • 46.
    I N PA R T N E R S H I P W I T H Time savings Scan point-by-point, listening for potential leaks, using a long- range sensor. Get close, swap ultrasonic sensors, confirm it is a leak, pinpoint leak source. Manually tag the leak and write down its location • Scan large areas at a glance • Take a picture that pinpoints the leak location • See multiple leaks on a single image • Save and tag leaks with info • Quantify leak severity – generate reports Acoustic Imaging 2 leaks in under 5 minutes • Trained inspector with educated ear listens to identify whether noise is from a leak • Requires experience, training and certifications • Involves point by point meticulous inspections • Manual tagging Traditional Ultrasonic methods 1 leak in 10 minutes Find leaks in a fraction of the time
  • 47.
    I N PA R T N E R S H I P W I T H Next Up: Vibration 9/7/2023 52 9/7/2023 52 9/7/2023 52 • Maintenance Practices: Which is Best? • Trends in Industrial Maintenance • Leading Technologies • Thermal Imaging • Vibration • Power Quality
  • 48.
    I N PA R T N E R S H I P W I T H What is mechanical vibration? • Vibration is the oscillation of a point, an object, or a part of an object around a fixed reference, or rest, position. • Some types of vibration are by design…most types are symptoms of other problems such as bearing condition, shaft misalignment, looseness or out-of- balance conditions. 9/7/2023 53
  • 49.
    I N PA R T N E R S H I P W I T H Early Indicators of Machine Health • In the world of mechanical maintenance, vibration remains one of the earliest indicators of a machine’s health. • With over half of unplanned downtime attributed to mechanical failures, why aren’t more companies investing in vibration analysis? Point where failure starts to occur Changes in Vibration P-F Interval 1-9 months Wear Debris in Oil P-F Interval 1-6 mos IR Thermography P-F Interval 3-12 wks Quantitative PM P-F Interval 5-8 wks Audible Noise P-F Interval 1-4 wks Heat By Touch P-F Interval 1-5 days F P P 1 P 2 P 3 P 4 P 5 P6 P = Potential Failure F = Failure The P-F Curve, Adapted from John Moubray’s book “Reliability Centered Maintenance II”
  • 50.
    I N PA R T N E R S H I P W I T H What problems does vibration cause? • Equipment failure • Unplanned downtime • Safety Concerns • Financial Loss 9/7/2023 55 Belt failure Electric motor failure Roller bearings failure Coupling Failure
  • 51.
    I N PA R T N E R S H I P W I T H Four common causes of vibration 9/7/2023 56 Bearing Failure Misalignment Unbalance Looseness 1. 2. 3. 4.
  • 52.
    I N PA R T N E R S H I P W I T H Sources of bearing failure • Heavier than anticipated loading • Inadequate or incorrect lubrication • Ineffective sealing • Shaft misalignment • Incorrect fit 9/7/2023 57 Bearing Failure Misalignment Unbalance Looseness Sources of Vibration
  • 53.
    I N PA R T N E R S H I P W I T H Types of misalignment 9/7/2023 58 Bearing Failure Misalignment Unbalance Looseness Sources of Vibration Angular – the centerline of the two shafts intersect but are not parallel. Parallel – the centerline of the two shafts are parallel but not concentric. Parallel and Angular (Common) – most misalignment is a combination of angular and parallel
  • 54.
    I N PA R T N E R S H I P W I T H Sources of misalignment • Poor assembly or shifting after assembly • Distortion due to pipe strain • Distortion due to torque combined with flexible support • Temperature induced growth of the machine structure • Poorly machined coupling • Inadequate coupling lubrication 9/7/2023 59 Bearing Failure Misalignment Unbalance Looseness Sources of Vibration
  • 55.
    I N PA R T N E R S H I P W I T H Sources of unbalance • Dirt accumulation or missing balance weights • Lack of homogeneity in materials, especially in castings (e.g. porous sections, blow-holes) • Difference in dimension of mating parts (e.g. shaft, bore…) • Roller deflection (e.g. paper mill rolls) or machining errors • Uneven mass distribution in electrical windings • Uneven corrosion, eccentric rotor or erosion of rotors 9/7/2023 60 Bearing Failure Misalignment Unbalance Looseness Sources of Vibration
  • 56.
    I N PA R T N E R S H I P W I T H Two types of looseness 9/7/2023 61 Bearing Failure Misalignment Unbalance Looseness Sources of Vibration Rotating – excessive clearance between rotating and stationary elements of the machine such as in a bearing. Non-Rotating – gaps between two normally stationary parts, such as a foot and a foundation, or a bearing housing and a machine.
  • 57.
    I N PA R T N E R S H I P W I T H Benefits of vibration testing • Vibration testing enables you to detect installation errors, component wear, and lubrication problems • Vibration provides the earliest indicator of machine condition • Vibration addresses all the moving parts of rotating equipment – and can identify root cause 9/7/2023 62
  • 58.
    I N PA R T N E R S H I P W I T H How does vibration testing work? • All rotating equipment generate a unique vibration signal or “signature” • These unique signals are usually captured in series through a transducer, with the signal’s amplitude (y-axis) depicted over time (x-axis). This is called a time waveform. • Proper interpretation of the time waveform enables diagnosis of a problem 9/7/2023 63
  • 59.
    I N PA R T N E R S H I P W I T H History of vibration testing • Technology was very difficult to use • Limited to vibration testing professionals • Equipment was cost prohibitive Few customers could realize the value that vibration offers 9/7/2023 64
  • 60.
    I N PA R T N E R S H I P W I T H Fluke 810 Vibration Tester 9/7/2023 65 Get Answers Now.
  • 61.
    I N PA R T N E R S H I P W I T H Fluke makes vibration testing easier • With the Fluke 810, vibration testing is within reach • It’s easy to use • It gives you answers when you need them • It includes everything you need to get started immediately • You will understand • Root cause of faults and fix it right the first time • Severity of failures and prioritize your repairs • Location of faults and focus your repair work • Minimal upfront investment…but the ROI is significant 9/7/2023 66
  • 62.
    I N PA R T N E R S H I P W I T H How does the Fluke 810 work? • Traditional vibration analysis takes a long-term view, where a baseline condition is established and a machine’s condition is compared over time to the original baseline. • Fluke 810 feeds the setup and measurement data into a set of powerful algorithms to identify a machine’s mechanical faults • Fluke 810 uses an innovative “synthetic baseline” to determine fault severity 9/7/2023 67 Diagnostic Engine marks abnormal peaks
  • 63.
    I N PA R T N E R S H I P W I T H Vibration testing in three simple steps 9/7/2023 68 Setup your unique machine configuration The 810 asks for basic machine information customers already know. Its onboard Info feature gives field tips for setting up and taking measurements like a pro Measure the machine conditions Use the transducer to measure vibration at key locations along your mechanical system. Diagnose the specific problems With the press of a button, the Fluke 810 identifies the root cause, its location, and how severe the problem is
  • 64.
    I N PA R T N E R S H I P W I T H Sample of machine setup fields • Machine Name: Pump 1 • AC Motor • No Variable Frequency Drive • RPM: 1800 (Minimum 200 RPM) • HP: 40 • Motor Mounting: Horizontal • Motor Bearing Type: Roller Bearing • Next Component: Flexible Coupling • Driven Component: Centrifugal Pump • Impeller is supported by: Two Bearings • Number of Vanes [optional]: 5 9/7/2023 69
  • 65.
    I N PA R T N E R S H I P W I T H Mounting Options Advantages: Highest frequency response, very repeatable data over time. Disadvantages: Less practical for “walk-around” troubleshooting due to time needed to screw/unscrew the Sensor from machinery, often difficult to tap a hole in the desired measurement location. Advantages: High frequency response approaching that of a stud mount without having to tap a hole, very repeatable data over time. Disadvantages: Less practical for “walkaround” troubleshooting due to time needed to screw/unscrew the Sensor from mounting pad. Advantages: Fastest, most convenient method for “walkaround” troubleshooting. Disadvantages: While typically adequate for troubleshooting, the magnetic mount does not have as high a frequency range as options that are more permanent. • Fluke 810 ships with a magnetic mount and 10 mounting pads with adhesive • Additional mounting pad packs are available as accessories
  • 66.
    I N PA R T N E R S H I P W I T H Understanding the diagnosis 9/7/2023 71 WHAT IS THE PROBLEM? WHERE IS THE PROBLEM? HOW BAD IS THE PROBLEM? The Fluke 810 Vibration Tester will provide you actionable answers NOW.
  • 67.
    I N PA R T N E R S H I P W I T H 810 Vibration Tester Features 9/7/2023 72 • On-board diagnosis and location of the four most common standard mechanical faults: bearings, looseness, misalignment, unbalance and other (nonstandard faults) • Fault severity scale with four severity levels: Slight, Moderate, Serious, and Extreme • Prioritized repair recommendations • Diagnostic details include cited peaks and vibration spectra • Context Sensitive Help • 2 GB expandable on-board memory • Data export (via USB connection) for more detailed Analysis • Laser tachometer for accurate machine running speed • 100 mV/g TEDS tri-axial accelerometer • Data storage and tracking with included VIEWER Software • Languages: English, French, German, Italian, Portuguese, Spanish, Japanese, Simplified Chinese
  • 68.
    I N PA R T N E R S H I P W I T H Viewer PC Software 9/7/2023 73 • Transfer machine data to and from the Tester • Export machine data for additional expert analysis • Create, edit, delete machine setups easily with the keyboard • Review full machine diagnosis, • View spectra in full detail • Modify application settings (e.g. language, date/time, units, sub units, etc. VIEWER Software enables the users to upload their machine data (machine setups and diagnostic data) to store, keep track and view in greater detail. Also users can use the PC to set up machinery fast and easy.
  • 69.
    I N PA R T N E R S H I P W I T H Viewer PC screen shot 9/7/2023 74 • Simple user interface, enabling quick access to the most important features •Easy access to diagnostic reports from prior tests •Integrated support for thermal images to reinforce findings
  • 70.
    I N PA R T N E R S H I P W I T H Machine Setup • Create and manage your machine setups in the Viewer software, then sync it up with the 810 Vibration Tester
  • 71.
    I N PA R T N E R S H I P W I T H Diagnosis Details – Spectra • Viewing the spectra is simple on the 810 • Export the data to the Viewer software and view spectra in greater detail
  • 72.
    I N PA R T N E R S H I P W I T H Everything you need – out of the box 9/7/2023 77 • Vibration Tester • Laser tachometer with pouch • Triaxial-TEDS accelerometer (sensor) • Quick disconnect cable • Sensor mounting pad kit with adhesive • USB cable • Viewer PC software • Shoulder and hand straps • Hard carrying case • Quick Reference Guide • Getting Started Guide • User Manual CD • FREE Product/Application Training DVD (available separately)
  • 73.
    I N PA R T N E R S H I P W I T H Cost of Downtime / Repair Cost (RTF) 1. Net income per hour of output for production line or other critical process $20,000/hr (critical & non-critical machine failures) 2. Calculate the average downtime (due to mechanical failures) for each equipment failure and number of events per year. 8 hrs down, 5 motors, 1x/yr 3. Multiply the results of step 1 by both values in step 2. ($20,000 * 8) * 5 = $800,000 4. Estimate labor (overtime) and equipment parts cost per downtime incident $30/hr * 8 hrs * 2 techs = $480 + $5000/motor = $5480 5. Add step 3 and step 4. This is the annual cost in lost revenue plus repair costs $805,480 (due to critical/non-critical failures) Fluke 810 Pays for Itself…And Then Some Cost of Program Implementation Cost 1. Cost of Fluke 810 $10,000 2. Average cost of dedicated, experienced vibration technician (FTE)(Assume 1 man hour/motor/month) $0 (Use existing technician resources – no incremental cost) 3. Average upfront equipment training costs + “maintenance training” $0 (Training DVD included – no incremental training costs) 4. Add steps 1 through step 3. This is the total first year cost of program startup $10,000 Vibration Testing Payback Cost 1. Assume 50% of unplanned downtime and repair costs savings $805,480 * 50% = $402,740 2. Return on Investment & Payback of Fluke 810 (total cost per year / total savings per year) $10,000 / $402,740 = 1 wk Fluke 810 makes vibration testing easy for maintenance teams – no additional training costs, software and support fees, fits into existing preventive maintenance routines
  • 74.
    I N PA R T N E R S H I P W I T H Fluke 810 Vibration Tester 9/7/2023 79 Visit www.fluke.com/machinehealth for more information
  • 75.
    I N PA R T N E R S H I P W I T H Next Up: Power Quality • Maintenance Practices: Which is Best? • Trends in Industrial Maintenance • Leading Technologies • Thermal Imaging • Vibration • Power Quality • Conclusion : ROI & Savings 9/7/2023 80 9/7/2023 80 9/7/2023 80
  • 76.
    I N PA R T N E R S H I P W I T H Energy Logging 81 Why is my Energy bill so high and where is this power being wasted ?
  • 77.
    I N PA R T N E R S H I P W I T H Beer Power Analogy and the Power Triangle
  • 78.
    I N PA R T N E R S H I P W I T H • What is it? • Rate at which AC energy is expended. Watts measure the energy required to do actual work, such as running a motor. • Customer Pain Point • Energy waste • Value to the Customer • Trending V, A, W over extended periods can expose potential waste and savings Quantity: Power, kW
  • 79.
    I N PA R T N E R S H I P W I T H • What is it? • Total voltage and current required from the utility, regardless of its efficiency or whether it does actual work. • Customer Pain Point • Need to reduce energy waste and find energy savings. • Value to the Customer • Energy Loss Calculator feature equates energy loss to dollars Quantity: Demand, kVA
  • 80.
    I N PA R T N E R S H I P W I T H • What is it? • When a circuit operates at 100% efficiency, demand = power. When power is less than demand, the difference, kW/kVA, is power factor. PF below 0.90 or 0.95 is inefficient (depending on supply) • Customer Pain Point • Inefficient power means paying more for energy. • Value to the Customer • PF is measured directly by PQ instruments, so the customer does not need to calculate manually and has quick snapshot (or trend) of the PF. Quantity: Power Factor, PF
  • 81.
    I N PA R T N E R S H I P W I T H Power, Demand or Consumption? 86 What to measure? You need to map your consumption • Compare against utility meter/bills • Evaluate peak demand and any power factor charges “The Speedometer Analogy” kW = speed (mph) kWh = distance (miles)
  • 82.
    I N PA R T N E R S H I P W I T H • Peak demand determines how big the “electricity pipe” must be to deliver the power needed for the facility • Peak demand is the highest of consecutively-measured, 15-minute average kW readings (technique may vary by supplier) • For some larger consumers utilities include a demand charge to cover the cost of investing in the required equipment to deliver the power Peak Demand - the most expensive power 87 Continuous kW 15-minute Average kW 15min 15min 15min 15min
  • 83.
    I N PA R T N E R S H I P W I T H Quantity: The Utility Bill Maximum demand charges Fixed demand charges Utility energy consumption charges are broken into • Active (or true) power (kW) delivered by the utility • Variances due to Power Factor • Variances due to market demand Understand what to measure. Energy consumption is the accumulation of power over time expressed in kilo watt hours (kWh)
  • 84.
    I N PA R T N E R S H I P W I T H 220.87 Determining Existing Loads. The calculation of a feeder or service load for existing installations shall be permitted to use actual maximum demand to determine the existing load under all of the following conditions: (1)The maximum demand data is available for a 1-year period. Exception: If the maximum demand data for a 1-year period is not available, the calculated load shall be permitted to be based on the maximum demand (measure of average power demand over a 15- minute period) continuously recorded over a minimum 30-day period using a recording ammeter or power meter connected to the highest loaded phase of the feeder or service, based on the initial loading at the start of the recording. The recording shall reflect the maximum demand of the feeder or service by being taken when the building or space is occupied and shall include by measurement or calculation the larger of the heating or cooling equipment load, and other loads that may be periodic in nature due to seasonal or similar conditions. (2) The maximum demand at 125 percent plus the new load does not exceed the ampacity of the feeder or rating of the service. (3) The feeder has overcurrent protection in accordance with 240.4, and the service has overload protection in accordance with 230.90. NFPA 70E NEC Code 220 89
  • 85.
    I N PA R T N E R S H I P W I T H Electric Utility, IT/Computers HVAC, Motors & Drives Lighting, Compressed Air, Steam Systems Building Envelope Fluke tools identify equipment inefficiency and behavioral process waste. Industrial Facilities Energy Efficiency
  • 86.
    I N PA R T N E R S H I P W I T H Loads: Lighting, computers etc. Main Service Entrance Load #1 50 kVA Load #2 100 kVA Motor #1 Sub- panel #1.1 Sub- panel #1.2 480 V panel Motor #2 Starter Disconnect Disconnect Transformer Disconnect Capacitor How Should You Measure Energy Consumption? 91 Measure your energy consumption by at each point for roughly one week and know your operation limits.
  • 87.
    I N PA R T N E R S H I P W I T H Common Causes of Energy Waste Energy Study, Power Trend PQ Health. Harmonics, Power Factor & Unbalance Energy Study, Power Trend with Motor State Human and Process Inefficiencies. “The lights are on, but no one is home”, “The machines are running but nothing is being produced” Operating loads exceed utility peak demand rate Poor Power Quality Worn or faulty loads. Compressor air leaks, worn pump impellers or constricted orifices, clogged air filters Energy Study, Consumption Calendar Level load process or move to off peak hours Eliminate source of power quality issues Correlate motor excessive on/off cycle to energy consumption profile. Check load amperage to name plate rating Install automatic switches and timers Causes or Conditions Measurements Solutions
  • 88.
    I N PA R T N E R S H I P W I T H Power Quality Components 93 Why is equipment not working in my facility ?
  • 89.
    I N PA R T N E R S H I P W I T H • What is it? • Multiples of the supply frequency, i.e. the fifth harmonic would be 250 Hz if the supply frequency is 50 Hz. Caused by non-linear power electronic loads. • Customer Pain Point • Unusable power, drawn from utility but not converted to actual work • Failures in neutral conductors • Motors and transformers run hot, decreasing efficiency and shortening lifespan • Reduced transformer efficiency — or, a larger unit is required to accommodate harmonics • Value to the Customer • Pinpoint the source of harmonics by using 1736/38, 177x series, and 1760. Quality: Harmonics
  • 90.
    I N PA R T N E R S H I P W I T H • What is it? • The line voltage is higher or lower than the nominal voltage for a shorter period. Caused by e.g. network faults, switching of capacitive loads, and excessive loading. • Customer Pain Point • Intermittent loss of power • Potentially damage equipment • Value to the Customer • Count the number of dips and swells in a system in order to locate which piece of a system is causing issues. Quality: Dips & Swells
  • 91.
    I N PA R T N E R S H I P W I T H • What is it? • Rapid change in the sine wave that occurs in both voltage and current waveforms. Caused by switching devices, start- and stop of high power equipment. • Customer Pain Point • Breaker trips and leads to downtime • Damaged equipment • Value to the Customer • Avoid downtime and damaged equipment due to transients by providing capture of transients. Quality: Transients
  • 92.
    I N PA R T N E R S H I P W I T H • Requires high pass filter to remove fundamental signal • High sampling rates are important for accurate measurements • Typical loggers sample at 10.24 kHz • Fluke 177X Series capture transients at 1 MHz and 20 MHz Quality: Transients 97 3.8 kHz Sampling 865 volts 30 kHz Sampling 866 volts 5 MHz Sampling 2,800 volts
  • 93.
    I N PA R T N E R S H I P W I T H • What is it? • Different line voltages or currents. Caused by single-phase loads, phase to phase loads and unbalanced three-phase loads like welding equipment. • Customer Pain Point • Voltage unbalance causes stress on 3-phase loads, leading to inefficient consumption and eventual device failure. • Unbalance can also cause intermittent circuit breaker issues. • Value to the Customer • Avoid nuisance tripping and overheating of equipment. Fluke meters provide the unbalance percentage, so the customer does not need to make the calculations. Quality: Unbalance
  • 94.
    I N PA R T N E R S H I P W I T H • What is it? • Visible change in brightness of a lamp due to rapid fluctuations in voltage of the power supply as defined in IEC 61000-4-15. Can be caused by electric arc furnaces, large motors (when starting), welders, boilers, etc. • Customer Pain Point • Nuisance tripping due to mis-operation of relays and contactors • Unwanted triggering of UPS units to switch to battery mode • Problems with some sensitive electronic equipment, which require constant voltage (i.e. medical laboratories) • Value to the Customer • Avoid nuisance tripping and find what equipment is causing flicker issues. Events capture allows for engineer to step away from measurement and do other work while the instrument provides a tally count of any flicker events. Quality: Flicker
  • 95.
    I N PA R T N E R S H I P W I T H Causes of Poor Power Quality Harmonics Dips & Swells Unbalance Transients Inductive & Capacitive Loads. An oven element is pure resistive. Whereas motors, ballasts, and most electronic devices are inductive or capacitive Non-Linear Loads. Operating loads whose demand for energy rapidly changes, sub-cycle fast changes High energy loads turning on or off causing variation in voltage. Loads improperly distributed across each phase Transients. Fast (Sub-half cycle) change in voltage. Often exceeding devices insulation breakdown voltage rating. Caused by switch contacts (arcing) or lightning Voltage & Current Phase Angle Static or Dynamic Filters Check circuit load capacity, resize if needed. Adjust transformer tapping Rebalance distribution of loads Replace switches, add transient suppression devices Power Factor Correction Equipment Causes or Conditions Measurements Solutions
  • 96.
    I N PA R T N E R S H I P W I T H History of Power Quality • Early power quality mainly concerned utilities, targeting T&D • Electronics entered scope in 1930’s, adding complexity to power grid • First power quality standards written in 1930’s by manufacturers • 1980’s and 1990’s saw first revisions that consolidated standards, providing no manufacturer advantage, and taking measurement technology into account • In 2002, IEC61000-4-30 (I-E-C-six-one-thousand) was released, describing what to measure and for how long, in detail • Additional standards have been created as backup, IEC61000-4-7 for harmonics and IEC61000-4-15 for flicker, for example • IEEE519 and EN50160 are standards that govern allowable levels of power anomalies, using IEC61000 as a basis for measurement • New and anticipated standards include high frequency harmonics (9kHz-130kHz) and Direct Current 101
  • 97.
    I N PA R T N E R S H I P W I T H Power Quality Applications • Frontline Troubleshooting • How is this broken and how do I fix it? • Load studies (Logging) • How heavily is my system loaded? Can I add more loads? (EG: NEC 220.87 in USA) • Long-Term Recording • What is causing this intermittent problem? • Quality of service studies • Is the power from the utility in compliance with standards or contracts? (EG: EN50160 in Europe) • Predictive Maintenance • Is this system going to perform well over the long term? • Energy optimization or Energy Studies • How can I find out how much energy I’m using? 102
  • 98.
    I N PA R T N E R S H I P W I T H Range of Power Quality Tools Quantity • Power (kW) • Demand (kVA) • Power Factor (PF) Quality • Harmonics • Dips & Swells • Transients • Flicker • Unbalance • Mains Signaling Fluke 1773 Fluke 1775 Fluke 1777 Fluke VR1710 Fluke 3540 Fluke 1732 Fluke 1734 Fluke 1736 Fluke 1738 Fluke 1742 Fluke 1746 Fluke 1748 Fluke 1760 Recorders Troubleshooters Loggers Quantity Quality Quantity Tool Categories Tool Purpose Norma 6000 Power Analysis • Inverter Efficiency • Transformer Performance • Harmonics • Torque and Speed Effect Measures, Records and Triggers on Events/Standards Measures and Records
  • 99.
    I N PA R T N E R S H I P W I T H Next Up: Conclusion- ROI & Savings • Maintenance Practices: Which is Best? • Trends in Industrial Maintenance • Leading Technologies • Thermal Imaging • Vibration • Power Quality • Conclusion : ROI & Savings 9/7/2023 104 9/7/2023 104 9/7/2023 104
  • 100.
    I N PA R T N E R S H I P W I T H Benefits of a functioning program Studies by the Federal Energy Management Program (FEMP), estimate that a properly functioning predictive maintenance program can provide a savings of 30 % to 40 % over reactive maintenance. Other independent surveys indicate that, on average, starting an industrial predictive the following savings:  Return on investment: 10 times  Reduction in maintenance costs: 25 % to 30 %  Elimination of breakdowns: 70 % to 75 %  Reduction in downtime: 35 % to 45 %  Increase in production: 20 % to 25 %
  • 101.
    I N PA R T N E R S H I P W I T H Seminar Summary • It’s best to take a blended approach to your maintenance program, utilizing reactive, preventive, and predictive practices based on your unique business needs • Best practices in maintenance can be a source of competitive advantage • Thermography is easiest way to scan large areas for problems manifest by heat • Vibration analysis delivers earliest indicators of common equipment failures • Power Quality & Quantity Recording / Logging allows a customer to see who are the Energy hogs in their facility and replace with higher efficiency loads to save way more than lighting. Between 65% and 75% of a building’s energy use is Electro-Mechanical –Motor loads. 9/7/2023 106
  • 102.
    I N PA R T N E R S H I P W I T H Thank you for your time today! Questions? Use the question box to the right, in your webinar controls. Email Katarina Ost: katarina.ost@transcat.com For related product information, go to: www.transcat.com/brand/fluke-store