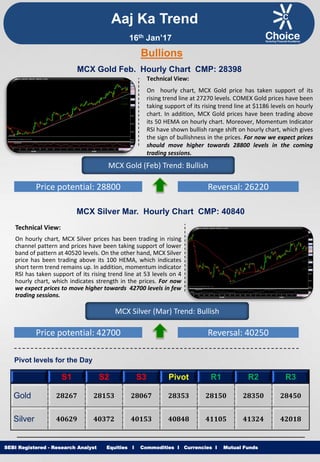
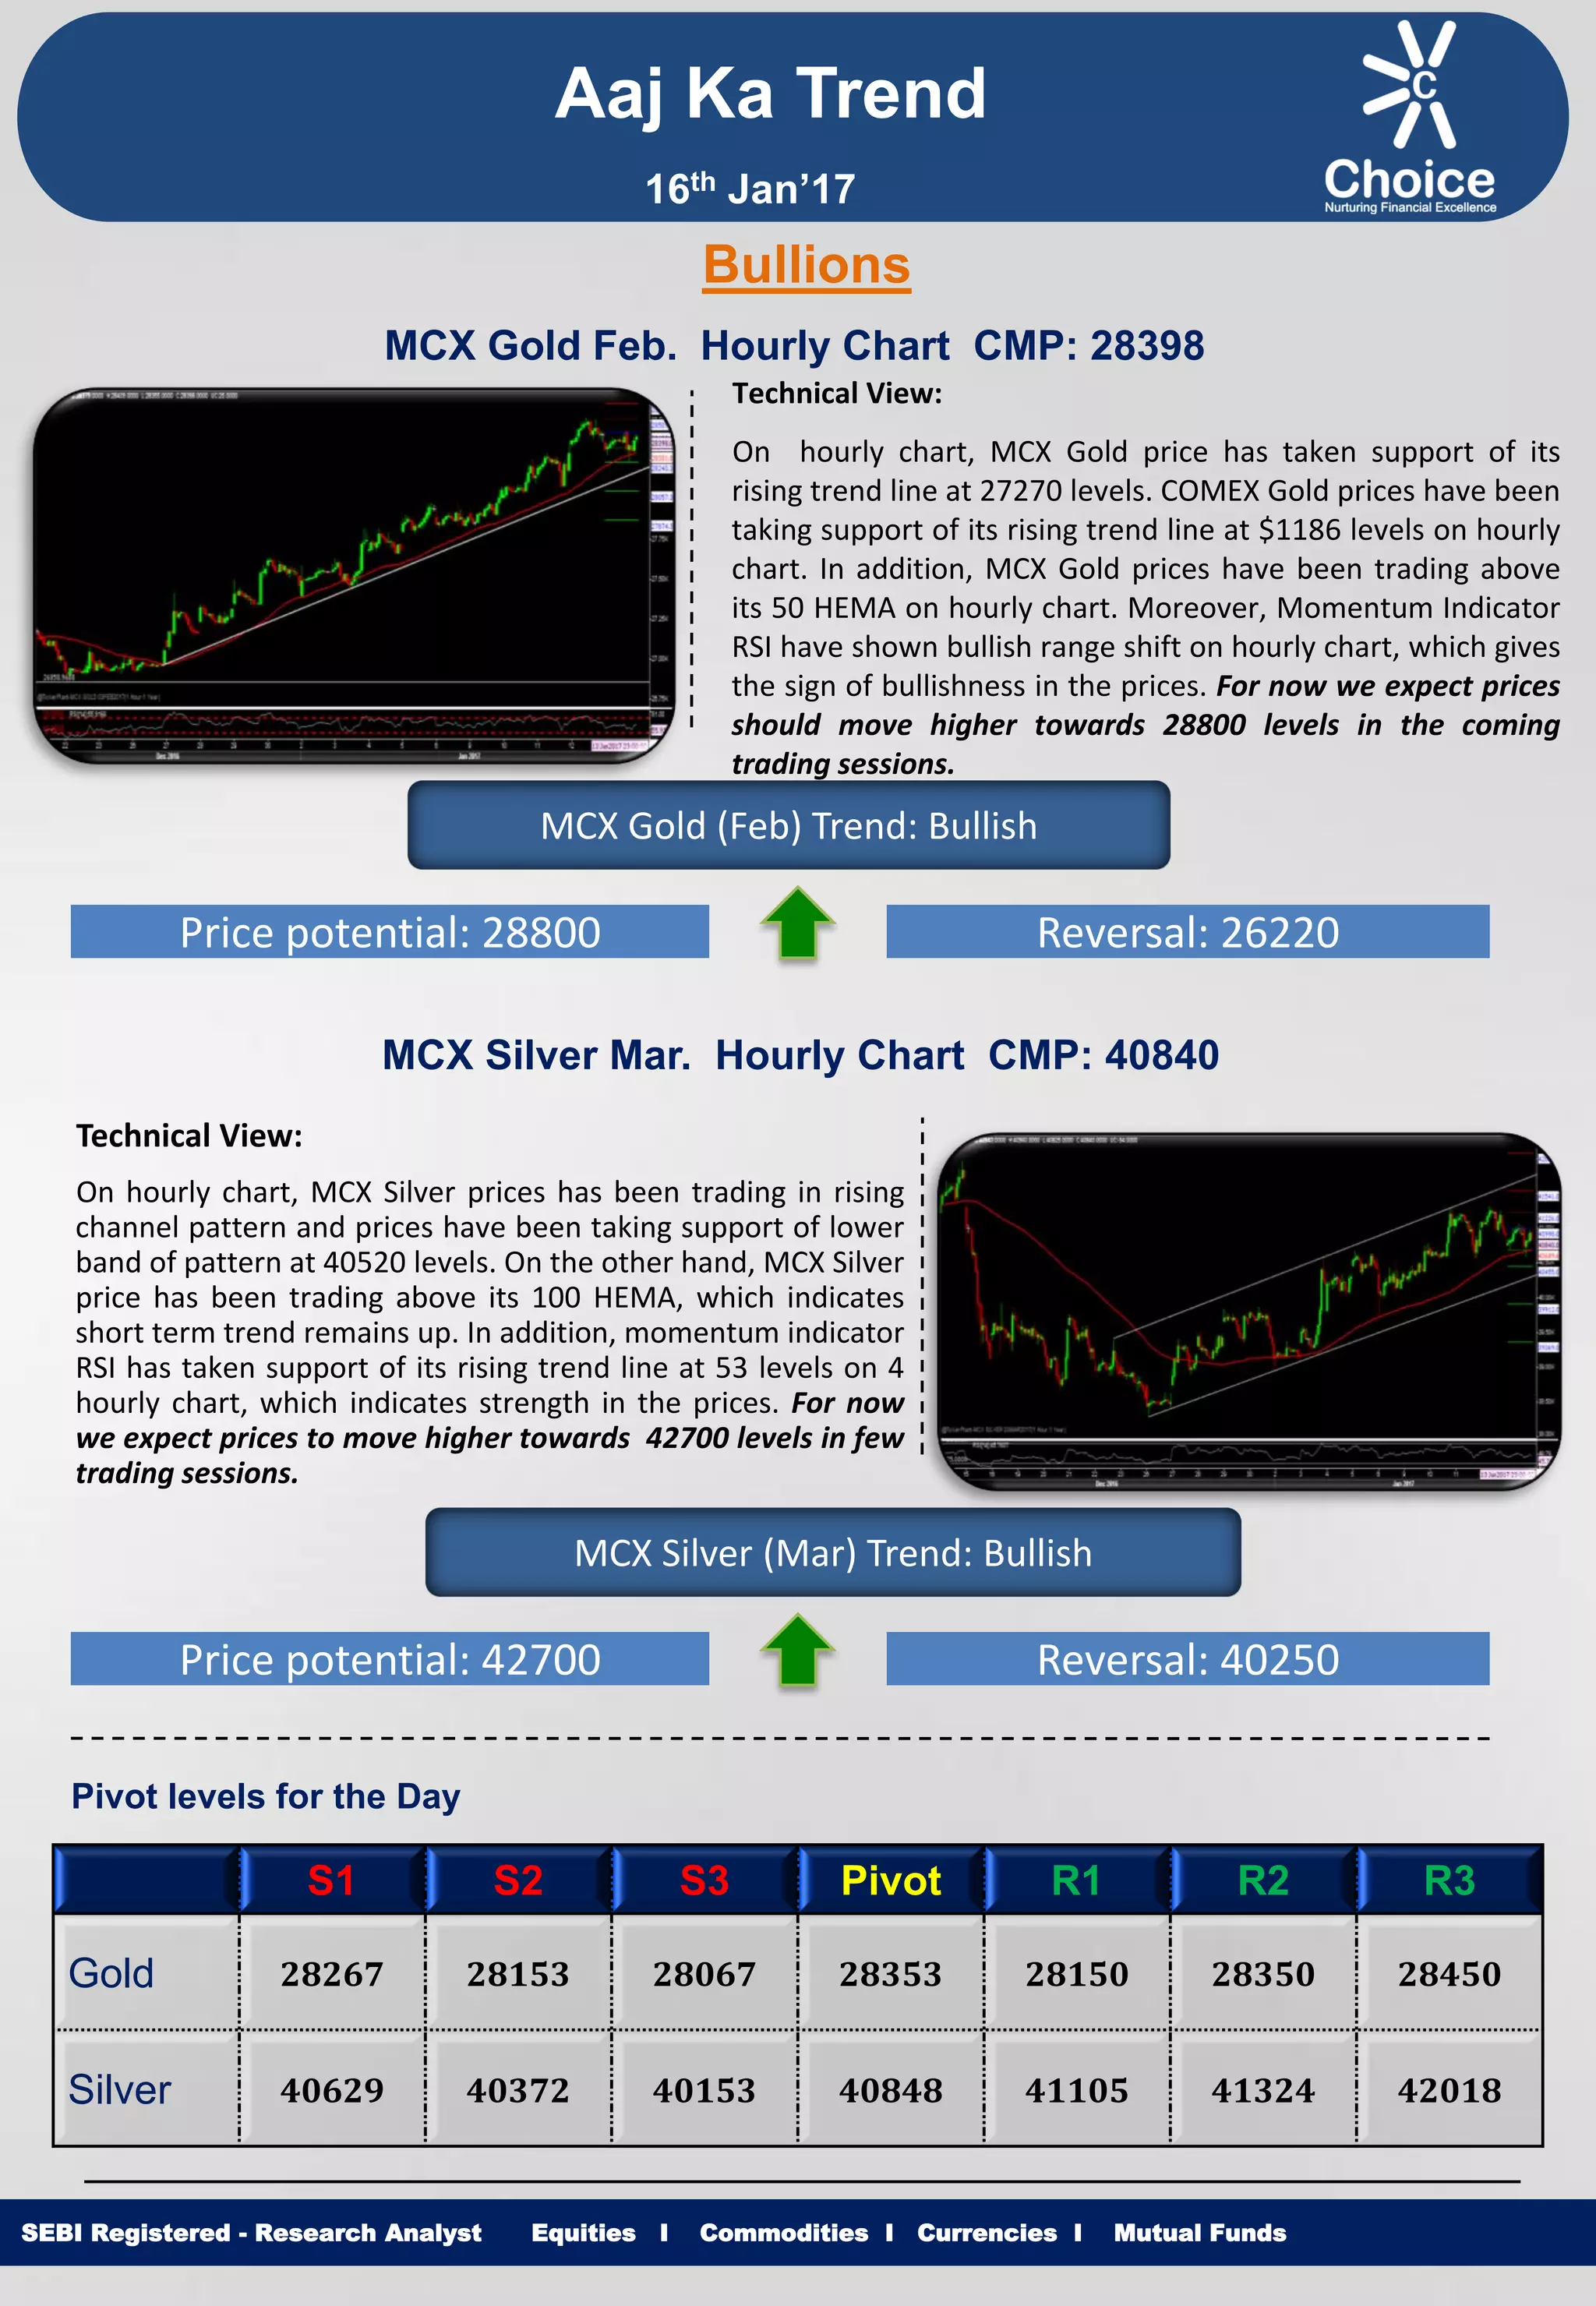
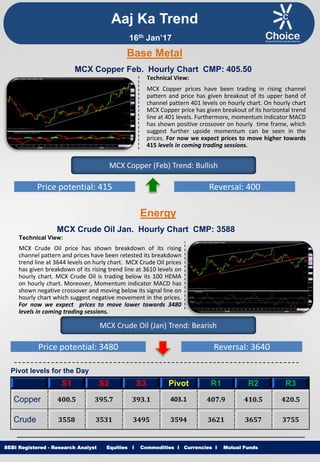
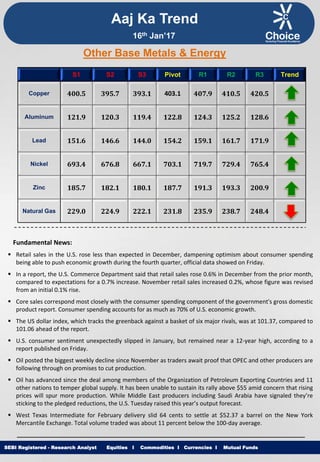
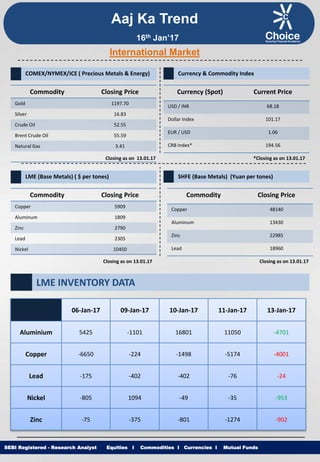
Equities I Commodities I Currencies I Mutual Funds
Aaj Ka Trend
Technical View:
On hourly chart, MCX Gold price has taken support of its
rising trend line at 27270 levels. COMEX Gold prices have been
taking support of its rising trend line at $1186 levels on hourly
chart. In addition, MCX Gold prices have been trading above
its 50 HEMA on hourly chart. Moreover, Momentum Indicator
RSI have shown bullish range shift on hourly chart, which gives
the sign of bullishness in the prices. For now we expect prices
should move higher towards 28800 levels in the coming
trading sessions.
SEBI Registered - Research Analyst Equities I Commodities I Currencies I Mutual Funds
Bullions
MCX Gold Feb. Hourly Chart CMP: 28398
MCX Gold (Feb) Trend: Bullish
Price potential: 28800 Reversal: 26220
MCX Silver Mar. Hourly Chart CMP: 40840
Technical View:
On hourly chart, MCX Silver prices has been trading in rising
channel pattern and prices have been taking support of lower
band of pattern at 40520 levels. On the other hand, MCX Silver
price has been trading above its 100 HEMA, which indicates
short term trend remains up. In addition, momentum indicator
RSI has taken support of its rising trend line at 53 levels on 4
hourly chart, which indicates strength in the prices. For now
we expect prices to move higher towards 42700 levels in few
trading sessions.
MCX Silver (Mar) Trend: Bullish
Price potential: 42700 Reversal: 40250
Pivot levels for the Day
S1 S2 S3 Pivot R1 R2 R3
Gold 28267 28153 28067 28353 28150 28350 28450
Silver 40629 40372 40153 40848 41105 41324 42018
16th Jan’17
Equities I Commodities I Currencies I Mutual Funds
Technical View:
MCX Copper prices have been trading in rising channel
pattern and price has given breakout of its upper band of
channel pattern 401 levels on hourly chart. On hourly chart
MCX Copper price has given breakout of its horizontal trend
line at 401 levels. Furthermore, momentum indicator MACD
has shown positive crossover on hourly time frame, which
suggest further upside momentum can be seen in the
prices. For now we expect prices to move higher towards
415 levels in coming trading sessions.
SEBI Registered - Research Analyst Equities I Commodities I Currencies I Mutual Funds
MCX Copper Feb. Hourly Chart CMP: 405.50
MCX Copper (Feb) Trend: Bullish
Price potential: 415 Reversal: 400
MCX Crude Oil Jan. Hourly Chart CMP: 3588
Technical View:
MCX Crude Oil price has shown breakdown of its rising
channel pattern and prices have been retested its breakdown
trend line at 3644 levels on hurly chart. MCX Crude Oil prices
has given breakdown of its rising trend line at 3610 levels on
hourly chart. MCX Crude Oil is trading below its 100 HEMA
on hourly chart. Moreover, Momentum indicator MACD has
shown negative crossover and moving below its signal line on
hourly chart which suggest negative movement in the prices.
For now we expect prices to move lower towards 3480
levels in coming trading sessions.
MCX Crude Oil (Jan) Trend: Bearish
Price potential: 3480 Reversal: 3640
Pivot levels for the Day
S1 S2 S3 Pivot R1 R2 R3
Copper 400.5 395.7 393.1 403.1 407.9 410.5 420.5
Crude 3558 3531 3495 3594 3621 3657 3755
Base Metal
Energy
Aaj Ka Trend
16th Jan’17
Equities I Commodities I Currencies I Mutual FundsSEBI Registered - Research Analyst Equities I Commodities I Currencies I Mutual Funds
Other Base Metals & Energy
S1 S2 S3 Pivot R1 R2 R3 Trend
Copper 400.5 395.7 393.1 403.1 407.9 410.5 420.5
Aluminum 121.9 120.3 119.4 122.8 124.3 125.2 128.6
Lead 151.6 146.6 144.0 154.2 159.1 161.7 171.9
Nickel 693.4 676.8 667.1 703.1 719.7 729.4 765.4
Zinc 185.7 182.1 180.1 187.7 191.3 193.3 200.9
Natural Gas 229.0 224.9 222.1 231.8 235.9 238.7 248.4
Fundamental News:
 Retail sales in the U.S. rose less than expected in December, dampening optimism about consumer spending
being able to push economic growth during the fourth quarter, official data showed on Friday.
 In a report, the U.S. Commerce Department said that retail sales rose 0.6% in December from the prior month,
compared to expectations for a 0.7% increase. November retail sales increased 0.2%, whose figure was revised
from an initial 0.1% rise.
 Core sales correspond most closely with the consumer spending component of the government's gross domestic
product report. Consumer spending accounts for as much as 70% of U.S. economic growth.
 The US dollar index, which tracks the greenback against a basket of six major rivals, was at 101.37, compared to
101.06 ahead of the report.
 U.S. consumer sentiment unexpectedly slipped in January, but remained near a 12-year high, according to a
report published on Friday.
 Oil posted the biggest weekly decline since November as traders await proof that OPEC and other producers are
following through on promises to cut production.
 Oil has advanced since the deal among members of the Organization of Petroleum Exporting Countries and 11
other nations to temper global supply. It has been unable to sustain its rally above $55 amid concern that rising
prices will spur more production. While Middle East producers including Saudi Arabia have signaled they’re
sticking to the pledged reductions, the U.S. Tuesday raised this year’s output forecast.
 West Texas Intermediate for February delivery slid 64 cents to settle at $52.37 a barrel on the New York
Mercantile Exchange. Total volume traded was about 11 percent below the 100-day average.
Aaj Ka Trend
16th Jan’17
Equities I Commodities I Currencies I Mutual FundsSEBI Registered - Research Analyst Equities I Commodities I Currencies I Mutual Funds
International Market
Commodity Closing Price
Gold 1197.70
Silver 16.83
Crude Oil 52.55
Brent Crude Oil 55.59
Natural Gas 3.41
COMEX/NYMEX/ICE ( Precious Metals & Energy) Currency & Commodity Index
Currency (Spot) Current Price
USD / INR 68.18
Dollar Index 101.17
EUR / USD 1.06
CRB Index* 194.56
Closing as on 13.01.17 *Closing as on 13.01.17
LME (Base Metals) ( $ per tones)
Commodity Closing Price
Copper 5909
Aluminum 1809
Zinc 2790
Lead 2305
Nickel 10450
SHFE (Base Metals) (Yuan per tones)
Commodity Closing Price
Copper 48140
Aluminum 13430
Zinc 22985
Lead 18960
Closing as on 13.01.17 Closing as on 13.01.17
LME INVENTORY DATA
Aaj Ka Trend
06-Jan-17 09-Jan-17 10-Jan-17 11-Jan-17 13-Jan-17
Aluminium 5425 -1101 16801 11050 -4701
Copper -6650 -224 -1498 -5174 -4001
Lead -175 -402 -402 -76 -24
Nickel -805 1094 -49 -35 -953
Zinc -75 -375 -801 -1274 -902
16th Jan’17
Equities I Commodities I Currencies I Mutual Funds
This is solely for information of clients of Choice Broking and does not construe to be an investment advice. It is also not intended as an offer or solicitation
for the purchase and sale of any financial instruments. Any action taken by you on the basis of the information contained herein is your responsibility alone
and Choice Broking its subsidiaries or its employees or associates will not be liable in any manner for the consequences of such action taken by you. We
have exercised due diligence in checking the correctness and authenticity of the information contained in this recommendation, but Choice Broking or any of
its subsidiaries or associates or employees shall not be in any way responsible for any loss or damage that may arise to any person from any inadvertent
error in the information contained in this recommendation or any action taken on basis of this information. Technical analysis studies market psychology,
price patterns and volume levels. It is used to forecast future price and market movements. Technical analysis is complementary to fundamental analysis
and news sources. The recommendations issued herewith might be contrary to recommendations issued by Choice Broking in the company research
undertaken as the recommendations stated in this report is derived purely from technical analysis. Choice Broking has based this document on information
obtained from sources it believes to be reliable but which it has not independently verified; Choice Broking makes no guarantee, representation or warranty
and accepts no responsibility or liability as to its accuracy or completeness. The opinions contained within the report are based upon publicly available
information at the time of publication and are subject to change without notice. The information and any disclosures provided herein are in summary form
and have been prepared for informational purposes. The recommendations and suggested price levels are intended purely for trading purposes. The
recommendations are valid for the day of the report however trading trends and volumes might vary substantially on an intraday basis and the
recommendations may be subject to change. The information and any disclosures provided herein may be considered confidential. Any use, distribution,
modification, copying, forwarding or disclosure by any person is strictly prohibited. The information and any disclosures provided herein do not constitute a
solicitation or offer to purchase or sell any security or other financial product or instrument. The current performance may be unaudited. Past performance
does not guarantee future returns. There can be no assurance that investments will achieve any targeted rates of return, and there is no guarantee against
the loss of your entire investment.
POTENTIAL CONFLICT OF INTEREST DISCLOSURE (as on date of report) Disclosure of interest statement – • Analyst interest of the stock
/Instrument(s): - No. • Firm interest of the stock / Instrument (s): - No.
Disclaimer
Contact Us
Amit Pathania
Research Associate
amit.pathania@choiceindia.com
www.choicebroking.incustomercare@choiceindia.com
SEBI Registered - Research Analyst Equities I Commodities I Currencies I Mutual Funds
Aaj Ka Trend
16th Jan’17
Neeraj Yadav
Research Advisor
neeraj.yadav@choiceindia.com
Anish Vyas
Senior Research Associate
anish.vyas@choiceindia.com
Amit Pathania
Digitally signed by Amit Pathania
DN: cn=Amit Pathania, o=Choice Equity Broking Pvt. ltd,
ou=Research Department, email=amit.pathania@choiceindia.com,
c=IN
Date: 2017.01.14 15:21:24 +05'30'

Aaj ka trend 16.01.17

  • 1.
    Equities I CommoditiesI Currencies I Mutual Funds Aaj Ka Trend Technical View: On hourly chart, MCX Gold price has taken support of its rising trend line at 27270 levels. COMEX Gold prices have been taking support of its rising trend line at $1186 levels on hourly chart. In addition, MCX Gold prices have been trading above its 50 HEMA on hourly chart. Moreover, Momentum Indicator RSI have shown bullish range shift on hourly chart, which gives the sign of bullishness in the prices. For now we expect prices should move higher towards 28800 levels in the coming trading sessions. SEBI Registered - Research Analyst Equities I Commodities I Currencies I Mutual Funds Bullions MCX Gold Feb. Hourly Chart CMP: 28398 MCX Gold (Feb) Trend: Bullish Price potential: 28800 Reversal: 26220 MCX Silver Mar. Hourly Chart CMP: 40840 Technical View: On hourly chart, MCX Silver prices has been trading in rising channel pattern and prices have been taking support of lower band of pattern at 40520 levels. On the other hand, MCX Silver price has been trading above its 100 HEMA, which indicates short term trend remains up. In addition, momentum indicator RSI has taken support of its rising trend line at 53 levels on 4 hourly chart, which indicates strength in the prices. For now we expect prices to move higher towards 42700 levels in few trading sessions. MCX Silver (Mar) Trend: Bullish Price potential: 42700 Reversal: 40250 Pivot levels for the Day S1 S2 S3 Pivot R1 R2 R3 Gold 28267 28153 28067 28353 28150 28350 28450 Silver 40629 40372 40153 40848 41105 41324 42018 16th Jan’17
  • 2.
    Equities I CommoditiesI Currencies I Mutual Funds Technical View: MCX Copper prices have been trading in rising channel pattern and price has given breakout of its upper band of channel pattern 401 levels on hourly chart. On hourly chart MCX Copper price has given breakout of its horizontal trend line at 401 levels. Furthermore, momentum indicator MACD has shown positive crossover on hourly time frame, which suggest further upside momentum can be seen in the prices. For now we expect prices to move higher towards 415 levels in coming trading sessions. SEBI Registered - Research Analyst Equities I Commodities I Currencies I Mutual Funds MCX Copper Feb. Hourly Chart CMP: 405.50 MCX Copper (Feb) Trend: Bullish Price potential: 415 Reversal: 400 MCX Crude Oil Jan. Hourly Chart CMP: 3588 Technical View: MCX Crude Oil price has shown breakdown of its rising channel pattern and prices have been retested its breakdown trend line at 3644 levels on hurly chart. MCX Crude Oil prices has given breakdown of its rising trend line at 3610 levels on hourly chart. MCX Crude Oil is trading below its 100 HEMA on hourly chart. Moreover, Momentum indicator MACD has shown negative crossover and moving below its signal line on hourly chart which suggest negative movement in the prices. For now we expect prices to move lower towards 3480 levels in coming trading sessions. MCX Crude Oil (Jan) Trend: Bearish Price potential: 3480 Reversal: 3640 Pivot levels for the Day S1 S2 S3 Pivot R1 R2 R3 Copper 400.5 395.7 393.1 403.1 407.9 410.5 420.5 Crude 3558 3531 3495 3594 3621 3657 3755 Base Metal Energy Aaj Ka Trend 16th Jan’17
  • 3.
    Equities I CommoditiesI Currencies I Mutual FundsSEBI Registered - Research Analyst Equities I Commodities I Currencies I Mutual Funds Other Base Metals & Energy S1 S2 S3 Pivot R1 R2 R3 Trend Copper 400.5 395.7 393.1 403.1 407.9 410.5 420.5 Aluminum 121.9 120.3 119.4 122.8 124.3 125.2 128.6 Lead 151.6 146.6 144.0 154.2 159.1 161.7 171.9 Nickel 693.4 676.8 667.1 703.1 719.7 729.4 765.4 Zinc 185.7 182.1 180.1 187.7 191.3 193.3 200.9 Natural Gas 229.0 224.9 222.1 231.8 235.9 238.7 248.4 Fundamental News:  Retail sales in the U.S. rose less than expected in December, dampening optimism about consumer spending being able to push economic growth during the fourth quarter, official data showed on Friday.  In a report, the U.S. Commerce Department said that retail sales rose 0.6% in December from the prior month, compared to expectations for a 0.7% increase. November retail sales increased 0.2%, whose figure was revised from an initial 0.1% rise.  Core sales correspond most closely with the consumer spending component of the government's gross domestic product report. Consumer spending accounts for as much as 70% of U.S. economic growth.  The US dollar index, which tracks the greenback against a basket of six major rivals, was at 101.37, compared to 101.06 ahead of the report.  U.S. consumer sentiment unexpectedly slipped in January, but remained near a 12-year high, according to a report published on Friday.  Oil posted the biggest weekly decline since November as traders await proof that OPEC and other producers are following through on promises to cut production.  Oil has advanced since the deal among members of the Organization of Petroleum Exporting Countries and 11 other nations to temper global supply. It has been unable to sustain its rally above $55 amid concern that rising prices will spur more production. While Middle East producers including Saudi Arabia have signaled they’re sticking to the pledged reductions, the U.S. Tuesday raised this year’s output forecast.  West Texas Intermediate for February delivery slid 64 cents to settle at $52.37 a barrel on the New York Mercantile Exchange. Total volume traded was about 11 percent below the 100-day average. Aaj Ka Trend 16th Jan’17
  • 4.
    Equities I CommoditiesI Currencies I Mutual FundsSEBI Registered - Research Analyst Equities I Commodities I Currencies I Mutual Funds International Market Commodity Closing Price Gold 1197.70 Silver 16.83 Crude Oil 52.55 Brent Crude Oil 55.59 Natural Gas 3.41 COMEX/NYMEX/ICE ( Precious Metals & Energy) Currency & Commodity Index Currency (Spot) Current Price USD / INR 68.18 Dollar Index 101.17 EUR / USD 1.06 CRB Index* 194.56 Closing as on 13.01.17 *Closing as on 13.01.17 LME (Base Metals) ( $ per tones) Commodity Closing Price Copper 5909 Aluminum 1809 Zinc 2790 Lead 2305 Nickel 10450 SHFE (Base Metals) (Yuan per tones) Commodity Closing Price Copper 48140 Aluminum 13430 Zinc 22985 Lead 18960 Closing as on 13.01.17 Closing as on 13.01.17 LME INVENTORY DATA Aaj Ka Trend 06-Jan-17 09-Jan-17 10-Jan-17 11-Jan-17 13-Jan-17 Aluminium 5425 -1101 16801 11050 -4701 Copper -6650 -224 -1498 -5174 -4001 Lead -175 -402 -402 -76 -24 Nickel -805 1094 -49 -35 -953 Zinc -75 -375 -801 -1274 -902 16th Jan’17
  • 5.
    Equities I CommoditiesI Currencies I Mutual Funds This is solely for information of clients of Choice Broking and does not construe to be an investment advice. It is also not intended as an offer or solicitation for the purchase and sale of any financial instruments. Any action taken by you on the basis of the information contained herein is your responsibility alone and Choice Broking its subsidiaries or its employees or associates will not be liable in any manner for the consequences of such action taken by you. We have exercised due diligence in checking the correctness and authenticity of the information contained in this recommendation, but Choice Broking or any of its subsidiaries or associates or employees shall not be in any way responsible for any loss or damage that may arise to any person from any inadvertent error in the information contained in this recommendation or any action taken on basis of this information. Technical analysis studies market psychology, price patterns and volume levels. It is used to forecast future price and market movements. Technical analysis is complementary to fundamental analysis and news sources. The recommendations issued herewith might be contrary to recommendations issued by Choice Broking in the company research undertaken as the recommendations stated in this report is derived purely from technical analysis. Choice Broking has based this document on information obtained from sources it believes to be reliable but which it has not independently verified; Choice Broking makes no guarantee, representation or warranty and accepts no responsibility or liability as to its accuracy or completeness. The opinions contained within the report are based upon publicly available information at the time of publication and are subject to change without notice. The information and any disclosures provided herein are in summary form and have been prepared for informational purposes. The recommendations and suggested price levels are intended purely for trading purposes. The recommendations are valid for the day of the report however trading trends and volumes might vary substantially on an intraday basis and the recommendations may be subject to change. The information and any disclosures provided herein may be considered confidential. Any use, distribution, modification, copying, forwarding or disclosure by any person is strictly prohibited. The information and any disclosures provided herein do not constitute a solicitation or offer to purchase or sell any security or other financial product or instrument. The current performance may be unaudited. Past performance does not guarantee future returns. There can be no assurance that investments will achieve any targeted rates of return, and there is no guarantee against the loss of your entire investment. POTENTIAL CONFLICT OF INTEREST DISCLOSURE (as on date of report) Disclosure of interest statement – • Analyst interest of the stock /Instrument(s): - No. • Firm interest of the stock / Instrument (s): - No. Disclaimer Contact Us Amit Pathania Research Associate amit.pathania@choiceindia.com www.choicebroking.incustomercare@choiceindia.com SEBI Registered - Research Analyst Equities I Commodities I Currencies I Mutual Funds Aaj Ka Trend 16th Jan’17 Neeraj Yadav Research Advisor neeraj.yadav@choiceindia.com Anish Vyas Senior Research Associate anish.vyas@choiceindia.com Amit Pathania Digitally signed by Amit Pathania DN: cn=Amit Pathania, o=Choice Equity Broking Pvt. ltd, ou=Research Department, email=amit.pathania@choiceindia.com, c=IN Date: 2017.01.14 15:21:24 +05'30'