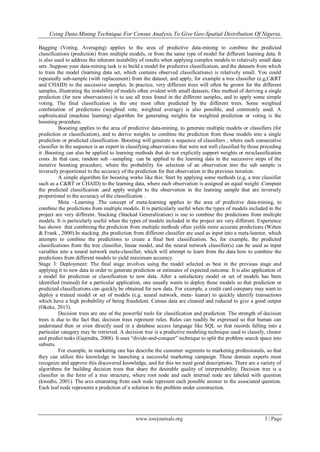
This document discusses using data mining techniques to analyze census data and provide geographic distributions of populations in Nigeria. It specifically uses a decision tree algorithm to predict attributes of populations like number of males/females, employment status, etc. from census databases. It then integrates these predictions with a geographic information system to display the geo-spatial distributions on maps. The results showed this approach was able to successfully extract predictive attributes from census data and provide geographic distributions to help inform business and government decisions. It recommends future work address overfitting issues and better handling of continuous attributes.
BIG DATA IN SMART CITIES: A SYSTEMATIC MAPPING REVIEWsarfraznawaz
Big data is an emerging area of research and its prospective applications in smart cities are extensively recognized. In this study, we provide a breadth-first review of the domain “Big Data in Smart Cities” by applying the formal research method of systematic mapping. We investigated the primary sources of publication, research growth, maturity level of the research area, prominent research themes, type of analytics applied, and the areas of smart cities where big data research is produced. Consequently, we identified that empirical research in the domain has been progressing since 2013. The IEEE Access journal and IEEE Smart Cities Conference are the leading sources of literature containing 10.34% and 13.88% of the publications, respectively. The current state of the research is semi-matured where research type of 46.15% of the publications is solution and experience, and contribution type of 60% of the publications is architecture, platform, and framework. Prescriptive is least whereas predictive is the most applied type of analytics in smart cities as it has been stated in 43.08% of the publications. Overall, 33.85%, 21.54%, 13.85%, 12.31%, 7.69%, 6.15%, and 4.61% of the research produced in the domain focused on smart transportation, smart environment, smart governance, smart healthcare, smart energy, smart education, and smart safety, respectively. Besides the requirement for producing validation and evaluation research in the areas of smart transportation and smart environment, there is a need for more research efforts in the areas of smart healthcare, smart governance, smart safety, smart education, and smart energy. Furthermore, the potential of prescriptive analytics in smart cities is also an area of research that needs to be explored.
TRENDS IN FINANCIAL RISK MANAGEMENT SYSTEMS IN 2020IJMIT JOURNAL
International Journal of Managing Information Technology (IJMIT) is a quarterly open access peer-reviewed journal that publishes articles that contribute new results in all areas of the strategic application of information technology (IT) in organizations. The journal focuses on innovative ideas and best practices in using IT to advance organizations – for-profit, non-profit, and governmental.
A forecasting of stock trading price using time series information based on b...IJECEIAES
Big data is a large set of structured or unstructured data that can collect, store, manage, and analyze data with existing database management tools. And it means the technique of extracting value from these data and interpreting the results. Big data has three characteristics: The size of existing data and other data (volume), the speed of data generation (velocity), and the variety of information forms (variety). The time series data are obtained by collecting and recording the data generated in accordance with the flow of time. If the analysis of these time series data, found the characteristics of the data implies that feature helps to understand and analyze time series data. The concept of distance is the simplest and the most obvious in dealing with the similarities between objects. The commonly used and widely known method for measuring distance is the Euclidean distance. This study is the result of analyzing the similarity of stock price flow using 793,800 closing prices of 1,323 companies in Korea. Visual studio and Excel presented calculate the Euclidean distance using an analysis tool. We selected “000100” as a target domestic company and prepared for big data analysis. As a result of the analysis, the shortest Euclidean distance is the code “143860” company, and the calculated value is “11.147”. Therefore, based on the results of the analysis, the limitations of the study and theoretical implications are suggested.
Supervised Multi Attribute Gene Manipulation For Cancerpaperpublications3
Abstract: Data mining, the extraction of hidden predictive information from large databases, is a powerful new technology with great potential to help companies focus on the most important information in their data warehouses. Data mining tools predict future trends and behaviours, allowing businesses to make proactive, knowledge-driven decisions. The automated, prospective analyses offered by data mining move beyond the analyses of past events provided by retrospective tools typical of decision support systems.
They scour databases for hidden patterns, finding predictive information that experts may miss because it lies outside their expectations. Data mining techniques are the result of a long process of research and product development. This evolution began when business data was first stored on computers, continued with improvements in data access, and more recently, generated technologies that allow users to navigate through their data in real time. Data mining takes this evolutionary process beyond retrospective data access and navigation to prospective and proactive information delivery.
Presentation at the AAAI 2013 Fall Symposium on Semantics for Big Data, Arlington, Virginia, November 15-17, 2013
Additional related material at: http://wiki.knoesis.org/index.php/Smart_Data
Related paper at: http://www.knoesis.org/library/resource.php?id=1903
Abstract: We discuss the nature of Big Data and address the role of semantics in analyzing and processing Big Data that arises in the context of Physical-Cyber-Social Systems. We organize our research around the five V's of Big Data, where four of the Vs are harnessed to produce the fifth V - value. To handle the challenge of Volume, we advocate semantic perception that can convert low-level observational data to higher-level abstractions more suitable for decision-making. To handle the challenge of Variety, we resort to the use of semantic models and annotations of data so that much of the intelligent processing can be done at a level independent of heterogeneity of data formats and media. To handle the challenge of Velocity, we seek to use continuous semantics capability to dynamically create event or situation specific models and recognize new concepts, entities and facts. To handle Veracity, we explore the formalization of trust models and approaches to glean trustworthiness. The above four Vs of Big Data are harnessed by the semantics-empowered analytics to derive Value for supporting practical applications transcending physical-cyber-social continuum.
Smart Data for you and me: Personalized and Actionable Physical Cyber Social ...Amit Sheth
Featured Keynote at Worldcomp'14, July 2014: http://www.world-academy-of-science.org/worldcomp14/ws/keynotes/keynote_sheth
Video of the talk at: http://youtu.be/2991W7OBLqU
Big Data has captured a lot of interest in industry, with the emphasis on the challenges of the four Vs of Big Data: Volume, Variety, Velocity, and Veracity, and their applications to drive value for businesses. Recently, there is rapid growth in situations where a big data challenge relates to making individually relevant decisions. A key example is human health, fitness, and well-being. Consider for instance, understanding the reasons for and avoiding an asthma attack based on Big Data in the form of personal health signals (e.g., physiological data measured by devices/sensors or Internet of Things around humans, on the humans, and inside/within the humans), public health signals (information coming from the healthcare system such as hospital admissions), and population health signals (such as Tweets by people related to asthma occurrences and allergens, Web services providing pollen and smog information, etc.). However, no individual has the ability to process all these data without the help of appropriate technology, and each human has different set of relevant data!
In this talk, I will forward the concept of Smart Data that is realized by extracting value from Big Data, to benefit not just large companies but each individual. If I am an asthma patient, for all the data relevant to me with the four V-challenges, what I care about is simply, “How is my current health, and what is the risk of having an asthma attack in my personal situation, especially if that risk has changed?” As I will show, Smart Data that gives such personalized and actionable information will need to utilize metadata, use domain specific knowledge, employ semantics and intelligent processing, and go beyond traditional reliance on ML and NLP.
For harnessing volume, I will discuss the concept of Semantic Perception, that is, how to convert massive amounts of data into information, meaning, and insight useful for human decision-making. For dealing with Variety, I will discuss experience in using agreement represented in the form of ontologies, domain models, or vocabularies, to support semantic interoperability and integration. For Velocity, I will discuss somewhat more recent work on Continuous Semantics, which seeks to use dynamically created models of new objects, concepts, and relationships, using them to better understand new cues in the data that capture rapidly evolving events and situations.
Smart Data applications in development at Kno.e.sis come from the domains of personalized health, energy, disaster response, and smart city. I will present examples from a couple of these.
Data mining is the process of discovering patterns in large data sets involving methods at the intersection of machine learning, statistics, and database systems. 1 Data mining is an interdisciplinary sub field of computer science and statistics with an overall goal to extract from a data set and transform the information into a comprehensible structure for further use. 1 2 3 4 The process of digging through data to discover hidden connections and predict future trends has a long history. Sometimes referred to as 'knowledge discovery' in databases, the term data mining wasn't coined until the 1990s. What was old is new again, as data mining technology keeps evolving to keep pace with the limitless potential of big data and affordable computing power. Over the last decade, advances in processing power and speed have enabled us to move beyond manual, tedious and time consuming practices to quick, easy and automated data analysis. The more complex the data sets collected, the more potential there is to uncover relevant insights. Rupashi Koul "Overview of Data Mining" Published in International Journal of Trend in Scientific Research and Development (ijtsrd), ISSN: 2456-6470, Volume-4 | Issue-4 , June 2020, URL: https://www.ijtsrd.com/papers/ijtsrd31368.pdf Paper Url :https://www.ijtsrd.com/engineering/computer-engineering/31368/overview-of-data-mining/rupashi-koul
Correlation Method for Public Security Information in Big Data EnvironmentIJERA Editor
With the gradual improvement of the informationization level in public security area, the concept "Information led policing" has been formed, many information systems have been built and vast amounts of business data have been accumulated down, But these systems and data are isolated and becoming the isolated information islands. This thesis proposes an architecture of information analysis system on big data platform, then discuss the question of data integration, finally proposes the correlation method for public security information: direct association and indirect association.
Big Data Challenges and Trust Management: A Personal Perspective
A tutorial presented by Dr. Krishnaprasad Thirunarayan at the International Conference on Collaboration Technologies and Systems 2016 (CTS 2016)
Achieving Sustainable Development Goals using Computer VisionAkshat Gupta
https://youtu.be/7bXtlTsZCLw
NAME OF AUTHOR SUBMITTING PAPER:
1) Ritika Selot
2) Akshat Gupta
CLASS: Information Technology (2016-18)
COLLEGE: Xavier Institute of Social Service, Ranchi
A Survey On Ontology Agent Based Distributed Data MiningEditor IJMTER
With the increased complexity in number of applications and due to large volume
of availability of data from heterogeneous sources, there is a need for the development of
suitable ontology, which can handle the large data set and present the mined outcomes for
evaluation intelligently. In the era of intensive data driven applications distributed data mining can
meet the challenges with the support of agents. This paper discusses the underlying principles for
effectiveness of modern agent-based systems for distributed data mining
Visualization of cartographic systems in mobile devices is a challenge due to the its own
limitations to show all the relevant information that the user needs on the screen. Within this paper we review
current state-of- the-art technological solutions to face this problem and we classify them in a novel typology. In
addition, it is shown an example case of a developed system for a logistic company specialized in dangerous
goods. The system is able to calculate optimal routes and communicate the drivers the best path in order to
achieve a great management of the company resources
International Journal of Computational Engineering Research (IJCER) is dedicated to protecting personal information and will make every reasonable effort to handle collected information appropriately. All information collected, as well as related requests, will be handled as carefully and efficiently as possible in accordance with IJCER standards for integrity and objectivity.
TRANSFORMING BIG DATA INTO SMART DATA: Deriving Value via Harnessing Volume, ...Amit Sheth
Keynote given at ICDE2014, April 2014. Details at: http://ieee-icde2014.eecs.northwestern.edu/keynotes.html
A video of a version of this talk is available here: http://youtu.be/8RhpFlfpJ-A
(download to see many hidden slides).
Two versions of this talk, targeted at Smart Energy and Personalized Digital Health domains/apps at: http://wiki.knoesis.org/index.php/Smart_Data
Previous (older) version replaced by this version: http://www.slideshare.net/apsheth/big-data-to-smart-data-keynote
FORECASTING MACROECONOMICAL INDICES WITH MACHINE LEARNING: IMPARTIAL ANALYSIS...ijscai
The importance of economic freedom has often been stressed by supporters of liberalism, but can its actual effect be observed in a data driven, objective way? To analyze this relation the Economic Freedom of the World (EFW) index and the Human Development Index (HDI) were examined with modern machine learning algorithms and a wide-ranging approach. Considering the EFW index’s preference of a liberalistic oriented economic policy, an objective recommendation for creating an economic policy that improves people’s everyday lives might be derived by the analysis results. It was found that these more advanced algorithms achieve a considerably stronger correlation between both indices than pure statistical means yet leave a small room for interpretation towards a counter-liberalistic implementation of demand-driven economic policy.
Presented at the Panel on
Sensor, Data, Analytics and Integration in Advanced Manufacturing, at the Connected Manufacturing track of Bosch-USA organized "Leveraging Public-Private Partnerships for Regional Growth Summit". Panel statement: Sensors, data and analytics are the core of any smart manufacturing system. What are the main challenges to create actionable outputs, replicate systems and scale efficiency gains across industries?
Moderator: Thomas Stiedl, Bosch
Panelists:
1. Amit Sheth, Wright State University
2. Howie Choset, Carnegie Melon University
3. Nagi Gebraeel, Georgia Institute of Technology
4. Brian Anthony, Massachusetts Institute of Technology
5. Yarom Polosky, Oak Ridget National Laboratory
For in-depth look:
Smart IoT: IoT as a human agent, human extension, and human complement
http://amitsheth.blogspot.com/2015/03/smart-iot-iot-as-human-agent-human.html
Semantic Gateway: http://knoesis.org/library/resource.php?id=2154
SSN Ontology: http://knoesis.org/library/resource.php?id=1659
Applications of Multimodal Physical (IoT), Cyber and Social Data for Reliable and Actionable Insights: http://knoesis.org/library/resource.php?id=2018
Smart Data: Transforming Big Data into Smart Data...: http://wiki.knoesis.org/index.php/Smart_Data
Historic use of the term Smart Data (2004): http://www.scribd.com/doc/186588820
About
Evolution of Data, Data Science , Business Analytics, Applications, AI, ML, DL, Data science – Relationship, Tools for Data Science, Life cycle of data science with case study,
Algorithms for Data Science, Data Science Research Areas,
Future of Data Science.
IOSR Journal of Electronics and Communication Engineering(IOSR-JECE) is an open access international journal that provides rapid publication (within a month) of articles in all areas of electronics and communication engineering and its applications. The journal welcomes publications of high quality papers on theoretical developments and practical applications in electronics and communication engineering. Original research papers, state-of-the-art reviews, and high quality technical notes are invited for publications.
IOSR Journal of Business and Management (IOSR-JBM) is an open access international journal that provides rapid publication (within a month) of articles in all areas of business and managemant and its applications. The journal welcomes publications of high quality papers on theoretical developments and practical applications inbusiness and management. Original research papers, state-of-the-art reviews, and high quality technical notes are invited for publications.
IOSR Journal of Applied Physics (IOSR-JAP) is an open access international journal that provides rapid publication (within a month) of articles in all areas of physics and its applications. The journal welcomes publications of high quality papers on theoretical developments and practical applications in applied physics. Original research papers, state-of-the-art reviews, and high quality technical notes are invited for publications.
Integrating Web Services With Geospatial Data Mining Disaster Management for ...Waqas Tariq
Data Mining (DM) and Geographical Information Systems (GIS) are complementary techniques for describing, transforming, analyzing and modeling data about real world system. GIS and DM are naturally synergistic technologies that can be joined to produce powerful market insight from a sea of disparate data. Web Services would greatly simplify the development of many kinds of data integration and knowledge management applications. This research aims to develop a Spatial DM web service. It integrates state of the art GIS and DM functionality in an open, highly extensible, web-based architecture. The Interoperability of geospatial data previously focus just on data formats and standards. The recent popularity and adoption of Web Services has provided new means of interoperability for geospatial information not just for exchanging data but for analyzing these data during exchange as well. An integrated, user friendly Spatial DM System available on the internet via a web service offers exciting new possibilities for geo-spatial analysis to be ready for decision making and geographical research to a wide range of potential users.
Data Science Demystified_ Journeying Through Insights and InnovationsVaishali Pal
In the digital age, data has emerged as one of the most valuable resources, driving decision-making processes across industries. Data science, the interdisciplinary field that extracts insights and knowledge from structured and unstructured data, plays a pivotal role in leveraging this resource. This section provides an overview of data science, its importance, and its applications in various domains.
Predictive geospatial analytics using principal component regression IJECEIAES
Nowadays, exponential growth in geospatial or spatial data all over the globe, geospatial data analytics is absolutely deserved to pay attention in manipulating voluminous amount of geodata in various forms increasing with high velocity. In addition, dimensionality reduction has been playing a key role in high-dimensional big data sets including spatial data sets which are continuously growing not only in observations but also in features or dimensions. In this paper, predictive analytics on geospatial big data using Principal Component Regression (PCR), traditional Multiple Linear Regression (MLR) model improved with Principal Component Analysis (PCA), is implemented on distributed, parallel big data processing platform. The main objective of the system is to improve the predictive power of MLR model combined with PCA which reduces insignificant and irrelevant variables or dimensions of that model. Moreover, it is contributed to present how data mining and machine learning approaches can be efficiently utilized in predictive geospatial data analytics. For experimentation, OpenStreetMap (OSM) data is applied to develop a one-way road prediction for city Yangon, Myanmar. Experimental results show that hybrid approach of PCA and MLR can be efficiently utilized not only in road prediction using OSM data but also in improvement of traditional MLR model.
Big data is to be implemented in as full way in real-time; it is still in a research. People
need to know what to do with enormous data. Insurance agencies are actively participating for the
analysis of patient's data which could be used to extract some useful information. Analysis is done in
term of discharge summary, drug & pharma, diagnostics details, doctor’s report, medical history,
allergies & insurance policies which are made by the application of map reduce and useful data is
extracted. We are analysing more number of factors like disease Types with its agreeing reasons,
insurance policy details along with sanctioned amount, family grade wise segregation.
Keywords: Big data, Stemming, Map reduce Policy and Hadoop.
ISSUES, CHALLENGES, AND SOLUTIONS: BIG DATA MININGcscpconf
Data has become an indispensable part of every economy, industry, organization, business
function and individual. Big Data is a term used to identify the datasets that whose size is
beyond the ability of typical database software tools to store, manage and analyze. The Big
Data introduce unique computational and statistical challenges, including scalability and
storage bottleneck, noise accumulation, spurious correlation and measurement errors. These
challenges are distinguished and require new computational and statistical paradigm. This
paper presents the literature review about the Big data Mining and the issues and challenges
with emphasis on the distinguished features of Big Data. It also discusses some methods to deal
with big data.
Frequent Item set Mining of Big Data for Social MediaIJERA Editor
Big data is a term for massive data sets having large, more varied and complex structure with the difficulties of storing, analyzing and visualizing for further processes or results. Bigdata includes data from email, documents, pictures, audio, video files, and other sources that do not fit into a relational database. This unstructured data brings enormous challenges to Bigdata.The process of research into massive amounts of data to reveal hidden patterns and secret correlations named as big data analytics. Therefore, big data implementations need to be analyzed and executed as accurately as possible. The proposed model structures the unstructured data from social media in a structured form so that data can be queried efficiently by using Hadoop MapReduce framework. The Bigdata mining is essential in order to extract value from massive amount of data. MapReduce is efficient method to deal with Big data than traditional techniques.The proposed Linguistic string matching Knuth-Morris-Pratt algorithm and K-Means clustering algorithm gives proper platform to extract value from massive amount of data and recommendation for user.Linguistic matching techniques such as Knuth–Morris–Pratt string matching algorithm are very useful in giving proper matching output to user query. The K-Means algorithm is one which works on clustering data using vector space model. It can be an appropriate method to produce recommendation for user.
Frequent Item set Mining of Big Data for Social MediaIJERA Editor
Big data is a term for massive data sets having large, more varied and complex structure with the difficulties of storing, analyzing and visualizing for further processes or results. Bigdata includes data from email, documents, pictures, audio, video files, and other sources that do not fit into a relational database. This unstructured data brings enormous challenges to Bigdata.The process of research into massive amounts of data to reveal hidden patterns and secret correlations named as big data analytics. Therefore, big data implementations need to be analyzed and executed as accurately as possible. The proposed model structures the unstructured data from social media in a structured form so that data can be queried efficiently by using Hadoop MapReduce framework. The Bigdata mining is essential in order to extract value from massive amount of data. MapReduce is efficient method to deal with Big data than traditional techniques.The proposed Linguistic string matching Knuth-Morris-Pratt algorithm and K-Means clustering algorithm gives proper platform to extract value from massive amount of data and recommendation for user.Linguistic matching techniques such as Knuth–Morris–Pratt string matching algorithm are very useful in giving proper matching output to user query. The K-Means algorithm is one which works on clustering data using vector space model. It can be an appropriate method to produce recommendation for user
Due to the arrival of new technologies, devices, and communication means, the amount of data produced by mankind is growing rapidly every year. This gives rise to the era of big data. The term big data comes with the new challenges to input, process and output the data. The paper focuses on limitation of traditional approach to manage the data and the components that are useful in handling big data. One of the approaches used in processing big data is Hadoop framework, the paper presents the major components of the framework and working process within the framework.
A Survey of Agent Based Pre-Processing and Knowledge RetrievalIOSR Journals
Abstract: Information retrieval is the major task in present scenario as quantum of data is increasing with a
tremendous speed. So, to manage & mine knowledge for different users as per their interest, is the goal of every
organization whether it is related to grid computing, business intelligence, distributed databases or any other.
To achieve this goal of extracting quality information from large databases, software agents have proved to be
a strong pillar. Over the decades, researchers have implemented the concept of multi agents to get the process
of data mining done by focusing on its various steps. Among which data pre-processing is found to be the most
sensitive and crucial step as the quality of knowledge to be retrieved is totally dependent on the quality of raw
data. Many methods or tools are available to pre-process the data in an automated fashion using intelligent
(self learning) mobile agents effectively in distributed as well as centralized databases but various quality
factors are still to get attention to improve the retrieved knowledge quality. This article will provide a review of
the integration of these two emerging fields of software agents and knowledge retrieval process with the focus
on data pre-processing step.
Keywords: Data Mining, Multi Agents, Mobile Agents, Preprocessing, Software Agents
1. Web Mining – Web mining is an application of data mining for di.docxbraycarissa250
1. Web Mining – Web mining is an application of data mining for discovering data patterns from the web. Web mining is of three categories – content mining, structure mining and usage mining. Content mining detects patterns from data collected by the search engine. Structure mining examines the data which is related to the structure of the website while usage mining examines data from the user’s browser. The data collected through web mining is evaluated and analyzed using techniques like clustering, classification, and association. It is a very good topic for the thesis in data mining.
2. Predictive Analytics – Predictive Analytics is a set of statistical techniques to analyze the current and historical data to predict the future events. The techniques include predictive modeling, machine learning, and data mining. In large organizations, predictive analytics help businesses to identify risks and opportunities in their business. Both structured and unstructured data is analyzed to detect patterns. Predictive Analysis is a lengthy process and consist of seven stages which are project defining, data collection, data analysis, statistics, modeling, deployment, and monitoring. It is an excellent choice for research and thesis.
3. Oracle Data Mining – Oracle Data Mining, also referred as ODM, is a component of Oracle Advanced Analytics Database. It provides powerful data mining algorithms to assist the data analysts to get valuable insights from data to predict the future standards. It helps in predicting the customer behavior which will ultimately help in targeting the best customer and cross-selling. SQL functions are used in the algorithm to mine data tables and views. It is also a good choice for thesis and research in data mining and database.
4. Clustering – Clustering is a process in which data objects are divided into meaningful sub-classes known as clusters. Objects with similar characteristics are aggregated together in a cluster. There are distinct models of clustering such as centralized, distributed. In centroid-based clustering, a vector value is assigned to each cluster. There are various applications of clustering in data mining such as market research, image processing, and data analysis. It is also used in credit card fraud detection.
5. Text mining – Text mining or text data mining is a process to extract high-quality information from the text. It is done through patterns and trends devised using statistical pattern learning. Firstly, the input data is structured. After structuring, patterns are derived from this structured data and finally, the output is evaluated and interpreted. The main applications of text mining include competitive intelligence, E-Discovery, National Security, and social media monitoring. It is a trending topic for the thesis in data mining.
6. Fraud Detection – The number of frauds in daily life is increasing in sectors like banking, finance, and government. Accurate detection of fraud is a challenge. Da.
Similar to Using Data-Mining Technique for Census Analysis to Give Geo-Spatial Distribution of Nigeria. (20)
Cosmetic shop management system project report.pdfKamal Acharya
Buying new cosmetic products is difficult. It can even be scary for those who have sensitive skin and are prone to skin trouble. The information needed to alleviate this problem is on the back of each product, but it's thought to interpret those ingredient lists unless you have a background in chemistry.
Instead of buying and hoping for the best, we can use data science to help us predict which products may be good fits for us. It includes various function programs to do the above mentioned tasks.
Data file handling has been effectively used in the program.
The automated cosmetic shop management system should deal with the automation of general workflow and administration process of the shop. The main processes of the system focus on customer's request where the system is able to search the most appropriate products and deliver it to the customers. It should help the employees to quickly identify the list of cosmetic product that have reached the minimum quantity and also keep a track of expired date for each cosmetic product. It should help the employees to find the rack number in which the product is placed.It is also Faster and more efficient way.
Hybrid optimization of pumped hydro system and solar- Engr. Abdul-Azeez.pdffxintegritypublishin
Advancements in technology unveil a myriad of electrical and electronic breakthroughs geared towards efficiently harnessing limited resources to meet human energy demands. The optimization of hybrid solar PV panels and pumped hydro energy supply systems plays a pivotal role in utilizing natural resources effectively. This initiative not only benefits humanity but also fosters environmental sustainability. The study investigated the design optimization of these hybrid systems, focusing on understanding solar radiation patterns, identifying geographical influences on solar radiation, formulating a mathematical model for system optimization, and determining the optimal configuration of PV panels and pumped hydro storage. Through a comparative analysis approach and eight weeks of data collection, the study addressed key research questions related to solar radiation patterns and optimal system design. The findings highlighted regions with heightened solar radiation levels, showcasing substantial potential for power generation and emphasizing the system's efficiency. Optimizing system design significantly boosted power generation, promoted renewable energy utilization, and enhanced energy storage capacity. The study underscored the benefits of optimizing hybrid solar PV panels and pumped hydro energy supply systems for sustainable energy usage. Optimizing the design of solar PV panels and pumped hydro energy supply systems as examined across diverse climatic conditions in a developing country, not only enhances power generation but also improves the integration of renewable energy sources and boosts energy storage capacities, particularly beneficial for less economically prosperous regions. Additionally, the study provides valuable insights for advancing energy research in economically viable areas. Recommendations included conducting site-specific assessments, utilizing advanced modeling tools, implementing regular maintenance protocols, and enhancing communication among system components.
Overview of the fundamental roles in Hydropower generation and the components involved in wider Electrical Engineering.
This paper presents the design and construction of hydroelectric dams from the hydrologist’s survey of the valley before construction, all aspects and involved disciplines, fluid dynamics, structural engineering, generation and mains frequency regulation to the very transmission of power through the network in the United Kingdom.
Author: Robbie Edward Sayers
Collaborators and co editors: Charlie Sims and Connor Healey.
(C) 2024 Robbie E. Sayers
HEAP SORT ILLUSTRATED WITH HEAPIFY, BUILD HEAP FOR DYNAMIC ARRAYS.
Heap sort is a comparison-based sorting technique based on Binary Heap data structure. It is similar to the selection sort where we first find the minimum element and place the minimum element at the beginning. Repeat the same process for the remaining elements.
Forklift Classes Overview by Intella PartsIntella Parts
Discover the different forklift classes and their specific applications. Learn how to choose the right forklift for your needs to ensure safety, efficiency, and compliance in your operations.
For more technical information, visit our website https://intellaparts.com
NUMERICAL SIMULATIONS OF HEAT AND MASS TRANSFER IN CONDENSING HEAT EXCHANGERS...ssuser7dcef0
Power plants release a large amount of water vapor into the
atmosphere through the stack. The flue gas can be a potential
source for obtaining much needed cooling water for a power
plant. If a power plant could recover and reuse a portion of this
moisture, it could reduce its total cooling water intake
requirement. One of the most practical way to recover water
from flue gas is to use a condensing heat exchanger. The power
plant could also recover latent heat due to condensation as well
as sensible heat due to lowering the flue gas exit temperature.
Additionally, harmful acids released from the stack can be
reduced in a condensing heat exchanger by acid condensation. reduced in a condensing heat exchanger by acid condensation.
Condensation of vapors in flue gas is a complicated
phenomenon since heat and mass transfer of water vapor and
various acids simultaneously occur in the presence of noncondensable
gases such as nitrogen and oxygen. Design of a
condenser depends on the knowledge and understanding of the
heat and mass transfer processes. A computer program for
numerical simulations of water (H2O) and sulfuric acid (H2SO4)
condensation in a flue gas condensing heat exchanger was
developed using MATLAB. Governing equations based on
mass and energy balances for the system were derived to
predict variables such as flue gas exit temperature, cooling
water outlet temperature, mole fraction and condensation rates
of water and sulfuric acid vapors. The equations were solved
using an iterative solution technique with calculations of heat
and mass transfer coefficients and physical properties.
About
Indigenized remote control interface card suitable for MAFI system CCR equipment. Compatible for IDM8000 CCR. Backplane mounted serial and TCP/Ethernet communication module for CCR remote access. IDM 8000 CCR remote control on serial and TCP protocol.
• Remote control: Parallel or serial interface.
• Compatible with MAFI CCR system.
• Compatible with IDM8000 CCR.
• Compatible with Backplane mount serial communication.
• Compatible with commercial and Defence aviation CCR system.
• Remote control system for accessing CCR and allied system over serial or TCP.
• Indigenized local Support/presence in India.
• Easy in configuration using DIP switches.
Technical Specifications
Indigenized remote control interface card suitable for MAFI system CCR equipment. Compatible for IDM8000 CCR. Backplane mounted serial and TCP/Ethernet communication module for CCR remote access. IDM 8000 CCR remote control on serial and TCP protocol.
Key Features
Indigenized remote control interface card suitable for MAFI system CCR equipment. Compatible for IDM8000 CCR. Backplane mounted serial and TCP/Ethernet communication module for CCR remote access. IDM 8000 CCR remote control on serial and TCP protocol.
• Remote control: Parallel or serial interface
• Compatible with MAFI CCR system
• Copatiable with IDM8000 CCR
• Compatible with Backplane mount serial communication.
• Compatible with commercial and Defence aviation CCR system.
• Remote control system for accessing CCR and allied system over serial or TCP.
• Indigenized local Support/presence in India.
Application
• Remote control: Parallel or serial interface.
• Compatible with MAFI CCR system.
• Compatible with IDM8000 CCR.
• Compatible with Backplane mount serial communication.
• Compatible with commercial and Defence aviation CCR system.
• Remote control system for accessing CCR and allied system over serial or TCP.
• Indigenized local Support/presence in India.
• Easy in configuration using DIP switches.
We have compiled the most important slides from each speaker's presentation. This year’s compilation, available for free, captures the key insights and contributions shared during the DfMAy 2024 conference.
6th International Conference on Machine Learning & Applications (CMLA 2024)ClaraZara1
6th International Conference on Machine Learning & Applications (CMLA 2024) will provide an excellent international forum for sharing knowledge and results in theory, methodology and applications of on Machine Learning & Applications.
Using Data-Mining Technique for Census Analysis to Give Geo-Spatial Distribution of Nigeria.
1. IOSR Journal of Computer Engineering (IOSR-JCE)
e-ISSN: 2278-0661, p- ISSN: 2278-8727Volume 14, Issue 2 (Sep. - Oct. 2013), PP 01-05
www.iosrjournals.org
www.iosrjournals.org 1 | Page
Using Data-Mining Technique for Census Analysis to Give Geo-
Spatial Distribution of Nigeria.
*Ogochukwu C.Okeke And **Boniface C,Ekechukwu
*Computer Science Department,Anambra State University Uli,Nigeria
**Computer Science Department.Nnamdi Azikiwe University,Awka,Nigeria
Abstract: There are patterns buried within the mass of data in the various editions of population census figures
in this country. These are patterns that will be impossible for humans working with bare eyes and hands, to
uncover without computer system to give geo-spatial distribution of population in that area. This paper is an
effort towards harnessing the power of data-mining technique to develop mining model applicable to the
analysis of census data that could uncover some hidden patterns to get their geo-spatial distribution. This could
help better-informed business decisions and provide government with the intelligence for strategic planning,
tactical decision-making and better policy formulation.
Decision tree learning is a method for approximating discrete-valued target function, in which the leaned
function is represented by a decision tree.
Decision tree algorithm was used to predict some basic attributes of population in the census database.
Structured System Analysis and Design Methodology were used.
Key words: Census, Data-mining and GIS
I. Introduction
Census analysis is often not critically analyzed to bring out some of the basic and important attributes
of census data information to give geo-spatial distribution of population. This is due to non-availability of the
required tools for carrying out such analysis. This paper suggests the use of data-mining technique(Decision tree
algorithm technique) to extract hidden information from large census data warehouse and geographical
information system (GIS) as an integrating technology that gives geo-spatial distribution of the population.
Data-mining is the process of discovering previously unknown, actionable and profitable information
from large consolidated databases and using it to support tactical and strategic decisions (Gajendra, 2008). It is
also extraction of hidden predictive information from large databases, is a powerful new technology with great
potential to help companies, industries, institutions, government e.t.c focus on the most important information in
their data warehouses. Data-mining tools predict future trends and behaviors, allowing business to make
proactive, knowledge –driven decisions. The automated, prospective analyses offered by data-mining move
beyond the analyses of past events provided by retrospective tools typical of decision support systems. Data-
mining tools can answer business questions that traditionally were time consuming to resolve. They scour
databases for hidden patterns, finding predictive information that experts may miss because it lies outside their
expectations.
Data-mining is the exploration of historical data (usually large in size) in search of a consistent pattern
and / or a systematic relationship between variable. It is then used to volute the findings by applying the
detected pattern to new subsets of data. The roots of data-mining originate in three areas, Classical statistics,
artificial intelligence and machine learning. Pregiborn (1997) described data-mining as a blend of statistics,
artificial intelligence, and database research and noted that it was not field of interest of many until recently.
Mena (2005) has asserted data-mining is the process of discovering actionable and meaningful patterns, profiles
and trends by sifting through your data using pattern recognition technologies such as neural networks machine
learning and genetic algorithms. Also Foloruns & Ogunde (2004) have asserted that data-mining is a
technologic for knowledge management in business process redesign (BPR). It helps in rethinking a process in
order to enhance its performance academics and business practitioners have been developing methodologies to
support the application of BPR principles. However, most methodologies generally lack actual guidance on
deriving a process design thereby threatening the success of BPR (Selma & Hago 2003). Indeed a survey has
proved that 85% of business process redesign projects fail or experience problems (Crow& Giudici 2002).
Moreover, Data-mining takes evolutionary process beyond retrospective data access and navigation to
prospective and proactive information delivery (Koh, Hian & Low 2004). Data mining is ready for application
in business community because it is supported by tree technologies that are now sufficiently mature which are
massive data technologies that are now sufficiently mature which are massive data collection, powerful
processor computers and data mining algorithm. Most companies already collect and refine massive quantities
of data. Data-mining techniques can be implemented rapidly on existing software and hardware platforms to
2. Using Data-Mining Technique For Census Analysis To Give Geo-Spatial Distribution Of Nigeria.
www.iosrjournals.org 2 | Page
enhance the value of existing information resources, can be integrated with new products and systems as they
are brought on-line. When implemented on high performance client/server or parallel processing computers,
data-mining tools can analyze massive databases to deliver answers to questions.
The United Nation (UN) defines census as total as total process of collecting compiling, analyzing,
evaluating, publishing and disseminating demographic economic, social and housing data pertaining at a
specified time to all persons and all building in a country or in a well delineated part. A population and housing
census is of great relevance to the economics, political and socio-cultural planning of a country. Reliable and
detailed data on the size, structure, distribution and socio-economic and demographic characteristics of a
country’s population is required for planning, policy intervention and monitoring of development goals. Within
the masses of information in the census database lays hidden information of strategic importance. Data-mining
is a key element in finding the particular pattern and relationship that can help governments, organizations and
businesses. Data-mining find those patterns and relationships using sophisticated data analysis tool and
technique to build models. Data-mining model will predict attributes of the population like youths of a given age
limit, number of males, number of females ,sex, employment e.t.c Then geographical information system (GIS)
will integrates, edits, analyzes, shares, and display geo-spatial distribution of the population . Census can do all
these with data-mining; the statistical techniques of data-mining are familiar. They include linear and logistic
regressions, multivariate analysis, principal component analysis, decision trees and neural networks. Traditional
approaches to statistical inference fail with large databases. Decision- tree is a tree-shaped structure that
represents set of decision. This decision generates rules for the classification of a dataset (Gajendra, 2008).
However, because with thousands or millions of cases and hundreds or thousand of variable there will
be spurious relationships which will be highly significant by any statistical test. The objective is to build a
model with significant predictive power that would give geo-spatial distribution of the population. It is not
enough just to find which relationships are statistically significant. There are two main kinds of models in data-
mining; the first kind is predictive models which use data with known results to develop values. For examples,
based on marital status, gender, age, employment etc. in a census database the model will predict wealth. The
strength of the predictive model lies in learning (self- training teaching it how to predict the outcome of a given
process).The second kind of model is descriptive models which may be used to guide decisions as opposed to
making explicitly predictions. For example, the model might identify different ethnicity in a database.
The data-mining algorithm is the mechanism that creates mining models. To create a model, an algorithm first
analyzes a set of data, looking for specific patterns and trends. The algorithm then uses the result of this analysis
to define the parameters of the mining model to give geo-spatial distribution.
The data-mining model that an algorithm creates takes various forms including; number of males,
number of females, sex, literacy, employment and illiteracy to give geo-spatial distribution of population. The
data-mining extract these attributes out from pool of census database and give geo-spatial distribution. In its
simplest form, a Geographic Information System (GIS) is a computer-based data management system for storing,
editing, manipulating, analyzing, and displaying geographically referenced information. However, effective use
of GIS also requires good quality data, skilled personnel, and institutional arrangements to collect, share, and
disseminate the data. Geographically referenced, or geospatial, data describes anything that can be located in
physical space, most typically with respect to earth’s surface, and therefore can be displayed on a map.
Process of Data-Mining Technique; this process consists of three stages: the initial exploration, model building
or pattern identification with validation and verification and deployment (i.e. the application of the model to
new data in order to generate predictions)
Stage 1: Exploration, this stage usually starts with data preparation which may involve cleaning data, data
transformation, selecting subsets of record and in case of data set with large numbers of variable (fields)-
Performing some preliminary feature, selection operations to bring the number of variables to a manageable
range (depending on statistical methods which are being considered). Then, depending on the nature of the
analytic problem, this first stage of the process of data- mining may involve anywhere between a simple choice
of straight forward predictors for a regression model, to elaborate exploratory analyses using a wide variety of
graphical and statistical methods.
Stage 2: Model building and validation: Berry & Linoff (2000) asserted that this stage involves considering
various models and choosing the best one based on their predictive performance (i.e. explaining the variability
in question and producing results across samples). This may sound like a simple operation, but in fact it
sometimes involves a very elaborate process. There are a variety of techniques developed to achieve that goal.
Many of which are based on so called” competitive evaluation of model”, that is applying different models to
the same dataset and then comparing their performance to choose the best. These techniques which are often
considered the core of predictive data-mining –include: Bagging (Voting, Averaging), Boosting, Stacking
(Stacked Generalizations), and Meta-Learning.
3. Using Data-Mining Technique For Census Analysis To Give Geo-Spatial Distribution Of Nigeria.
www.iosrjournals.org 3 | Page
Bagging (Voting, Averaging) applies to the area of predictive data-mining to combine the predicted
classifications (prediction) from multiple models, or from the same type of model for different learning data. It
is also used to address the inherent instability of results when applying complex models to relatively small data
sets .Suppose your data-mining task is to build a model for predictive classification, and the datasets from which
to train the model (learning data set, which contains observed classifications) is relatively small. You could
repeatedly sub-sample (with replacement) from the dataset, and apply, for example a tree classifier (e.g,C&RT
and CHAID) to the successive samples. In practice, very different trees will often be grown for the different
samples, illustrating the instability of models often evident with small datasets. One method of deriving a single
prediction (for new observations) is to use all trees found in the different samples, and to apply some simple
voting. The final classification is the one most often predicted by the different trees. Some weighted
combination of predictions (weighted vote, weighted average) is also possible, and commonly used. A
sophisticated (machine learning) algorithm for generating weights for weighted prediction or voting is the
boosting procedure.
Boosting applies to the area of predictive data-mining, to generate multiple models or classifiers (for
prediction or classification), and to derive weights to combine the prediction from those models into a single
prediction or predicted classification. Boosting will generate a sequence of classifiers , where each consecutive
classifier in the sequence is an expert in classifying observations that were not well classified by those preceding
it .Boosting can also be applied to learning methods that do not explicitly support weights or misclassification
costs .In that case, random sub –sampling can be applied to the learning data in the successive steps of the
iterative boosting procedure, where the probability for selection of an observation into the sub sample is
inversely proportional to the accuracy of the prediction for that observation in the previous iteration.
A simple algorithm for boosting works like this: Start by applying some methods (e.g, a tree classifier
such as a C&RT or CHAID) to the learning data, where each observation is assigned an equal weight .Compute
the predicted classification ,and apply weight to the observation in the learning sample that are inversely
proportional to the accuracy of the classification .
Meta –Learning .The concept of meta-learning applies to the area of predictive data-mining, to
combine the predictions from multiple models. It is particularly useful when the types of models included in the
project are very different. Stacking (Stacked Generalization) is use to combine the predictions from multiple
models. It is particularly useful when the types of models included in the project are very different. Experience
has shown that combining the prediction from multiple methods often yields more accurate predictions (Witten
& Frank , 2000).In stacking ,the prediction from different classifier are used as input into a meta-learner, which
attempts to combine the predictions to create a final best classification. So, for example, the predicted
classifications from the tree classifier, linear model, and the neural network classifier(s) can be used as input
variables into a neural network meta-classifier, which will attempt to learn from the data how to combine the
predictions from different models to yield maximum accuracy.
Stage 3: Deployment: The final stage involves using the model selected as best in the previous stage and
applying it to new data in order to generate prediction or estimates of expected outcome. It is also application of
a model for prediction or classification to new data. After a satisfactory model or set of models has been
identified (trained) for a particular application, one usually wants to deploy these models so that prediction or
predicted classifications can quickly be obtained for new data. For example, a credit card company may want to
deploy a trained model or set of models (e.g. neural network, meta- leaner) to quickly identify transactions
which have a high probability of being fraudulent. Census data are cleaned and reduced to give a good output
(Okeke, 2013).
Decision trees are one of the powerful tools for classification and prediction. The strength of decision
trees is due to the fact that, decision trees represent rules. Rules can readily be expressed so that human can
understand then or even directly used in a database access language like SQL so that records falling into a
particular category may be retrieved. A decision tree is a predictive modeling technique used to classify, cluster
and predict tasks (Gajendra, 2008). It uses “divide-and-conquer” technique to split the problem search space into
subsets.
For example, in marketing one has describe the customer segments to marketing professionals, so that
they can utilize this knowledge in launching a successful marketing campaign. These domain experts must
recognize and approve this discovered knowledge, and for this we need good descriptions. There are a variety of
algorithms for building decision trees that share the desirable quality of interpretability. Decision tree is a
classifier in the form of a tree structure, where root node and each internal node are labeled with question
(kwedlo, 2001). The arcs emanating from each node represent each possible answer to the associated question.
Each leaf node represents a prediction of a solution to the problem under construction.
4. Using Data-Mining Technique For Census Analysis To Give Geo-Spatial Distribution Of Nigeria.
www.iosrjournals.org 4 | Page
Figure 1.1 Decision tree algorithm predicting males and females
Results; this work achieved the goal of applying data-mining technique to the analysis of census data. The result
of this paper is a predictive attributes of a population to give geo-spatial distribution in Nigeria. For instance
based on marital status, sex, employment and unemployment etc in census database the model will predict
wealth of a nation. The effort yielded the possibility of implementing the IDE3 decision algorithm in building
decision trees from which attributes of a population can be predicted to give geo-spatial distribution.
II. Conclusion
Decision tree starts with a root node on which it is for users to take actions. From this node users split
each node recursively according to decision tree learning algorithm. Data-mining helps governments,
individuals, companies to uncover hidden patterns in large database which is used for development and
Geographic Information System (GIS) captures the data from IDE3 algorithm using census data as source of
input in development, stores it, manages it and give geo-spatial distribution needed.
Recommendations
Due to the possibility that the IDE3 algorithm pays attention to parts of the data that are irrelevant
(what is called over- fitting), it may perform less well on test set data. This work did not consider noise
compensation into consideration in the implementation of algorithm. Further work on this subject should bring
in techniques that avoids over-fitting .The initial definition of IDE3 is restricted in dealing with discrete sets of
values .It handles symbolic attributes effectively. In this work it was extended to handle numeric attributes (age
in this case).What was done in this work was discretize the attributes age to Boolean value. Further work should
do better by basing continuous attributes (numeric attributes) based on proper computation of information gain
threshold.
5. Using Data-Mining Technique For Census Analysis To Give Geo-Spatial Distribution Of Nigeria.
www.iosrjournals.org 5 | Page
References
[1]. Berry, M.J.A & Linoff (2000). Mastering Data-mining .Wiley Press: New York.
[2]. Crow, M.C &Giudici. (2003).Applied Data-mining :Statistical Method For Business And Industry. John Wiley and Sons .West
Sussex, England.
[3]. Folorunso, O. & Ogunde, A.O. (2004). Data-mining as a Technique for Knowledge in Business Process Redesign. The Electronic
Journal of Knowledge Management Volume 2 issue 1, pp, 33-44, available on line at www.ejkm.com .
[4]. Gajendra, S. (2008). Data-mining, Data-ware housing and OLAP. Kataria & sons: New Delhi.
[5]. Koh, Chye, H. & Kee, C.L (2004). Going concern prediction using Data-mining Techniques Managerial Auditing Journal, 19:3.
[6]. Kwedlo, W. & Kretowski, M. (2001). Learning Decision Rules using a Distributed Evolutionary Algorithm. Gdansk Press: Poland.
[7]. Mena, K.C (2005). Data mining and Statistics: Guild Form press: New York.
[8]. Pregibon,D.(1997).Data-mining “Statistical Computing and Graphics, pp 7-8.”
[9]. RedLands,C.A.(1990).Understanding GIS. Environmental System Research Institute Oxford University Press: New York.
[10]. Rambaldi, G., and J. Callosa (2000). Manual on Participatory 3-Dimensional Modeling fo Natural Resource Management (Volume 7).
NIPAP, PAWB-DENR: Philippines Department of Environment and Natural Resources.
[11]. Rhind's (2001): review of activities at the Experimental Cartographic Unit in the United Kingdom.
[12]. Sieber, R. (2000). 'Conforming (to) the Opposition: the Social Construction of Geographical Information Systems in Social
Movements.' International Journal of Geographical Information Science, 14(8): 775–793.