Downloaded 18 times
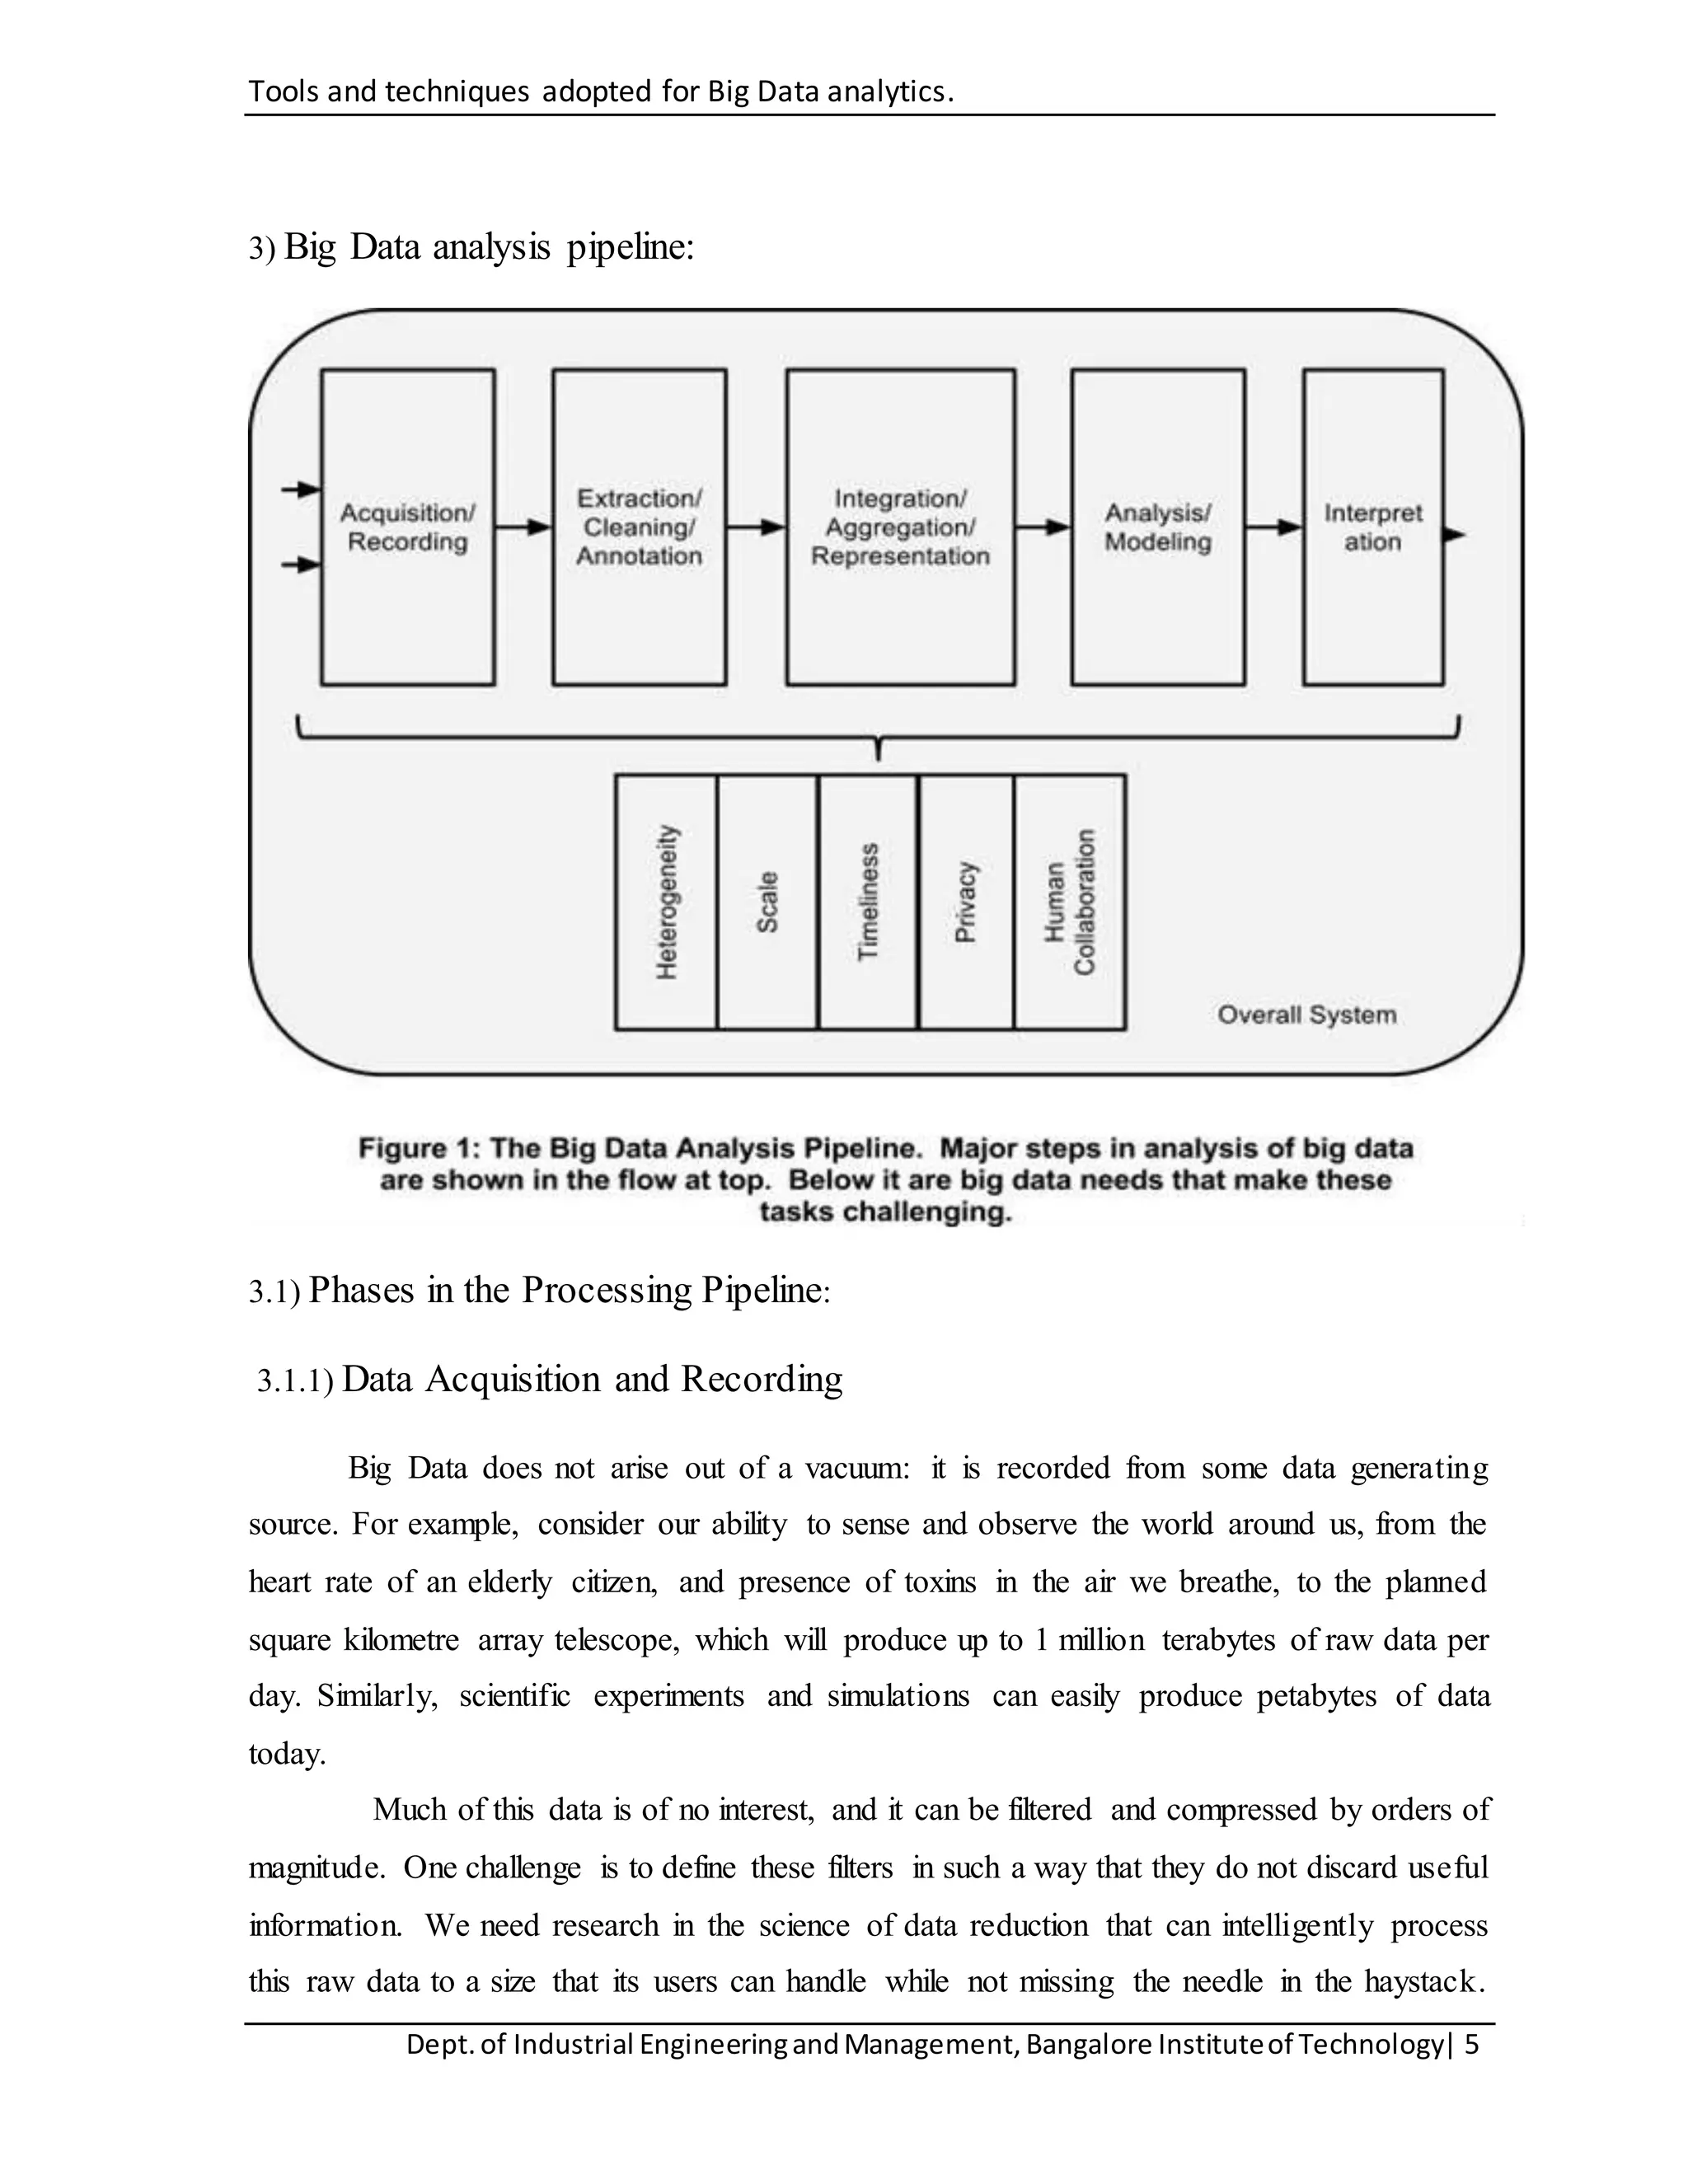

The document discusses tools and techniques for big data analytics, including A/B testing, crowdsourcing, machine learning, and data mining. It provides an overview of the big data analysis pipeline, including data acquisition, information extraction, integration and representation, query processing and analysis, and interpretation. The document also discusses fields where big data is relevant like industry, healthcare, and research. It analyzes tools like A/B testing, machine learning, and data mining techniques in more detail.


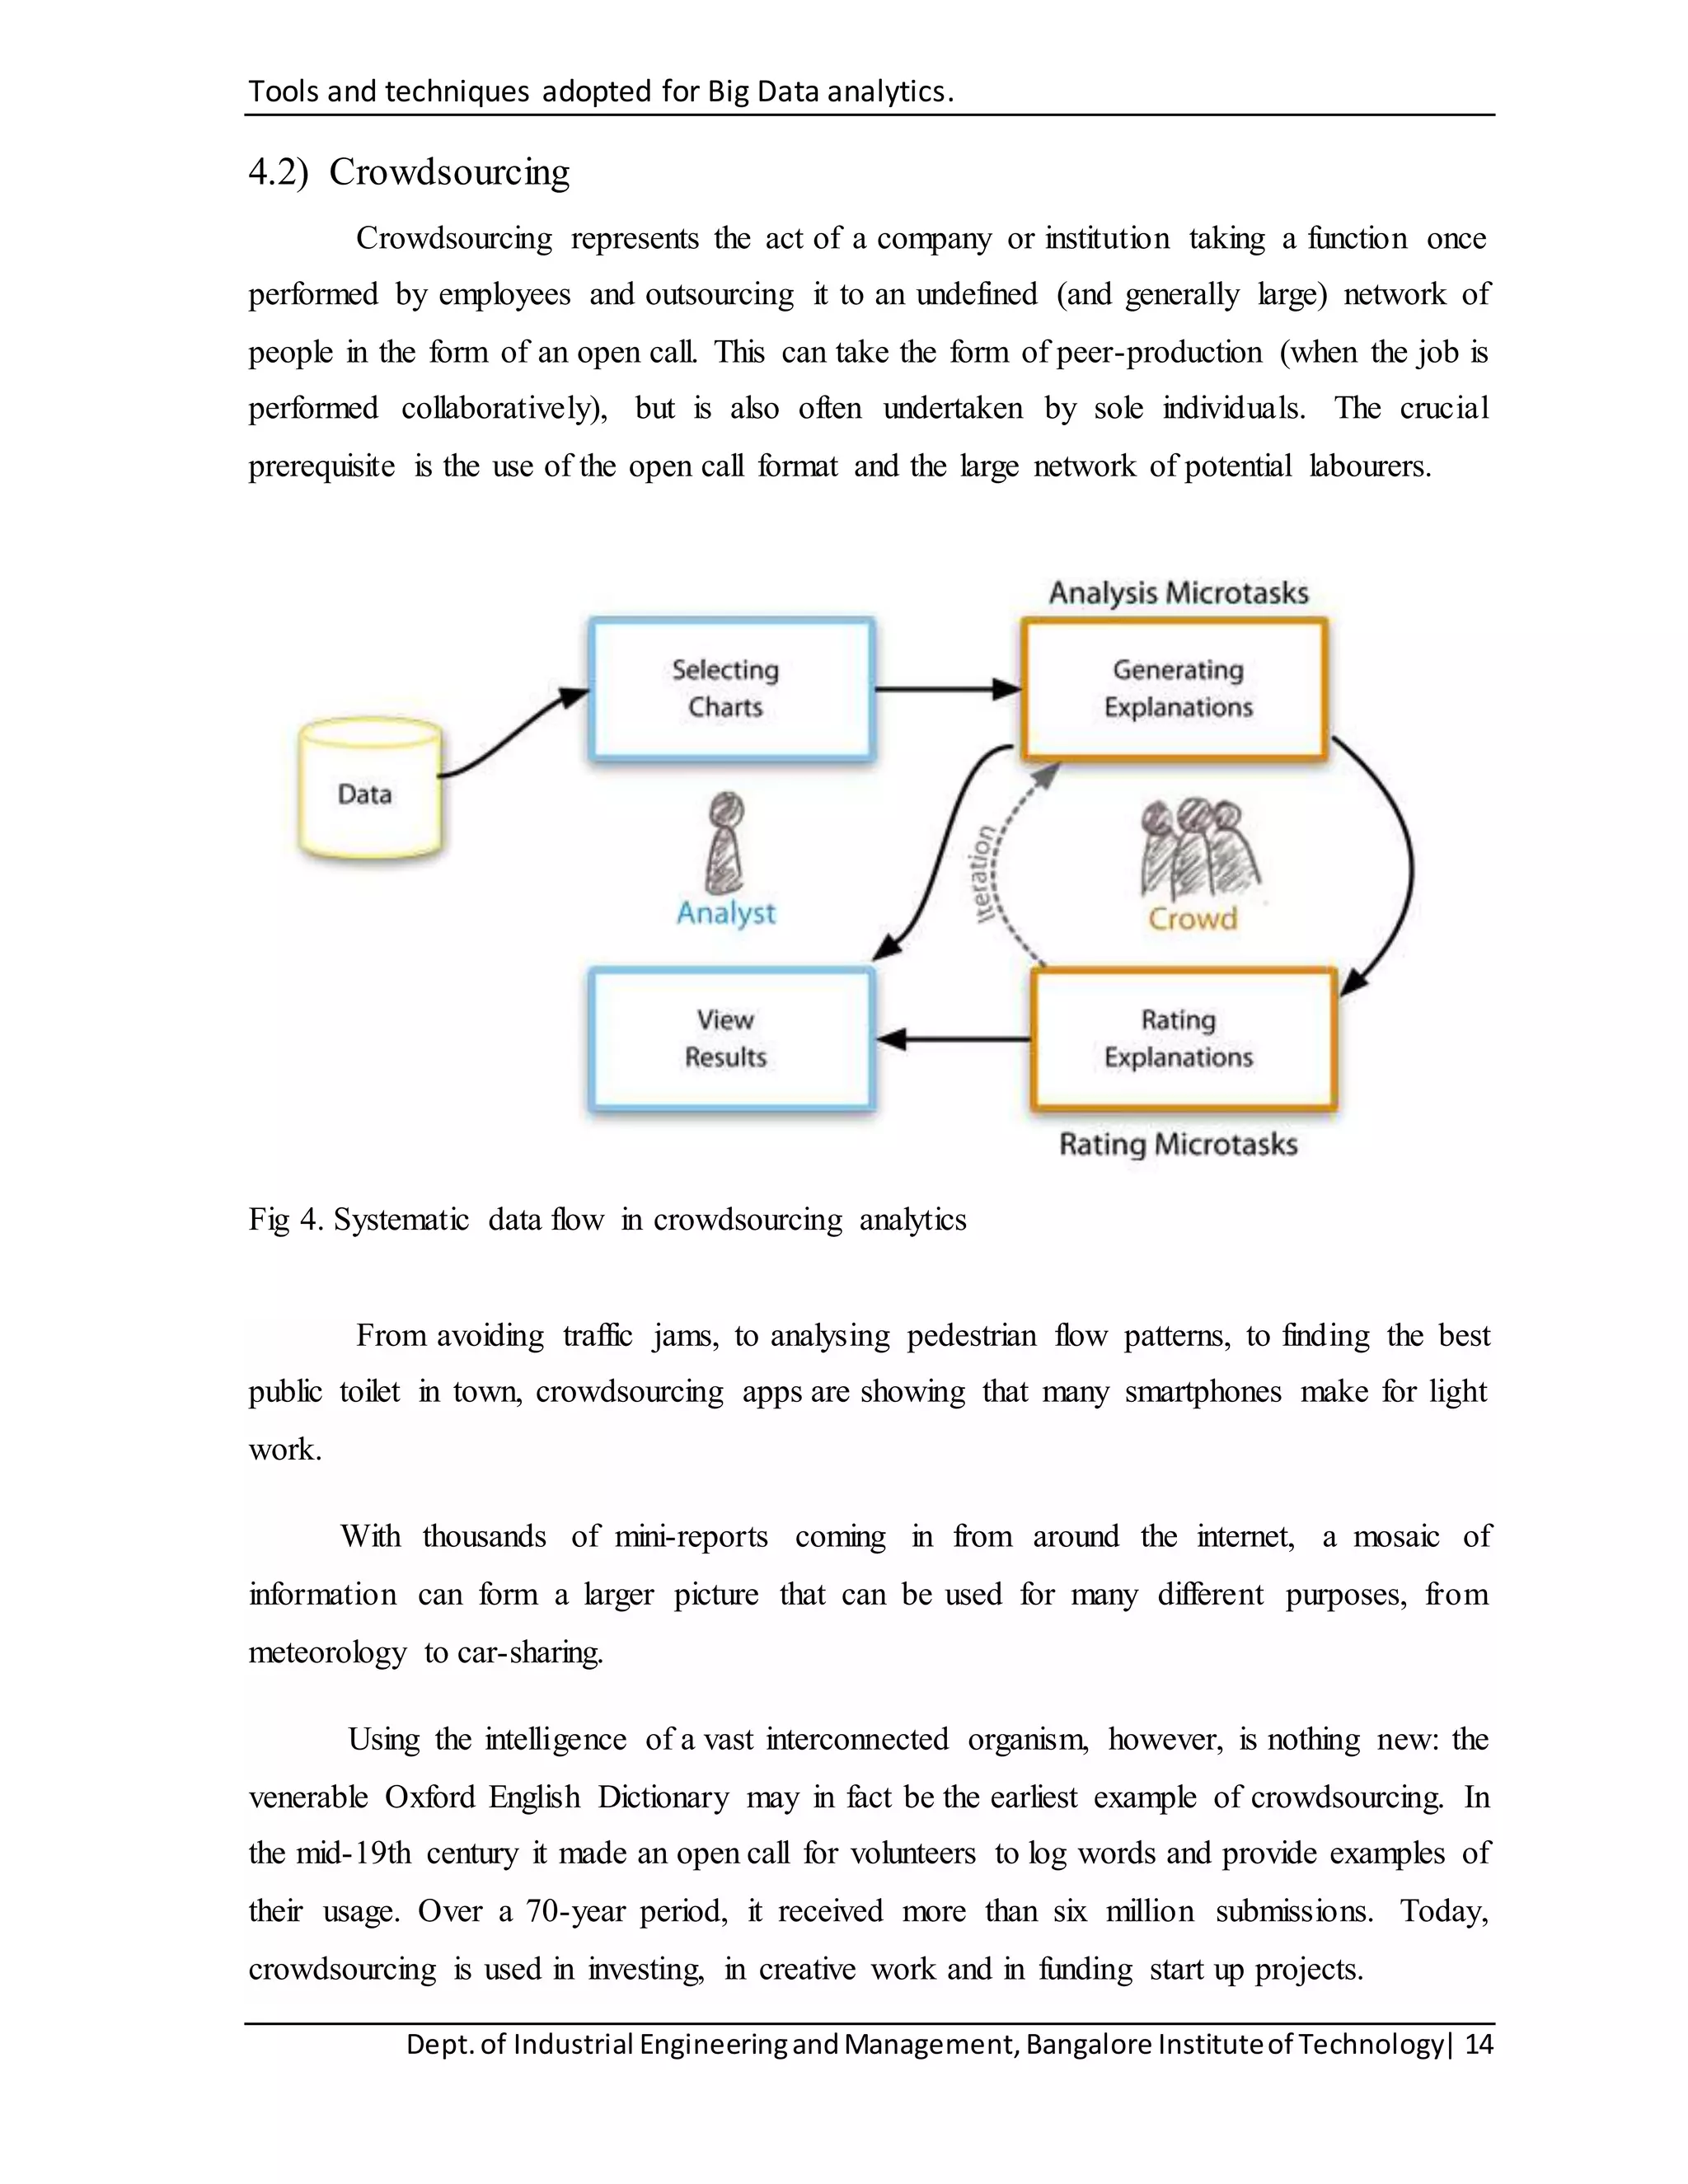
![[IJET-V1I3P10] Authors : Kalaignanam.K, Aishwarya.M, Vasantharaj.K, Kumaresan...](https://cdn.slidesharecdn.com/ss_thumbnails/ijet-v1i3p10-150608055552-lva1-app6892-thumbnail.jpg?width=640&height=640&fit=bounds)


![[IJCT-V3I2P32] Authors: Amarbir Singh, Palwinder Singh](https://cdn.slidesharecdn.com/ss_thumbnails/ijct-v3i2p32-160609071950-thumbnail.jpg?width=640&height=640&fit=bounds)


![[DSC Europe 25] Jim Sterne - Adopting Generative AI Capabilities Into the Ent...](https://cdn.slidesharecdn.com/ss_thumbnails/sxhpofuorcagxsaulkmt-3-251204082258-7e66bc48-thumbnail.jpg?width=640&height=640&fit=bounds)


![[DSC Europe 25] Dusan Jovicic - AI Story: From on-prem to cloud and back agai...](https://cdn.slidesharecdn.com/ss_thumbnails/8kp49m6uq22ifnbwhfnk-2-251205085715-964d11a6-thumbnail.jpg?width=640&height=640&fit=bounds)

![[DSC Europe 25] Petar Zivanov - AI meets documents From chatbots to AI-powere...](https://cdn.slidesharecdn.com/ss_thumbnails/xer2bb6nrdc8pdpev0pc-8-251204082258-7c2fa4a1-thumbnail.jpg?width=640&height=640&fit=bounds)


