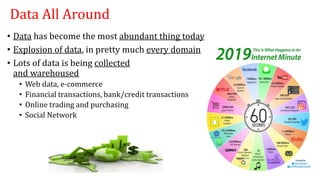
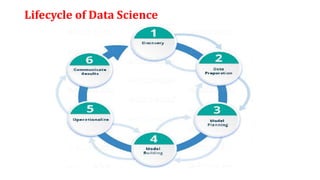
About
Evolution of Data, Data Science , Business Analytics, Applications, AI, ML, DL, Data science – Relationship, Tools for Data Science, Life cycle of data science with case study,
Algorithms for Data Science, Data Science Research Areas,
Future of Data Science.
How to Implement Data Governance Best PracticeDATAVERSITY
Data Governance Best Practice is defined as basis and guidelines for suggested governing activities. Organizations define best practices to be used as a point of comparison when determining their readiness, willingness and actions necessary to put a Data Governance program in place. But what are the best practices and how can they be implemented? This webinar will address these questions and more.
In this RWDG webinar, Bob Seiner will talk about how to create, validate, assess and implement Data Governance Best Practice with immediate impact on present and future Data Governance activities. The result of a Best Practice assessment is a thorough actionable plan focused on demonstrating value from your Data Governance program.This webinar will cover:
• Two Criteria for Data Governance Best Practice Development
• How to Assess against Best Practice to Build Program Success
• Examples of Industry Selected DG Best Practice
• How to Communicate DG Best Practice in a Non-Threatening Way
• How to Build DG Best Practice into Daily Operations
Data Science Training | Data Science For Beginners | Data Science With Python...Simplilearn
This Data Science presentation will help you understand what is Data Science, who is a Data Scientist, what does a Data Scientist do and also how Python is used for Data Science. Data science is an interdisciplinary field of scientific methods, processes, algorithms and systems to extract knowledge or insights from data in various forms, either structured or unstructured, similar to data mining. This Data Science tutorial will help you establish your skills at analytical techniques using Python. With this Data Science video, you’ll learn the essential concepts of Data Science with Python programming and also understand how data acquisition, data preparation, data mining, model building & testing, data visualization is done. This Data Science tutorial is ideal for beginners who aspire to become a Data Scientist.
This Data Science presentation will cover the following topics:
1. What is Data Science?
2. Who is a Data Scientist?
3. What does a Data Scientist do?
This Data Science with Python course will establish your mastery of data science and analytics techniques using Python. With this Python for Data Science Course, you’ll learn the essential concepts of Python programming and become an expert in data analytics, machine learning, data visualization, web scraping and natural language processing. Python is a required skill for many data science positions, so jumpstart your career with this interactive, hands-on course.
Why learn Data Science?
Data Scientists are being deployed in all kinds of industries, creating a huge demand for skilled professionals. A data scientist is the pinnacle rank in an analytics organization. Glassdoor has ranked data scientist first in the 25 Best Jobs for 2016, and good data scientists are scarce and in great demand. As a data you will be required to understand the business problem, design the analysis, collect and format the required data, apply algorithms or techniques using the correct tools, and finally make recommendations backed by data.
You can gain in-depth knowledge of Data Science by taking our Data Science with python certification training course. With Simplilearn’s Data Science certification training course, you will prepare for a career as a Data Scientist as you master all the concepts and techniques. Those who complete the course will be able to:
1. Gain an in-depth understanding of data science processes, data wrangling, data exploration, data visualization, hypothesis building, and testing. You will also learn the basics of statistics.
Install the required Python environment and other auxiliary tools and libraries
2. Understand the essential concepts of Python programming such as data types, tuples, lists, dicts, basic operators and functions
3. Perform high-level mathematical computing using the NumPy package and its largelibrary of mathematical functions.
Learn more at: https://www.simplilearn.com
While mathematicians have used graph theory since the 18th century to solve problems, the software patterns for graph data are new to most developers. To enable "mass adoption" of graph technology, we need to establish the right abstractions, access APIs, and data models.
RDF triples, while of paramount importance in establishing RDF graph semantics, are a low-level abstraction, much like using assembly language. For practical and productive “graph programming” we need something different.
Similarly, existing declarative graph query languages (such as SPARQL and Cypher) are not always the best way to access graph data, and sometimes you need a simpler interface (e.g., GraphQL), or even a different approach altogether (e.g., imperative traversals such as with Gremlin).
Ora Lassila is a Principal Graph Technologist in the Amazon Neptune graph database group. He has a long experience with graphs, graph databases, ontologies, and knowledge representation. He was a co-author of the original RDF specification as well as a co-author of the seminal article on the Semantic Web.
A 3 day examination preparation course including live sitting of examinations for students who wish to attain the DAMA Certified Data Management Professional qualification (CDMP)
chris.bradley@dmadvisors.co.uk
Data Modelling 101 half day workshop presented by Chris Bradley at the Enterprise Data and Business Intelligence conference London on November 3rd 2014.
Chris Bradley is a leading independent information strategist.
Contact chris.bradley@dmadvisors.co.uk
Targeting towards the health and human services communities, this presentation covers the importance of a data-driven culture, how to identify areas where data can be used to innovate and how to recognize the operational processes you must have in place to fully utilize your data.
RWDG Slides: A Complete Set of Data Governance Roles & ResponsibilitiesDATAVERSITY
Roles and responsibilities are the backbone to a successful Data Governance program. The way you define and utilize the roles will be the biggest factor of program success. From Data Stewards to the steering committee and everyone in between, people will need to understand the role they play, why they are in the role and how the role fits in with their existing job.
Join Bob Seiner for this RWDG webinar where he will provide a complete and detailed set of Data Governance roles and responsibilities. Bob will share an Operating Model of Roles and Responsibilities that can be customized to address the specific needs of your organization.
In this webinar, Bob will discuss:
- Executive, Strategic, Tactical, Operational, and Support Level Roles
- How to customize an Operating Model to fit your organization
- Detailed Responsibilities for each level
- Defining who participates at each level
- Using working teams to implement tactical solutions
John Easton, Director of Product Management & Strategic Relations at Maximizer and Craig Vivier from Vineyardsoft Corporation provide an overview of how to transform your business into a data driven organization.
A data-driven organization is one in which critical business data automatically drives the decisions and actions of your business. It is about giving voice to your data with the goal of moving away from wading through volumes of reports or making decisions on gut feel.
Learn to Use Databricks for the Full ML LifecycleDatabricks
Machine learning development brings many new complexities beyond the traditional software development lifecycle. Unlike traditional software development, ML developers want to try multiple algorithms, tools and parameters to get the best results, and they need to track this information to reproduce work. In addition, developers need to use many distinct systems to productionize models. In this talk, learn how to operationalize ML across the full lifecycle with Databricks Machine Learning.
Got data?… now what? An introduction to modern data platformsJamesAnderson599331
What are Data Analytics Platforms? What decision points are necessary in creating a modern, unified analytics data platform? What benefits are there to building your analytics data platform on Google Cloud Platform? Susan Pierce walks us through it all.
Azure Synapse Analytics is Azure SQL Data Warehouse evolved: a limitless analytics service, that brings together enterprise data warehousing and Big Data analytics into a single service. It gives you the freedom to query data on your terms, using either serverless on-demand or provisioned resources, at scale. Azure Synapse brings these two worlds together with a unified experience to ingest, prepare, manage, and serve data for immediate business intelligence and machine learning needs. This is a huge deck with lots of screenshots so you can see exactly how it works.
BI Consultancy - Data, Analytics and StrategyShivam Dhawan
The presentation describes my views around the data we encounter in digital businesses like:
- Looking at common Data collection methodologies,
-What are the common issues within the decision support system and optimiztion lifecycle,
- Where are most of failing?
and most importantly, "How to connect the dots and move from Data to Strategy?"
I work with all facets of Web Analytics and Business Strategy and see the structures and governance models of various domains to establish and analyze the key performance indicators that allow you to have a 360º overview of online and offline multi-channel environment.
Apart from my experience with the leading analytic tools in the market like Google Analytics, Omniture and BI tools for Big Data, I am developing new solutions to solve complex digital / business problems.
As a resourceful consultant, I can connect with your team in any modality or in any form that meets your needs and solves any data/strategy problem.
Tackling Data Quality problems requires more than a series of tactical, one-off improvement projects. By their nature, many Data Quality problems extend across and often beyond an organization. Addressing these issues requires a holistic architectural approach combining people, process, and technology. Join Nigel Turner and Donna Burbank as they provide practical ways to control Data Quality issues in your organization.
Look no further than our comprehensive Data Science Training program in Chandigarh. Designed to equip individuals with the skills and knowledge required to thrive in today's data-centric world, our course offers a unique blend of theoretical foundations and hands-on practical experience.
This presentation is prepared by one of our renowned tutor "Suraj"
If you are interested to learn more about Big Data, Hadoop, data Science then join our free Introduction class on 14 Jan at 11 AM GMT. To register your interest email us at info@uplatz.com
In this presentation, let's have a look at What is Data Science and it's applications. We discussed most common use cases of Data Science.
I presented this at LSPE-IN meetup happened on 10th March 2018 at Walmart Global Technology Services.
Data Science - An emerging Stream of Science with its Spreading Reach & ImpactDr. Sunil Kr. Pandey
This is my presentation on the Topic "Data Science - An emerging Stream of Science with its Spreading Reach & Impact". I have compiled and collected different statistics and data from different sources. This may be useful for students and those who might be interested in this field of Study.
The slide aids to understand and provide insights on the following topics,
* Overview for Data Science
* Definition of Data and Information
* Types of Data and Representation
* Data Value Chain - [ Data Acquisition; Data Analysis; Data Curating; Data Storage; Data Usage ]
* Basic concepts of Big Data
Defining Data Science
• What Does a Data Science Professional Do?
• Data Science in Business
• Use Cases for Data Science
• Installation of R and R studio
Advanced Analytics and Data Science ExpertiseSoftServe
An overview of SoftServe's Data Science service line.
- Data Science Group
- Data Science Offerings for Business
- Machine Learning Overview
- AI & Deep Learning Case Studies
- Big Data & Analytics Case Studies
Visit our website to learn more: http://www.softserveinc.com/en-us/
Read| The latest issue of The Challenger is here! We are thrilled to announce that our school paper has qualified for the NATIONAL SCHOOLS PRESS CONFERENCE (NSPC) 2024. Thank you for your unwavering support and trust. Dive into the stories that made us stand out!
Acetabularia Information For Class 9 .docxvaibhavrinwa19
Acetabularia acetabulum is a single-celled green alga that in its vegetative state is morphologically differentiated into a basal rhizoid and an axially elongated stalk, which bears whorls of branching hairs. The single diploid nucleus resides in the rhizoid.
June 3, 2024 Anti-Semitism Letter Sent to MIT President Kornbluth and MIT Cor...Levi Shapiro
Letter from the Congress of the United States regarding Anti-Semitism sent June 3rd to MIT President Sally Kornbluth, MIT Corp Chair, Mark Gorenberg
Dear Dr. Kornbluth and Mr. Gorenberg,
The US House of Representatives is deeply concerned by ongoing and pervasive acts of antisemitic
harassment and intimidation at the Massachusetts Institute of Technology (MIT). Failing to act decisively to ensure a safe learning environment for all students would be a grave dereliction of your responsibilities as President of MIT and Chair of the MIT Corporation.
This Congress will not stand idly by and allow an environment hostile to Jewish students to persist. The House believes that your institution is in violation of Title VI of the Civil Rights Act, and the inability or
unwillingness to rectify this violation through action requires accountability.
Postsecondary education is a unique opportunity for students to learn and have their ideas and beliefs challenged. However, universities receiving hundreds of millions of federal funds annually have denied
students that opportunity and have been hijacked to become venues for the promotion of terrorism, antisemitic harassment and intimidation, unlawful encampments, and in some cases, assaults and riots.
The House of Representatives will not countenance the use of federal funds to indoctrinate students into hateful, antisemitic, anti-American supporters of terrorism. Investigations into campus antisemitism by the Committee on Education and the Workforce and the Committee on Ways and Means have been expanded into a Congress-wide probe across all relevant jurisdictions to address this national crisis. The undersigned Committees will conduct oversight into the use of federal funds at MIT and its learning environment under authorities granted to each Committee.
• The Committee on Education and the Workforce has been investigating your institution since December 7, 2023. The Committee has broad jurisdiction over postsecondary education, including its compliance with Title VI of the Civil Rights Act, campus safety concerns over disruptions to the learning environment, and the awarding of federal student aid under the Higher Education Act.
• The Committee on Oversight and Accountability is investigating the sources of funding and other support flowing to groups espousing pro-Hamas propaganda and engaged in antisemitic harassment and intimidation of students. The Committee on Oversight and Accountability is the principal oversight committee of the US House of Representatives and has broad authority to investigate “any matter” at “any time” under House Rule X.
• The Committee on Ways and Means has been investigating several universities since November 15, 2023, when the Committee held a hearing entitled From Ivory Towers to Dark Corners: Investigating the Nexus Between Antisemitism, Tax-Exempt Universities, and Terror Financing. The Committee followed the hearing with letters to those institutions on January 10, 202
Synthetic Fiber Construction in lab .pptxPavel ( NSTU)
Synthetic fiber production is a fascinating and complex field that blends chemistry, engineering, and environmental science. By understanding these aspects, students can gain a comprehensive view of synthetic fiber production, its impact on society and the environment, and the potential for future innovations. Synthetic fibers play a crucial role in modern society, impacting various aspects of daily life, industry, and the environment. ynthetic fibers are integral to modern life, offering a range of benefits from cost-effectiveness and versatility to innovative applications and performance characteristics. While they pose environmental challenges, ongoing research and development aim to create more sustainable and eco-friendly alternatives. Understanding the importance of synthetic fibers helps in appreciating their role in the economy, industry, and daily life, while also emphasizing the need for sustainable practices and innovation.
A Strategic Approach: GenAI in EducationPeter Windle
Artificial Intelligence (AI) technologies such as Generative AI, Image Generators and Large Language Models have had a dramatic impact on teaching, learning and assessment over the past 18 months. The most immediate threat AI posed was to Academic Integrity with Higher Education Institutes (HEIs) focusing their efforts on combating the use of GenAI in assessment. Guidelines were developed for staff and students, policies put in place too. Innovative educators have forged paths in the use of Generative AI for teaching, learning and assessments leading to pockets of transformation springing up across HEIs, often with little or no top-down guidance, support or direction.
This Gasta posits a strategic approach to integrating AI into HEIs to prepare staff, students and the curriculum for an evolving world and workplace. We will highlight the advantages of working with these technologies beyond the realm of teaching, learning and assessment by considering prompt engineering skills, industry impact, curriculum changes, and the need for staff upskilling. In contrast, not engaging strategically with Generative AI poses risks, including falling behind peers, missed opportunities and failing to ensure our graduates remain employable. The rapid evolution of AI technologies necessitates a proactive and strategic approach if we are to remain relevant.
Embracing GenAI - A Strategic ImperativePeter Windle
Artificial Intelligence (AI) technologies such as Generative AI, Image Generators and Large Language Models have had a dramatic impact on teaching, learning and assessment over the past 18 months. The most immediate threat AI posed was to Academic Integrity with Higher Education Institutes (HEIs) focusing their efforts on combating the use of GenAI in assessment. Guidelines were developed for staff and students, policies put in place too. Innovative educators have forged paths in the use of Generative AI for teaching, learning and assessments leading to pockets of transformation springing up across HEIs, often with little or no top-down guidance, support or direction.
This Gasta posits a strategic approach to integrating AI into HEIs to prepare staff, students and the curriculum for an evolving world and workplace. We will highlight the advantages of working with these technologies beyond the realm of teaching, learning and assessment by considering prompt engineering skills, industry impact, curriculum changes, and the need for staff upskilling. In contrast, not engaging strategically with Generative AI poses risks, including falling behind peers, missed opportunities and failing to ensure our graduates remain employable. The rapid evolution of AI technologies necessitates a proactive and strategic approach if we are to remain relevant.
Normal Labour/ Stages of Labour/ Mechanism of LabourWasim Ak
Normal labor is also termed spontaneous labor, defined as the natural physiological process through which the fetus, placenta, and membranes are expelled from the uterus through the birth canal at term (37 to 42 weeks
Exploiting Artificial Intelligence for Empowering Researchers and Faculty, In...Dr. Vinod Kumar Kanvaria
Exploiting Artificial Intelligence for Empowering Researchers and Faculty,
International FDP on Fundamentals of Research in Social Sciences
at Integral University, Lucknow, 06.06.2024
By Dr. Vinod Kumar Kanvaria
The French Revolution, which began in 1789, was a period of radical social and political upheaval in France. It marked the decline of absolute monarchies, the rise of secular and democratic republics, and the eventual rise of Napoleon Bonaparte. This revolutionary period is crucial in understanding the transition from feudalism to modernity in Europe.
For more information, visit-www.vavaclasses.com
1. Data science andbusiness analytics
Dr.M.Inbavalli
Vice Principal & Head Research Department of Computer Science
Marudhar Kesari Jain College for Women
Vaniyambadi-635751
2. Overview
• Evolution of Data
• Data Science
• Business Analytics
• Applications
• AI, ML, DL, Data science – Relationship
• Tools for Data Science
• Life cycle of data science with case study
• Algorithms for Data Science
• Data Science Research Areas
• Future of Data Science
3. Data All Around
• Data has become the most abundant thing today
• Explosion of data, in pretty much every domain
• Lots of data is being collected
and warehoused
• Web data, e-commerce
• Financial transactions, bank/credit transactions
• Online trading and purchasing
• Social Network
4. •Data All Around
• Sensing devices and sensor networks that can monitor everything 24/7 from
temperature to pollution to vital signs
• Increasingly sophisticated smart phones
• Internet, social networks makes it easy to publish data
• Scientific experiments and simulations produce astronomical volumes of data
• Internet of Things(IOT)
• Dataification: taking all aspects of life and turning them into data (e.g., what you
like/enjoy has been turned into a stream of your "likes")
8. • How Much Data Do We have?
• Data volumes expected to get much worse
• Over 2.5 quintillion bytes of data are created every single day.
9. How Much Data Do We have?
What can you do with the Traffic Prediction data?
9
Crowdsourcing + physical modeling + sensing + data assimilation
From Institute for Transportation Studies
10. • How to handle that data?
• Data is just like crude oil. It’s valuable, but if unrefined it cannot really be
used. It has to be changed into gas, plastic, chemicals, etc to create a
valuable entity that drives profitable activity; so data must be broken
down, analyzed for it to have value.
• How to extract interesting actionable insights and scientific knowledge?
11. •Data Science why excitement?
• Data Science is the science
which uses computer science, statistics
and machine learning, visualization
and human-computer interactions to
collect, clean, integrate, analyze,
visualize, interact with data to create
data products.
• Turn data into data products.
12. • Data Science why excitement?
Theories and techniques from many fields and disciplines are used to
investigate and analyze a large amount of data to help decision
makers in many industries such as science, engineering, economics,
politics, finance, and education
Computer Science
Pattern recognition, visualization, data warehousing, High performance computing,
Databases, AI
Mathematics
Mathematical Modeling
Statistics
Statistical and Stochastic modeling, Probability.
Data science (DS) is a multidisciplinary field of study with goal
to address the challenges in big data
13. • Data Science why excitement?(cont)
• Data Science blend of tools, algorithms, and machine learning principles with the goal to discover
hidden patterns from the raw data.
• focus on statistical modeling, machine learning, management and analysis of data sets, and data
acquisition.
• Data Science makes use of several statistical procedures
• These procedures range from data transformations, data modeling, statistical operations
(descriptive and inferential statistics) and machine learning modeling.
• In order to gain predictive responses from the models, it is an essential requirement to understand
the underlying patterns of the data model. Furthermore, optimization techniques can be utilized to
meet the business requirements of the user.
14. •Data Science why excitement?(cont)
• Using various statistical tools, a Data Scientist has to develop models. With the help of
these models, they help their clients in the decision-making process. Furthermore,
these models support demand generation initiatives.
Data Science also covers:
• Data Integration.
• Distributed Architecture.
• Automating Machine learning.
• Data Visualization.
• Dashboards and BI.
• Data Engineering.
• Deployment in production mode
• Automated, data-driven decisions.
15. Example Search
• Google revenue around $50 bn/year from marketing, 97% of the companies
revenue.
• Sponsored search uses an action – a pure competition for marketers trying to
win access to consumers.
• In other words, a competition for models of consumers – their likelihood of
responding to the ad – and of determining the right bid for the item.
• There are around 30 billion search requests a month. Perhaps a trillion events
of history between search providers.
• Google Adwords and Adsense
16. Data Science Applications
• Transaction Databases Recommender systems (NetFlix), Fraud Detection
(Security and Privacy)
• Wireless Sensor Data Smart Home, Real-time Monitoring, Internet of Things
• Text Data, Social Media Data Product Review and Consumer Satisfaction
(Facebook, Twitter, LinkedIn), E-discovery
• Software Log Data Automatic Trouble Shooting (Splunk)
• Genotype and Phenotype Data Epic, 23andme, Patient-Centered Care,
Personalized Medicine
17. • Other Applications
• Bank -make smarter decisions through fraud detection, management of
customer data, risk modeling, real-time predictive analytics, customer
segmentation, etc.
• In case of fraud detection -- a credit card, insurance, and accounting.
• able to analyze investment patterns and cycles of customers and suggest you
several offers that suit you accordingly.
• ability to risk modeling through data science through which they can assess their
overall performance.
• In real-time and predictive analytics, banks use machine learning algorithms to
improve their analytics strategy
18. Other Applications
• customer sentiment analysis techniques
can boost the social media interaction, boost their feedback and analyze
customer reviews.
Manufacturing-IOT
enabled the companies to predict potential problems, monitor systems
and analyze the continuous stream of data.
Uber is using data science for price optimization and providing better
experiences to their customers.
Using powerful predictive tools, they accurately predict the price based
on parameters like a weather pattern, availability of transport,
customers, etc.
19. Data
• Measureable units of information gathered or captured from activity of people, places
and things.
• data is generated from different sources like financial logs, text files, multimedia forms,
sensors, and instruments.
• need to understand
• which data to use
• how to organize the data, and so on.
• prepare the structured, and the unstructured data to be used by the Analytics team for
model building purpose.
• Types of Data
• Relational Data (Tables/Transaction/Legacy Data)
• Text Data (Web)
• Semi-structured Data (XML)
• Graph Data
• Social Network, Semantic Web (RDF), …
• Streaming Data
20. What do we do with the Data ?
• Aggregation and Statistics
• Data warehousing and OLAP
• Indexing, Searching, and Querying
• Keyword based search
• Pattern matching (XML/RDF)
• Knowledge discovery
• Data Mining
• Statistical Modeling
• Example –Data Science
• Companies learn your secrets, shopping patterns, and preferences
• Eg. can we know if a child likes animation games , even if they doesn’t
want us to know?
• Building, and maintain a Data warehouse is a key skill which a Data
Engineer must have.
21. • They build pipelines which extract data from multiple sources and then manipulates
it to make it usable.
• Business analytics (BA) is the practice of iterative, methodical exploration of an
organization's data, with an emphasis on statistical analysis.
Business analytics is used by companies committed to data-driven decision-making.
• BA activities must be anchored to a strategically relevant business question to be
answered by using data analysis.
22. • Data Science and Business Analytics
• Data science or analytics is the process of deriving insights from data in order to
make optimal decisions.
• data science and analytics techniques such as basic statistics, regressions, simulation
and optimization modeling, data mining and machine learning, text analytics,
artificial intelligence and visualizations.
• Data science focuses on data modelling and data warehousing to track the ever-
growing data set. The information extracted through data science applications are
used to guide business processes and reach organisational goals.
23.
24. Databases Data Science
Data Volume Modest Massive
Examples Bank records,
Personnel records,
Census,
Medical records
Online clicks,
GPS logs,
Tweets,
Building sensor readings
Priorities Consistency,
Error recovery,
Auditability
Speed,
Availability,
Query richness
Structured Strongly (Schema) Weakly or none (Text)
Properties Transactions, ACID* CAP* theorem (2/3),
eventual consistency
Realizations SQL NoSQL:
MongoDB, CouchDB,
Hbase, Cassandra, Riak, Memcached,
Apache River, …
25. Features Business Intelligence (BI) Data Science
Data Sources
Structured
(Usually SQL, often Data Warehouse)
Both Structured and Unstructured
( logs, cloud data, SQL, NoSQL, text)
Approach Statistics and Visualization
Statistics, Machine Learning, Graph Analysis,
Neuro- linguistic Programming (NLP)
Focus Past and Present Present and Future
Tools Pentaho, Microsoft BI, QlikView, R Rapid Miner, BigML, Weka, R
26.
27.
28. Data Science ML AI
Tools -1. SAS2. Tableau3. Apache
Spark4. MATLAB, SQL,
1. Amazon Lex2. IBM Watson
Studio3. Microsoft Azure ML Studio
1.TensorFlow2. Scikit Learn
3. Keras, Amazon lex, Google cloud
platform, Data robot.
Data Science deals with structured
and unstructured data.
Machine Learning uses statistical
models.
Artificial Intelligence uses logic and
decision trees.
Fraud Detection and Healthcare
analysis are popular examples of
Data Science.
Recommendation Systems such as
Spotify, and Facial Recognition are
popular examples.
Chatbots, and Voice assistants are
popular applications of AI.
The main applications of Data
Science are credit card fraud, ATM
theft, disease prediction, pattern
identification etc.
The main applications of machine
learning are Online recommender
system, Google search
algorithms, Facebook auto friend
tagging suggestions, etc.
The main applications of AI are Siri,
customer support using catboats,
Expert System, Online game playing,
intelligent humanoid robot, etc.
29. • Relationship between Data Science, Artificial Intelligence and Machine
Learning
• Machine Learning for Predictive Reporting
• to study transactional data to make valuable predictions .
• Also known as supervised learning
• implemented to suggest the most effective courses of action for any company.
Machine Learning for Pattern Discovery
• set parameters in various data reports
• unsupervised learning where there are no pre-decided parameters.
Artificial Intelligence represents an action planned feedback of
perception.
Perception > Planning > Action > Feedback of Perception
Data Science uses different parts of this pattern or loop to solve specific
problems
30. • For instance, in the first step, i.e. Perception,
• data scientists try to identify patterns with the help of the data.
• planning, there are two aspects:
• Finding all possible solutions
• Finding the best solution among all solutions
• machine learning by taking it as a standalone subject- understood in the context
of its environment.
AI is the tool that helps data science get results and the solutions for specific
problems. However, machine learning is what helps in achieving that goal
Example : Google’s search engine is a product of data science
It uses predictive analysis, a system used by artificial intelligence, to deliver
intelligent results to the users
31.
32. • Tools for Data Science
• Reporting and Business Intelligence
• Predictive Modelling and Machine Learning
• Artificial Intelligence
• Data Science Tools for Big Data(Volume)
• Data 1GB to 10 GB - Traditional DB Excel, Access, SQl etc.
• >10 GB – Haddop, Hive
• Tools for Handling Variety
33. • Voluminous
• customer feedback may vary in length, sentiments, and other factors.
• Example for SQL are Oracle, MySQL, SQLite, whereas NoSQL consists of popular
databases like MongoDB, Cassandra, etc.
• These NoSQL databases are seeing huge adoption numbers because of their ability
to scale and handle dynamic data.
.
34. • Tools for Handling Velocity
• speed at which the data is captured.
• includes both real-time and non-real-time data.
• Example for realtime data
• sensor data collected by self-driving cars- automatic actions
• CCTV
• Stock trading
• Fraud detection for credit card transaction
• Network data – social media (Facebook, Twitter, etc.)
Tools -Apache Kafka- real-time data pipelines.
Apache Storm- process up to 1 Million tuples per second and it is highly scalable
Amazon Kinesis-Licensed and powerful
Apache Flink- high performance, fault tolerance, and efficient memory
management.
35. Reporting and BI Tools Predictive Analytics and
Machine Learning Tools
Frameworks for Deep
Learning
AI Tools
Excel, QlikView, Tableau ,
Microstrategy, powerBI,
Google
Analytics,Dundas,SISENSE
etc
Python , R, Apache spark,
Julia, Jupyter Notebooks
TensorFlow, Pytroch,
Keras and Caffe
AutoKeras, Google Cloud
AutoML, IBM Watson,
DataRobot, H20’s Driverless
AI, and Amazon’s Lex
SAS, SPSS,MATLAB- Licensed
37. • Role of Data Scientist
• Identifying the data-analytics problems that offer the greatest opportunities to the
organization
• Determining the correct data sets and variables
• Collecting large sets of structured and unstructured data from disparate sources
• Cleaning and validating the data to ensure accuracy, completeness, and uniformity
• Devising and applying models and algorithms to mine the stores of big data
• Analyzing the data to identify patterns and trends
• Interpreting the data to discover solutions and opportunities
• Communicating findings to stakeholders using visualization and other means
38. • Phase 1—Discovery
• various specifications, requirements, priorities and required budget.
• the ability to ask the right questions.
• need to frame the business problem and formulate initial hypotheses (IH) to test.
• Phase 2—Data preparation
• data cleaning, transformation, and visualization. This will help you to spot the outliers
and establish a relationship between the variables.----R
• Phase 3—Model planning
• methods and techniques to draw the relationships between variables
• These relationships will set the base for the algorithms in next phase
• apply Exploratory Data Analytics (EDA) using various statistical formulas and
visualization tools.
39. • R has a complete set of modeling capabilities and provides a good environment for
building interpretive models.
• SQL Analysis services can perform in-database analytics using common data mining
functions and basic predictive models.
• SAS/ACCESS can be used to access data from Hadoop and is used for creating
repeatable and reusable model flow diagrams.
40. • Phase 4—Model building
• develop datasets for training and testing purposes
• various learning techniques like classification, association and clustering to build the
model.
Example :
1. Classification (decision trees)
2. Clustering (K-means, Fuzzy C-means, Hierarchical Clustering, DBSCAN)
3. Association rules
4. Advanced supervised machine learning algorithms (Naive Bayes, k-NN, SVM)
5. Intro to ensemble learning algorithms (Random Forest, Gradient Boosting)
41.
42. • Phase 5—Operationalize
• Analyzing the data to identify patterns and trends
• Interpreting results
• deliver final reports, briefings, code and technical documents
• pilot project
• Phase 6—Communicate results
• identify all the key findings, communicate to the stakeholders and determine if the
results of the project are a success or a failure
43. • Basic statistics
• 1. Random variables, sampling
• 2. Distributions and statistical measures
• 3. Hypothesis testing
Overview of linear algebra
1. Linear algebra and matrix computations
2. Functions, derivatives, convexity
Modeling techniques regression
1. Mathematical modeling process 2. Linear regression 3. Logistic regression
• Data visualization and visual analytics
• 1. Visual analytics 2. Visualizations in Python and visual analytics in IBM Watson Analytics
44. • Data visualization and visual analytics
• 1. Visual analytics 2. Visualizations in Python and visual analytics in IBM Watson
Analytics
• Data mining and machine learning
• 1. Classification (decision trees) 2. Clustering (K-means, Fuzzy C-means,
Hierarchical Clustering, DBSCAN) 3. Association rules 4. Advanced supervised
machine learning algorithms (Naive Bayes, k-NN, SVM) 5. Intro to ensemble
learning algorithms (Random Forest, Gradient Boosting)
• Simulation modeling 1. Random number generation 2. Monte Carlo simulations 3.
Simulation in Ipython
45. • Real time example
• Case Study: Diabetes Prevention
• What if we could predict the occurrence of diabetes and take appropriate
measures beforehand to prevent it?
• 1. You can refer to the sample data below.
• Step 1: Discovery
• Attributes:
• npreg – Number of times pregnant
• glucose – Plasma glucose concentration
• bp – Blood pressure
• skin – Triceps skinfold thickness
• bmi – Body mass index
• ped – Diabetes pedigree function
• age – Age
• income – Income
46. • Step 2 Data Preparation
• once we have the data, we need to clean and prepare the data for data
analysis.
• data has a lot of inconsistencies like missing values, blank columns,
abrupt values and incorrect data format which need to be cleaned.
• we have organized the data into a single table under different
attributes – making it look more structured.
47. • Step 2(Cont)
• This data has a lot of inconsistencies.
• In the column npreg, “one” is written in words, whereas it should be in the numeric
form like 1.
• In column bp one of the values is 6600 which is impossible (at least for humans) as bp
cannot go up to such huge value.
• Income column is blank and also makes no sense in predicting diabetes.
• Therefore, it is redundant to have it here and should be removed from the table.
• clean and preprocess this data by removing the outliers, filling up the null values and
normalizing the data type. -data preprocessing.
• Finally, we get the clean data which can be used for analysis.
48. • Step 3 Model Planning
• load the data into the analytical sandbox and apply various statistical functions
• R has functions like describe which gives us the number of missing values and unique
values.
• We can also use the summary function which will give us statistical information like
mean, median, range, min and max values.
• Then, we use visualization techniques like histograms, line graphs, box plots to get a
fair idea of the distribution of data.
49. • Step 4 Model Building
• supervised learning technique to build a model here.
50.
51. • Step 5 Deliver the Model
• Check with sample data.
Data :Data tables and data types
○ Operations on tables
○ Basic plotting
○ Tidy data / the ER model
○ Relational Operations
○ SQL
wrangling
○ Data acquisition (load and scrape)
○ EDA Vis / grammar of graphics
○ Data cleaning (text, dates)
○ EDA: Summary statistics
○ Data analysis with optimization (derivatives)
○ Data transformations
○ Missing data
52. • Modeling
○ Univariate probability and statistics
○ Hypothesis testing
○ Multivariate probablity and statistics (joint and conditional probability, Bayes
thm)
○ Data Analysis with geometry (vectors, inner products, gradients and matrices)
○ Linear regression
○ Logistic regression
○ Gradient descent (batch and stochastic)
○ Trees and random forests
○ K-NN
○ Naïve Bayes
○ Clustering
○ PCA
53. • Sample Algorithms for Data Science analytics
Regression
• The most popular technique for this algorithm is least of squares. This method
calculates the best-fitting line.
• Based on historical data
Example :
• Weather forecasting
• Assessing risk
Tools
• TensorFlow and PyTorch
54. • Logistic Regression
• Logistic regression is similar to linear regression, but it is used when the output is
binary (i.e. when outcome can have only two possible values). The prediction for this
final output will be a non-linear S-shaped function called the logistic function, g().
• Graph of a logistic regression curve showing probability of passing an exam versus
hours studying
55. • Decision Trees
• Decision Trees can be used for both regression and classification tasks.
• Categorical Variable Decision Tree-predict whether a customer will pay his
renewal premium with an insurance company (yes/ no).
• Continuous Variable Decision Tree.-predict customer income based on occupation,
product, and various other variables.
• Example C4.5, CART
• Naive Bayes
• classification technique
• It measures the probability of each class, and the conditional probability for each
class give values of x. This algorithm is used for classification problems to reach a
binary yes/no outcome.
57. • ANN
• Feed forward -multilayer perceptrons
• convolution neural networks-classification, object detection, or even
image segmentation,
• hierarchical object extractors.
58. What do Data Scientists do?
• National Security
• Cyber Security
• Business Analytics
• Engineering
• Healthcare
• And more ….
59. Data Scientist must posses
• Mathematics and Applied
Mathematics
• Applied Statistics/Data Analysis
• Solid Programming Skills (R,
Python, Julia, SQL)
• Data Mining
• Data Base Storage and
Management
• Machine Learning and
discovery
60. • Data Science Research Areas
• machine learning.
• artificial intelligence.
• Deep learning
• databases.
• statistics.
• optimization.
• natural language processing.
• computer vision.
• speech processing.
• Privacy
• Ethics
• Energy consumption
• Cloud computing
• IOT
• Cloud
• Social Media
• Block Chain etc.