This document presents a modeling approach called SAGM (Similarity for Adaptive Guidance Model) which offers adaptive recursive guidance tailored to developers' profiles in software processes. It introduces a similarity measure that categorizes developer profiles based on their roles and qualifications, ultimately aiming to provide appropriate assistance during software development. The paper evaluates various software process environments and emphasizes the need for adaptive guidance systems that respond dynamically to developers' needs and contexts.
![David C. Wyld et al. (Eds) : CST, ITCS, JSE, SIP, ARIA, DMS - 2014
pp. 199–214, 2014. © CS & IT-CSCP 2014 DOI : 10.5121/csit.2014.4119
A SIMILARITY MEASURE FOR
CATEGORIZING THE DEVELOPERS
PROFILE IN A SOFTWARE PROCESS
Hamid Khemissa1
, Mohamed Ahmed-nacer2
and
Abdelkader Belkhir3
Computer Systems Laboratory, Computer Science Institute, USTHB
University,
EL ALIA BP N°32, BAB EZZOUAR ALGERIA. TEL/FAX (00)213 21247917
1
hkhemissa@usthb.dz, 2
anacer@cerist.dz and
3
kaderbelkhir@hotmail.com
ABSTRACT
Software development processes need to have an integrated environment that fulfills specific
developer needs. In this context, this paper describes the modeling approach SAGM ((Similarity
for Adaptive Guidance Model) that provides adaptive recursive guidance for software
processes, and specifically tailored regarding the profile of developers. A profile is defined from
a model of developers, through their roles, their qualifications, and through the relationships
between the context of the current activity and the model of the activities. This approach
presents a similarity measure that evaluates the similarities between the profiles created from
the model of developers and those of the development team involved in the execution of a
software process. This is to identify the profiles classification and to deduce the appropriate
type of assistance (that can be corrective, constructive or specific) to developers.
KEYWORDS
Software process modeling, Process engineering, Adaptive guidance profile, Similarity
measure.
1. INTRODUCTION
Improving quality and productivity of software development requires assisting developers at both
methodology level and consistency results level [1]. A guidance model in software engineering
should combine the needed features to build the support system [2, 3].
Several PSEEs (Process-Centered Software Engineering Environments) [2, 4] deal the
assistance aspect in the support of the software product development. Some PSEEs use an
assistance description structured in steps like prescribing systems or proactive systems to control
the operations carried out by the developer. The main limitations of these PSEEs are:
The human actor has a central role in the progress of the development process regardless of his
profile (qualifications and behavior).](https://image.slidesharecdn.com/csit41819-180121154400/85/A-SIMILARITY-MEASURE-FOR-CATEGORIZING-THE-DEVELOPERS-PROFILE-IN-A-SOFTWARE-PROCESS-1-320.jpg)
![David C. Wyld et al. (Eds) : CST, ITCS, JSE, SIP, ARIA, DMS - 2014
pp. 199–214, 2014. © CS & IT-CSCP 2014 DOI : 10.5121/csit.2014.4119
A SIMILARITY MEASURE FOR
CATEGORIZING THE DEVELOPERS
PROFILE IN A SOFTWARE PROCESS
Hamid Khemissa1
, Mohamed Ahmed-nacer2
and
Abdelkader Belkhir3
Computer Systems Laboratory, Computer Science Institute, USTHB
University,
EL ALIA BP N°32, BAB EZZOUAR ALGERIA. TEL/FAX (00)213 21247917
1
hkhemissa@usthb.dz, 2
anacer@cerist.dz and
3
kaderbelkhir@hotmail.com
ABSTRACT
Software development processes need to have an integrated environment that fulfills specific
developer needs. In this context, this paper describes the modeling approach SAGM ((Similarity
for Adaptive Guidance Model) that provides adaptive recursive guidance for software
processes, and specifically tailored regarding the profile of developers. A profile is defined from
a model of developers, through their roles, their qualifications, and through the relationships
between the context of the current activity and the model of the activities. This approach
presents a similarity measure that evaluates the similarities between the profiles created from
the model of developers and those of the development team involved in the execution of a
software process. This is to identify the profiles classification and to deduce the appropriate
type of assistance (that can be corrective, constructive or specific) to developers.
KEYWORDS
Software process modeling, Process engineering, Adaptive guidance profile, Similarity
measure.
1. INTRODUCTION
Improving quality and productivity of software development requires assisting developers at both
methodology level and consistency results level [1]. A guidance model in software engineering
should combine the needed features to build the support system [2, 3].
Several PSEEs (Process-Centered Software Engineering Environments) [2, 4] deal the
assistance aspect in the support of the software product development. Some PSEEs use an
assistance description structured in steps like prescribing systems or proactive systems to control
the operations carried out by the developer. The main limitations of these PSEEs are:
The human actor has a central role in the progress of the development process regardless of his
profile (qualifications and behavior).](https://image.slidesharecdn.com/csit41819-180121154400/75/A-SIMILARITY-MEASURE-FOR-CATEGORIZING-THE-DEVELOPERS-PROFILE-IN-A-SOFTWARE-PROCESS-1-2048.jpg)
![200 Computer Science & Information Technology (CS & IT)
The basic guidance is defined as a global orientation core whatever the profiles of both the
activity and the developer.
The selection of the appropriate type of guidance is often more intuitive and not suitable.
To respond to these limits, several studies [2, 3, 5, 6] try to offer more flexibility in the language
of software process modeling and a more adapted base of support and control. This tendency aims
to define interventions of direct and adaptive assistance during the software process progress [7].
The following PSEEs included in the M1 level are as:
ADELE/APEL is based on a reactive database. It proposes a global assistance of proscriptive
type and automates part of the development process using triggers [8, 9].
RHODES/PBOOL+ uses an explicit description of a development process. The software
processes are modeled in PBOOL language [10]. The activities are associated to a guidance
system with various scenarios of possible realization.
ADDD/ALADYN provides process automation and control the impact in a concrete system. The
task hierarchy is used to organize the process descriptions, called policies. Several aspects are
grouped and treated in a policy. A policy can be instantiated for several tasks. The instantiated
triggers are rules of the form event-condition-action (ECA) and used to implement a reactive
behavior [11].
On the M2 level of Meta model, SPEM [12] introduced the concept of "Guidance" in the
"Managed Content" package by defining the stereotype "Guidance". According to SPEM,” the
Guidance is a describable element which provides additional information to define the
describable elements of a modeling. It also offers, through the stereotype “Guidance_kind”
different types of guidance such as: Template, Guidelines, Checklists, etc. ..
However, the selection of guidance types remains defined in a manual and in an intuitive way. It
depends on the experience and on the informal personality of the project manager. In addition, the
proposed guidance is not adaptive to the actor’s profile (role, qualifications and behavior).
In considering the principal limitations of PSEEs and essential characteristics of our approach as
the context adaptation aspect and the abstraction levels, a comparative table of the studied Meta
models is as follows:
Table 1. A Comparative table of the studied Meta models
Meta model
Criteria ADELE /APEL
RHODES /
PBOOL+
ADDD / ALADYN SPEM
Global guidance
core
Global Global
Customized for
each task
Global
Human performer
profile oriented
guidance
Not adapted
considered
strategy Model
Not adapted Not adapted
Context
development
Guidance
Not adapted Adapted Adapted Not adapted
Guidance types Not invoked
associated with a
specific guide
system
Not invoked
Intuitive
selection](https://image.slidesharecdn.com/csit41819-180121154400/85/A-SIMILARITY-MEASURE-FOR-CATEGORIZING-THE-DEVELOPERS-PROFILE-IN-A-SOFTWARE-PROCESS-2-320.jpg)
![Computer Science & Information Technology (CS & IT) 201
Explicit activity
abstraction
Explicit
abstraction
Implicit
abstraction
Implicit abstraction
Explicit
abstraction
Explicit task
abstraction
Implicit
abstraction
Not invoked Explicit abstraction
Explicit
abstraction
Process Modeling
Language(PML)
APEL
With predefined
primitives
PBOOL+
With explicit
primitives
ALADYN
Not explicitly
mentioned
UML Profile
With explicit
primitive
The current tendency is that developers would like to have integrated environments that are
suitable to specific needs according to the role and the characteristics of each developer and
closed to the context of the underway task. However, the provided efforts to develop such
environments remain an insufficient contribution.
In this context, our conceptual model is based on the conventional reasoning of software
processes enriched by the "Adaptive Guidance" element which supervises the running of the
activities. It also provides adaptive support to the actor. It is described by the following figure:
Figure 1. : Conceptual Model with Adaptive Guidance
This tendency of adaptive guidance environments is yet a subject of much research focusing on
defining the concepts and objectives of process modeling software-based adaptive guidance [2, 3,
6].
For the sake of productivity and development time, our goal is to establish an optimal relationship
between profile of guidance type and the adapted developer’s profile to the context of
development. The context is defined by the activity model, the developer and team development
[2, 3, 13]. It is interesting to have an operator to assess the similarities within the handled data;
this operator is the similarity function [13, 14, 15, 16]. The numerical similarity measures turn out
to be extremely flexible employment. They are able to work on a broad spectrum of data types
and it is fairly easy to introduce into the calculation, (statistical approximations if the underlying
information is complex). In addition, similarities quantification by a continuous value implies that
it is always possible and easy to compare pairs of objects. This is not the case for the symbolic
similarity; treatment of numerical values is often done in an unsatisfactory way by rewriting these
values in symbolic form [14, 16].
Our approach operates in the optimization of profiles classes in relation to the semantics of data
manipulation. It defines a system for processing the similarity index and classification of
guidance profiles. For this, we have to design a classifier in order to facilitate the analysis of our
Responsible
Controls
Has for role
Providedguidance
Products
Consume
Performs
Performer
Adaptive Guidance
Product
ActivityRole](https://image.slidesharecdn.com/csit41819-180121154400/85/A-SIMILARITY-MEASURE-FOR-CATEGORIZING-THE-DEVELOPERS-PROFILE-IN-A-SOFTWARE-PROCESS-3-320.jpg)
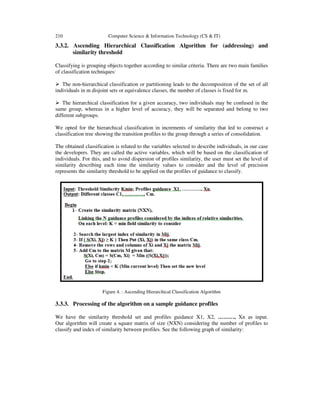
![202 Computer Science & Information Technology (CS & IT)
population and the type of assistance offered to appropriate developers involved in a software
process.
The second section summarizes the technique of assessing similarity. Section three presents our
approach (to model similarity with the software process), in addition to the implementation and
practical evaluation of our approach by giving algorithms and related results. The last section
concludes and presents future works perspectives.
2. SIMILARITY MEASURE
A similarity measure is defined on the set N (developers, documents, websites ...). Each object is
described by m features. Each feature can be present or absent in every object. A measure of
similarity, denoted by s, (between the elements of N is a specific application of NxN in R and
satisfying some properties [14, 15]).
Examples of the use of similarity techniques are described in cases of heterogeneous binary data
[17]. To transform a direct measure of similarity s into a dissimilarity measure d, we can apply
the following formula: d(x, y) = smax – s(x, y).
Thus, each element x is associated to a binary vector (x1, x2, …, xm) such that:
1 If the feature i is present in the object x
xi = 0 Else For i ∈∈∈∈{1,2,…. m}.
The m characteristics are considered of equal importance and each object has at least one feature
present. Note by:
a: The number of common characteristics between x and y.
b: The number of features present in x but not y.
c: The number of features present in y but not x.
d: The number of missing features in x and y.
Thus, the similarity measure s is given by the following formula:
We can deduce the measure of dissimilarity from the following formula:
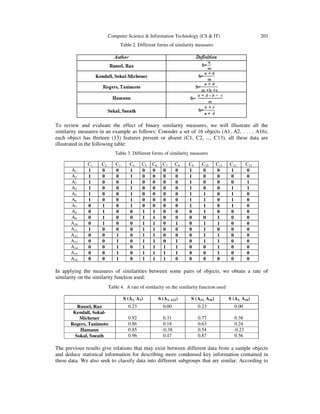
Besides this general form, there are also other forms of similarity measures such as binary data
[14, 15, 17] as those given in table 2.](https://image.slidesharecdn.com/csit41819-180121154400/85/A-SIMILARITY-MEASURE-FOR-CATEGORIZING-THE-DEVELOPERS-PROFILE-IN-A-SOFTWARE-PROCESS-4-320.jpg)
![204 Computer Science & Information Technology (CS & IT)
the area, the nature of this knowledge is different in data analysis; information will be taken into
account instead of a statistical nature.
3. SIMILARITIES IN THE SOFTWARE PROCESS
The proposed guidance system [3] addresses multiple views providing assistance to stakeholders.
Our approach aims to optimize the profile classes. To be adaptive to both the context and
identified needs, our model of adaptive guidance covers two levels of abstraction. It is based on a
set of task and activity model, the model developer and development team, as well as the
selection criteria specified by the mode of access for responding the objects of support by the
defined assistance interventions (Figure 2.). The instantiation of this system is through rules of
assistance detailed with the requirements for initiating appropriate actions to support a particular
context [2, 3, 5].
Figure 2. : Adaptive Guidance Model.
3.1. The Adaptive guidance model
This assistance system is based on the major models: the activity model, the developer model and
the team development model.
a) The activity model: models the workflow, it is defined by:
• A hierarchical list of tasks,
• A mode of progression in the activity ensuring that all tasks can be performed under control
in a preset order established by the designer,
• A temporal mode of progression specifying deadlines for completion.
The aspects of the activity model are useful for the assistance system to provide assistance on
contextual growth in activity.
Is based on
+OwnedTaskPerf
ormer
1..*
1..*
Controls
Is based on
ProvidedGuidance
*
1
Adaptive Guidance
Activity Model
AL: Activity
Level
Developer Model
Is linked to
1
1
1
TL: Task
Level
+OwnedTask
Task Model
ProcessRole
Responsibility
Qualification
Team Model
Is linked to
*
1
1
1](https://image.slidesharecdn.com/csit41819-180121154400/85/A-SIMILARITY-MEASURE-FOR-CATEGORIZING-THE-DEVELOPERS-PROFILE-IN-A-SOFTWARE-PROCESS-6-320.jpg)
![206 Computer Science & Information Technology (CS & IT)
index. This classification will serve as the basis for the selection and assignment of appropriate
types of assistance.
To reach an objective comparison between the profiles, an operator should be used for calculating
similarity based on the instantaneous evaluation of selected features and associated weights.
Despite the fact that this evaluation is not formal, it remains a crucial step for the classification.
For this, we use the notion of symbolic learning for instant evaluation of some attributes of the
profile as the behavior of the developer or development team.
3.3.1. Algorithm for computing Similarity Index
The evaluation of characteristics is based on the evolution of developer productivity. The weight
value of each feature indicates the degree of its importance. The approach used for the evaluation
of characteristics is based on ''COCOMO II” work [19, 20]. The table of weights could be refined
as soon as we have more data.
Consider two people profiles symbolized by:
X = (x1, x2, x3, ……………., xn)
Y = (y1, y2, y3, …………….., yn)
Each characteristic is related to a weight representing its impact in the degree of similarity and
symbolized by: Wi = (wi1, wi2, wi3, …………….., win)
Example: a family of two profiles is semantically described in table 4 and table 5. The semantics
evaluation and the weighting are determined by the project manager on an ongoing project [3, 19,
20].
Table 5. the profiles evaluation.
Features Evaluation of profile 1 Evaluation of profile 2
Modelof
activity
Density of tasks in the activity
High Medium
Complexity level Medium Low
Activity Type Tolerance zero Margin Free
Modelofdeveloper
Role Critical Classic
Competence High Medium
Familiarity with Process
Software
Medium Low
Behavior for assistance
Adequate
Acceptable
Modelof
development
team
Skill Area Collaboration High Medium
Behavior for assistance Acceptable
Adequate
To scan the semantics evaluation, we associate the weight corresponding to the consideration
according to each attribute.](https://image.slidesharecdn.com/csit41819-180121154400/85/A-SIMILARITY-MEASURE-FOR-CATEGORIZING-THE-DEVELOPERS-PROFILE-IN-A-SOFTWARE-PROCESS-8-320.jpg)
![Computer Science & Information Technology (CS & IT) 207
Table 6. Table of weights
With [i] ∈∈∈∈ [1, 5]. Where Pi represents the computing value
The algorithm processing is as follows: For any feature, whether it is identical to the profiles, we
increment the similarity index by the weight of this feature, otherwise, if the difference between
the two characteristics is < 1/2, we add half the weight of it, otherwise, we move to the next
feature.
The value 1/2 represents the average distance between two successive levels of an attribute
evaluation.
After all iterations, the similarity function obtained is formalized as follows:
With:
•••• X and Y represent the characteristics of the two profiles.
•••• W [ ] represents the weighting of each feature.
•••• A (x, y) represents the sum of the weights between the two profiles, it is included between 0 and
ΣW[i].
The similarity function developed verifies the properties of a similarity measure.
∀∀∀∀x, y two profiles∈∈∈∈ N
If the profiles (x, y) are identical
Then A(x, y) = A(x, x) = ∑ W[i] with i= 1..9 ⇒⇒⇒⇒ S(x, y) = A(x, y) / ∑ W[i] = 1
If the profiles (x, y) are totally different (the values are all above features > 1/2). Then for
any characteristic A (x, y) = 0 ⇒⇒⇒⇒ S(x, y) = A(x, y) / ∑ W[i] = 0.
If any profiles are neither identical nor different then " It is appropriate to consider three
subsets possible through the following 03 cases":
This allowed us to affirm that:
∀ x, y two profiles ∈ N, The similarity function S(x, y) ∈[0, 1].
∀ x, y two profiles ∈ N, then S(x, x) = S(y, y) ≥ S(x, y).
W [1] P2
W [2] P2
W [3] P3
W [4] P2
W [5] P2
W [6] P2
W [7] P2
W [8] P2
W [9] P4
][
),(
),( =
iW
yxA
yxS
∑](https://image.slidesharecdn.com/csit41819-180121154400/85/A-SIMILARITY-MEASURE-FOR-CATEGORIZING-THE-DEVELOPERS-PROFILE-IN-A-SOFTWARE-PROCESS-9-320.jpg)
![208 Computer Science & Information Technology (CS & IT)
Figure 3. : Algorithm for calculating similarity index.
Example: based on the assessing approach of the COCOMO model, the quantification of each
characteristic of a profile P is on the data range] 0, 2 [. It is usually done through three steps,
described by high, medium or low levels contribution, applying the following rules:
1: impact of middle order.
<1: positive impact.
>1: negative impact.
(1) A (x, y) = 0 for features with a difference > 1/2
(2) A (x, y) = Σ 1/2W [i] for the characteristics with a difference < 1/2
(3) A (x, y) = Σ W [i] for completely identical characteristics.
Finally for all characteristics:
A(x, y) = A(x, y) (1) + A(x, y) (2) + A(x, y) (3)
= 0 (1) + 1/2 ∑ W[i] (2) + ∑ W[i] (3)
Then
S(x, y) = A(x, y) / ∑ W[i] = (0(1) + 1/2∑ W[i] (2) + ∑ W[i] (3) ) / ( ∑ W[i] (1) +](https://image.slidesharecdn.com/csit41819-180121154400/85/A-SIMILARITY-MEASURE-FOR-CATEGORIZING-THE-DEVELOPERS-PROFILE-IN-A-SOFTWARE-PROCESS-10-320.jpg)
![Computer Science & Information Technology (CS & IT) 209
Table 7. The profiles evaluation
Features profile 1 profile 2 profile 3 profile 4
Modelof
activity
Density of tasks in the
activity 1.65 1.20 1.10 1.65
Complexity level 1.00 0.60 1.00 1.00
Activity Type 1.70 1.20 1.20 1.70
Modelofdeveloper
Role 1.15 0.70 1.15
1.60
Competence 055 1.00 1.00 0.55
Familiarity with
Process Software
0.40 0.80 0.35 0.40
Behavior for assistance 0.40 0.60 0.40 0.40
Modelof
development
Skill Area
Collaboration
0.70 0.70 0.70 0.70
Behavior for
assistance
0.95 0.10 0.95 0.95
The weight value of each feature indicates the degree of its importance. The project manager
associates the value correspondence table of weights, for example.
Table 8. Table of weights
Based on our approach, the calculation of the similarity value between profiles is given by:
Table 9. The similarity values
Similarity
value
S (P1, P2) 0.36
S (P1, P3) 063
S (P1, P4) 0.95
S (P2, P3) 0.59
S (P2, P4) 0.31
S (P3, P4) 0.59
W [1] 1
W [2] 1
W [3] 2
W [4] 1
W [5] 1
W [6] 1
W [7] 1
W [8] 1
W [9] 2](https://image.slidesharecdn.com/csit41819-180121154400/85/A-SIMILARITY-MEASURE-FOR-CATEGORIZING-THE-DEVELOPERS-PROFILE-IN-A-SOFTWARE-PROCESS-11-320.jpg)
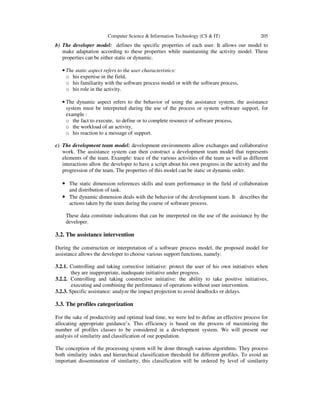
![Computer Science & Information Technology (CS & IT) 213
In perspective and in order to improve this approach, it would be interesting to develop a
similarity measure that takes into account the partial knowledge of profile characteristics. This
allows the selection of a profile as the "best effort".
REFERENCES
[1] Kirk, D.C, MacDonell, S.G., & Tempero, E. 2009 Modeling software processes - a focus on
objectives, in Proceedings of the Onward, 2009. USA, ACM Press, pp.941-948.
[2] Ivan Garcia and Carla Pacheco. 2009. Toward Automated Support for Software Process Improvement
Initiatives in Small and Medium Size Enterprises. Book chapter. Software Engineering Research,
Management and Applications 2009. Volume 253, pp. 51–58. Springer-Verlag Berlin Heidelberg.
ISBN: 978-3-642-05440-2.
[3] Hamid Khemissa, Mohamed Ahmed-Nacer, Mourad Daoudi, 2008. A Generic assistance system of
software process. In proceeding of the IASTED International Conference on Software Engineering:
Software Engineering. (SE ’08), ACTA Press, Anaheim, CA, USA, 237-242 ©2008 February.,
Austria.
[4] Dadam, P. and Reichert, M. 2009. The ADEPT Project: A Decade of Research and Development for
Robust and Flexible Process Support – Challenges and Achievements,’ Springer, Computer Science -
Research and Development, 2009. Vol. 23, No. 2, pp. 81-97.
[5] MALGOUYRES H., MOTET G. 2006. A UML Consistency Verification Approach Based on Meta
modeling Formalization. Symposium on Applied Computing, Dijon, France, ACM publishers.
[6] C. EyssautierBavay, 2008. Modèles, langage et outils pour la réutilisation de profils d'apprenants",
Thèse de doctorat de l'Université Joseph Fourier Grenoble 1, 26 Mai 2008.
[7] CHU09 CHUNG-FOO-WO Daniel. 2009. Adaptation dynamique par tissage d'aspects de
l'optimisation. Thèse de doctorat, Université de Nice - Sophia Antipolis, 5 Mars 2009, Equipe
RAINBOW, Pôle GLC.
[8] S. dami et al, 1998. APEL: a Graphical Yet Executable Formalism for Process Modeling. Kuwler
Academic Publisher, pp. 60-96, Boston, January 1998.
[9] Borislava I. Simidchieva, Lori A. Clarke , Leon J. Osterweil. 2007. Representing process variation
with a process family. ICSP'07 Proceedings of the 2007 international conference on Software process.
Springer-Verlag Berlin, Heidelberg © 2007 ISBN: 978-3-540-72425-4.
[10] Coulette Bernard., Crégut Xavier. et al, 2000. RHODES, a Process-centered Software Engineering
Environment, in Proc. of ICEIS 2000, Stafford, pp 253-260, 2000.
[11] Bradshaw J., Editor,. 2000. Handbook of Agent Technology. MIT Press, 2000.
[12] OMG. Inc. 2008. Software Engineering Meta-Model Specification version 2.0: Formal/2008-04- 01.
[13] Vivien Robinet, Gilles Bisson, Mirta B. Gordon, Benoît Lemaire. 2007. Induction of High-level
Behaviors from Problem-solving Traces using Machine Learning Tools. Published in "IEEE
Intelligent Systems 22, 4 (2007) 22".
[14] Ahmed Belkhirat, Abdelghani Bouras, Abdelkader Belkhir. 2009. A New Similarity Measure for the
Anomaly Intrusion Detection. In Third International Conference on Network and System Security
(NSS).
[15] Ahmed Belkhirat, Abdelkader Belkhir, Abdelghani Bouras 2011 A New Similarity Measure for the
Profiles Management, UKSIM '11: Proceedings of the Tenth International Conference on Computer
Modeling and Simulation, Cambridge England.
[16] Xavier Aimé, Frédéric Furst, Pascale Kuntz, Francky Trichet. 2009. «SEMIOSEM: A Semiotic-Based
Similarity Measure". On the Move to Meaningful Internet Systems (OTM 2009), International
Workshop on Ontology content and evaluation in Enterprise (OntoContent’2009), Lecture Notes in
Computer Science-LNCS 5872, pp. 584-593. Springer-Verlag (Berlin Heidelberg). ISBN 978-3-642-
05289-7. Villamoura, Portugal.
[17] S. Boriah, V. Chandola, and V. Kumar. 2008. Similarity measures for categorical data: A comparative
evaluation. In SDM 2008: Proceedings of the eighth SIAM International Conference on Data Mining,
pages 243-254, 2008.
[18] Fernando Lourenco, Victor Lobo, Fernando 2004. Bacao: Binary-based similarity measures for
categorical data and their application in self-organizing maps. JOCLAD - XI Days of classification
and analysis of data, April 1-3, Lisbon.](https://image.slidesharecdn.com/csit41819-180121154400/85/A-SIMILARITY-MEASURE-FOR-CATEGORIZING-THE-DEVELOPERS-PROFILE-IN-A-SOFTWARE-PROCESS-15-320.jpg)
![214 Computer Science & Information Technology (CS & IT)
[19] Barry W. Boehm, Chris Abts, A. Winsor Brown, Sunita Chulani, Bradford K. Clark, Ellis Horowitz,
Ray Madachy, Donald J. Reifer, Bert Steece. 2009 Software Cost Estimation With COCOMO II.
Prentice Hall Edition, ISBN: 0137025769, 978013702576.
[20] Kirk, D., & MacDonell, S. 2009. A simulation framework to support software project (re)planning, in
Proceedings of the 35th Euromicro Software Engineering and Advanced Applications (SEAA)
Conference. Patras, Greece, IEEE Computer Society Press, pp.285-292.](https://image.slidesharecdn.com/csit41819-180121154400/85/A-SIMILARITY-MEASURE-FOR-CATEGORIZING-THE-DEVELOPERS-PROFILE-IN-A-SOFTWARE-PROCESS-16-320.jpg)