Heart Rate vs Heart Rate Variability as Indicators of Cardiac Health
•
0 likes•2 views

Academic Paper Writing Service http://StudyHub.vip/A-Comparison-Between-Heart-Rate-And-Hea 👈

Recommended
Recommended
More Related Content
Similar to Heart Rate vs Heart Rate Variability as Indicators of Cardiac Health
Similar to Heart Rate vs Heart Rate Variability as Indicators of Cardiac Health (20)
More from Karla Adamson
More from Karla Adamson (20)
Recently uploaded
Recently uploaded (20)
Heart Rate vs Heart Rate Variability as Indicators of Cardiac Health
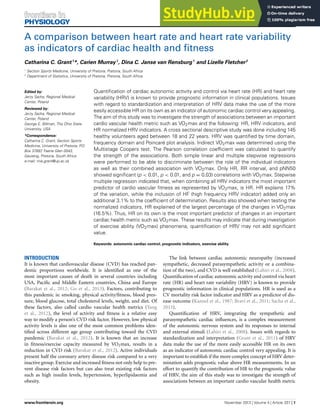
- 1. ORIGINAL RESEARCH ARTICLE published: 20 November 2013 doi: 10.3389/fphys.2013.00337 A comparison between heart rate and heart rate variability as indicators of cardiac health and fitness Catharina C. Grant1 *, Carien Murray1 , Dina C. Janse van Rensburg1 and Lizelle Fletcher2 1 Section Sports Medicine, University of Pretoria, Pretoria, South Africa 2 Department of Statistics, University of Pretoria, Pretoria, South Africa Edited by: Jerzy Sacha, Regional Medical Center, Poland Reviewed by: Jerzy Sacha, Regional Medical Center, Poland George E. Billman, The Ohio State University, USA *Correspondence: Catharina C. Grant, Section Sports Medicine, University of Pretoria, P .O. Box 37897 , Faerie Glen 0043, Gauteng, Pretoria, South Africa e-mail: rina.grant@up.ac.za Quantification of cardiac autonomic activity and control via heart rate (HR) and heart rate variability (HRV) is known to provide prognostic information in clinical populations. Issues with regard to standardization and interpretation of HRV data make the use of the more easily accessible HR on its own as an indicator of autonomic cardiac control very appealing. The aim of this study was to investigate the strength of associations between an important cardio vascular health metric such as VO2max and the following: HR, HRV indicators, and HR normalized HRV indicators. A cross sectional descriptive study was done including 145 healthy volunteers aged between 18 and 22 years. HRV was quantified by time domain, frequency domain and Poincaré plot analysis. Indirect VO2max was determined using the Multistage Coopers test. The Pearson correlation coefficient was calculated to quantify the strength of the associations. Both simple linear and multiple stepwise regressions were performed to be able to discriminate between the role of the individual indicators as well as their combined association with VO2max. Only HR, RR interval, and pNN50 showed significant (p < 0.01, p < 0.01, and p = 0.03) correlations with VO2max. Stepwise multiple regression indicated that, when combining all HRV indicators the most important predictor of cardio vascular fitness as represented by VO2max, is HR. HR explains 17% of the variation, while the inclusion of HF (high frequency HRV indicator) added only an additional 3.1% to the coefficient of determination. Results also showed when testing the normalized indicators, HR explained of the largest percentage of the changes in VO2max (16.5%). Thus, HR on its own is the most important predictor of changes in an important cardiac health metric such as VO2max. These results may indicate that during investigation of exercise ability (VO2max) phenomena, quantification of HRV may not add significant value. Keywords: autonomic cardiac control, prognostic indicators, exercise ability INTRODUCTION It is known that cardiovascular disease (CVD) has reached pan- demic proportions worldwide. It is identified as one of the most important causes of death in several countries including USA, Pacific and Middle Eastern countries, China and Europe (Barakat et al., 2012; Go et al., 2013). Factors, contributing to this pandemic is: smoking, physical activity/fitness, blood pres- sure, blood glucose, total cholesterol levels, weight, and diet. Of these factors, also called cardio vascular health metrics (Yang et al., 2012), the level of activity and fitness is a relative easy way to modify a person’s CVD risk factor. However, low physical activity levels is also one of the most common problems iden- tified across different age group contributing toward the CVD pandemic (Barakat et al., 2012). It is known that an increase in fitness/exercise capacity measured by VO2max, results in a reduction in CVD risk (Barakat et al., 2012). Active individuals present half the coronary artery disease risk compared to a very inactive group. Exercise and increased fitness not only help to pre- vent disease risk factors but can also treat existing risk factors such as high insulin levels, hypertension, hyperlipidaemia and obesity. The link between cardiac autonomic neuropathy (increased sympathetic, decreased parasympathetic activity or a combina- tion of the two), and CVD is well established (Lahiri et al., 2008). Quantification of cardiac autonomic activity and control via heart rate (HR) and heart rate variability (HRV) is known to provide prognostic information in clinical populations. HR is used as a CV mortality risk factor indicator and HRV as a predictor of dis- ease outcome (Kannel et al., 1987; Bravi et al., 2011; Sacha et al., 2013). Quantification of HRV, integrating the sympathetic and parasympathetic cardiac influences, is a complex measurement of the autonomic nervous system and its responses to internal and external stimuli (Lahiri et al., 2008). Issues with regards to standardization and interpretation (Grant et al., 2011) of HRV data make the use of the more easily accessible HR on its own as an indicator of autonomic cardiac control very appealing. It is important to establish if the more complex concept of HRV deter- mination adds prognostic value above HR measurements. In an effort to quantify the contribution of HR to the prognostic value of HRV, the aim of this study was to investigate the strength of associations between an important cardio vascular health metric www.frontiersin.org November 2013 | Volume 4 | Article 337 | 1
- 2. Grant et al. HR compared with HRV such as VO2max and HR, as well as between VO2max and HRV indicators including RMSSD, pNN50, LF, HF, LF/HF, SD1, and SD2 (abbreviations explained in Table 1). HR normalized HRV indicators were also calculated and used as regressors to deter- mine if HR independent variability shows similar associations with VO2max than standard HRV indicators. Regression analy- ses were employed to determine the relative importance of HR and HRV indicators as predictors of an important cardio vascular health metric such as VO2max. The primary hypothesis was that HR and RR intervals show stronger correlations with VO2max than the HRV indicators, and are on their own stronger predictors of VO2max than the more complex indicators of HRV (RMSSD, pNN50, LF, HF, LF/HF, SD1, and SD2). A secondary hypothesis was that, when includ- ing HR and HR normalized indicators of variability (RMSSD/RR, LF/RR2, HF/RR2, LF/HF, SD1/RR, SD2/RR) regression analy- sis will show that HR is still the most important predictor of VO2max. MATERIALS AND METHODS BACKGROUND AND DETERMINATION OF THE HEALTH METRIC VO2MAX The gold standard in fitness testing is generally regarded as the VO2max test for measuring aerobic fitness or cardiorespiratory endurance. VO2max is defined as the maximum volume of oxy- gen that can be utilized in 1 min during maximal exercise. It is measured in millilitres of oxygen used in 1 min per kilogram of body weight, (ml/kg/min) (Wilmore and Costill, 2004). Elite endurance athletes are known to have high VO2max values and it is thought that the more oxygen the body can use during stren- uous exercise, the more energy it can produce (Wilmore and Costill, 2004). VO2max can be measured directly or indirectly. The direct measurement needs to be done in a laboratory and is expensive, time consuming and requires special expertise. The test subject must reach his/her maximum work capacity in order to deter- mine VO2 max accurately. The test is done on a treadmill or a bicycle and a strict protocol is followed. The athlete is required to exercise while the speed and intensity is gradually increased. The Table 1 | HRV indicators defined. HRV indicator Definition Mean RR (s) The mean of the intervals between successive QRS complexes RMSSD (ms) Root mean square of the standard deviation between RR intervals pNN50 (%) The percentage of successive RR interval differences over the entire measurement larger than 50ms LF Power (ms2) Peak between 0.04 and 0.15Hz HF Power (ms2) Peak between 0.15 and 0.5Hz LF/HF LF Power (ms2) divided by HF Power (ms2) SD1 (ms) Indicator of the standard deviation of the instantaneous RR variability SD2 (ms) Indicator of the standard deviation of the continuous or long term variability of the heart rate volume and oxygen concentration of the inhaled and exhaled air of the athlete is measured to determine how much oxygen is used. The oxygen consumption usually rises in direct relationship to the increase in exercise intensity up to a certain point. At this point the oxygen consumption reaches a plateau and does not rise fur- ther even with a further rise in intensity. This plateau marks the VO2max. VO2max can also be determined indirectly, as an estimate of the true VO2max. The Cooper 12 min run test was used in the current study. This assessment uses a set period of time (12 min) and scoring according to distance (in meters). The par- ticipants were asked to run or walk for 12 min as fast as possible (Cooper, 1968). This test was performed on a 400 m tartan ath- letics track. A warm-up of light aerobic activities and flexibility exercises was performed for 5 min before the start of the test. Testers were placed at 100 m intervals around the track as a source of verbal motivation. A prediction of VO2max from the distance covered at the end of the 12 min period was obtained by applying the distance run to the Cooper regression equation: VO2max (ml/kg/min) = 0.0268 (distance covered in meters)— 11.3 (Cooper, 1968). The sedentary person has a much lower VO2max generally compared to the active fit individual, with the elite endurance athlete having the highest VO2max. Genetics play a role in an individual’s exercise ability but VO2max can be improved with physical training. The more unfit, the more the VO2max can be improved. As exercise capacity improves, skeletal muscle strength and endurance also improve (Paterson et al., 2004; Stringer, 2010). STUDY DESCRIPTION A hypotheses driven, cross sectional, descriptive study was per- formed. The study protocol was submitted and approved by the Ethics Committee of the University. A total of 145 healthy par- ticipants from a group of 235 volunteers were accepted to take part in the research study. Exclusion criteria included refusal to give voluntary written informed consent; a history of cardio- vascular, hepatic, respiratory, or renal impairment, as well as pulmonary, metabolic, and orthopaedic diseases requiring med- ical attention; lung/respiratory tract infection in the previous 2 weeks; and medication that could influence cardiovascular con- trol and psychological disorders. None of the participants were professional athletes or high-level sport participants. All partic- ipants gave written informed consent before commencement of the intervention. Participants fasted overnight and were asked not to use any caffeine, alcohol or to smoke 24 h prior to the measurements. Measurements were taken in a temperature reg- ulated, quiet environment, in the morning before 12H00. The Polar 810E HR monitor system was used to record supine RR intervals for a 10 min period. The 5 to 10 min period of this recording was used to quantify the HRV. Computer software from the University of Kuopio, Finland calculated the HRV indica- tor values by time domain analysis (RR, STDRR, RMSSD, and pNN50), frequency domain analysis (LF, HF, and LF/HF), and Poincaré plot analysis (SD1 and SD2) (Mourot et al., 2004). HRV indicators determined are listed in Table 1; Mourot et al., 2004). Frontiers in Physiology | Clinical and Translational Physiology November 2013 | Volume 4 | Article 337 | 2
- 3. Grant et al. HR compared with HRV STATISTICAL ANALYSES The Pearson’s correlation coefficient (r) was calculated. Correlation strength were defined as very low if rho is smaller than 0.2; low to moderate if rho is larger than 0.2 but smaller than 0.4; and moderate if rho is larger than 0.4 but less than 0.6 (Landis and Koch, 1977). The level of significance was set at the conventional 5%, thus, when p-values were less than 0.05, the associations were identified as statistically significant. To test the hypotheses, linear regression was used to determine the most important predictors of changes in cardio vascular fit- ness and exercise ability as represented by VO2max. Indicators included were: HR, RR interval, RMSSD, pNN50, LF, HF, LF/HF, SD1, SD2. The following HR normalized HRV indicators were also included in a separate set of regression analyses: RMSSD/RR, LF/RR2, HF/RR2, LF/HF, SD1/RR, and SD2/RR. Both simple lin- ear and multiple stepwise regressions were performed to be able to discriminate between the role of the individual indicators as well as their combined relationship with VO2max (Field, 1994). RESULTS A summary of the participants (N = 145) and HRV indicator values are displayed in Tables 2, 3. Table 2 | Median, mean and standard deviation (SD) of participant body mass index (BMI) and exercise capacity (VO2max). Mean SD Median BMI (kg/m2) 23.07 2.36 22.62 VO2max (ml/kg/min) 49.54 8.79 53.53 2.4 km run time (s) 733.71 179.10 661.50 Table 3 | Mean, standard deviation (SD), median and inter quartile range of HRV indicators and normalized HRV indicators. Mean SD Median Inter quartile range(Q1;Q3) Mean RR (ms) 894.10 137 .03 884.50 186.25 (791.00;977 .25) Mean HR (beats per minute) 69.22 10.5 68.78 14.61 (61.83;76.44) RMSSD (ms) 76.04 44.84 65.00 53.25 (43.40;96.65) pNN50 (%) 39.08 22.84 38.30 39.85 (18.40;59.25) LF (ms2) 1148.19 1291.74 999.00 1336 (582.50;1918.50) HF (ms2) 2760.15 3465.31 1721.00 2627 (582.50;1918.50 LF/HF 0.81 0.58 0.67 0.74 (0.35;1.09) SD1(ms) 54.06 31.83 46.10 37 .80 (30.95;68.75) SD2(ms) 90.48 37 .17 83.10 51.60 (64.00;115.60) NORMALIZED HRV INDICATORS RMSSD/RR 0.08 0.04 0.07 0.05 (0.05;0.10) LF/RR2 0.0017 0.0013 0.0012 0.001 (0.001;0.002) HF/RR2 0.0031 0.0034 0.0020 0.002 (0.001;0.003) SD1/RR 0.060 0.030 0.050 0.04 (0.03;0.07) SD2/RR 0.10 0.040 0.090 0.05 (0.07;0.12) The HR, RR intervals, and HRV indicators (normalized and non-normalized) were compared to the VO2max of participants results, to establish any significant relationships (Table 4). The results shown in Table 4 indicate that only one HRV indi- cator value, pNN50, correlated significantly with VO2max. When indicators were HR normalized by dividing by RR or RR2, no significant correlations were found. All significant correlation coefficients were between 0.19 and 0.41 indicating very low to moderate associations. Simple linear regression analyses (Table 5) showed that only HR, RR, and pNN50 explained a significant (p < 0.05) propor- tion of the variation in VO2max. Stepwise multiple regression (Table 5) indicated that, when including all nine indicators (HR, RR, RMSSD, pNN50, LF, HF, LF/HF, SD1, SD2), the statistical model containing a linear combination of HR and HF, explained the largest proportion of the variation, i.e., is the best predic- tor of variation in VO2max 20.1%). However, HR entered the model first and by itself explains 17% of the variation, while the Table 4 | Pearson’s correlation coefficients (r) and significance (p-value) for VO2 max and HRV indicators. HRV Indirect VO2max Normalized HRV Indirect VO2max Indicators r (p-value) indicators r (p-value) Mean RR 0.41(< 0.01)* NA NA Mean HR −0.41 < 0.01* NA NA RMSSD 0.09 (0.29) RMSSD/RR 0.02 (0.80) pNN50 0.19 (0.03)* NA NA LF 0.10 (0.21) LF/RR2 0.02 (0.95) HF 0.001 (0.99) HF/RR2 −0.03 (0.72) LF/HF 0.02 (0.82) NA NA SD1 0.09 (0.29) SD1/RR 0.02 (0.80) SD2 0.14 (0.10) SD2/RR 0.02 (0.79) NA, Not applicable; *, significant: p < 0.05. Table 5 | Simple and stepwise multiple linear regression results. Regression type Predictors Significant Coefficient of of VO2max predictors determination R2 included (p < 0.05) Simple Regression HR HR 0.170 Simple Regression RR RR 0.161 Simple Regression pNN50 pNN50 0.035 Multiple Regression Nine indicators HR,RR,RMSSD, pNN50,LF , HF , LF/HF , SD1, SD2 HR and HF 0.201 Multiple Regression HR and six normalized HRV indicators: HR/RR, RMSSD/RR, LF/RR2, HF/RR2, LF/HF , SD1/RR, SD2/RR HR and HF/RR2 0.190 www.frontiersin.org November 2013 | Volume 4 | Article 337 | 3
- 4. Grant et al. HR compared with HRV inclusion of HF added only an additional 3.1% to the coeffi- cient of determination. Stepwise multiple regression also showed that, when including HR and all normalized HRV indicators (RMSSD/RR, LF/RR2, HF/RR2, LF/HF, SD1/RR, SD2/RR), the statistical model consisting of a linear combination of HR and HF/RR2, will be the best predictor of variation in VO2max, that is 19.0%. HR on its own explained 16.5% and a combination of HR and HF/RR2 thus, explained only a further 2.5%. DISCUSSION The primary hypothesis was that straightforward measurements such as HR and RR intervals show stronger correlations with VO2max than the HRV indicators, and is on their own stronger predictors of VO2max than the more complex indicators of HRV. Study results partially confirmed the first hypotheses. Moderately strong correlations were found between HR and RR intervals vs. VO2max. The only other correlation found (pNN50) was of very low strength (r = 0.19). The stepwise multiple regression anal- ysis indicated that HR predicted 17%, and the combination of HR and HF predicted 20.1% of the variation in VO2max, when entering the following HRV indicators: HR, RR, RMSSD, pNN50, LF, HF, LF/HF, SD1, SD2. With regards to the second hypothe- sis multiple regression analysis showed that the combination of HR and HF/RR2 explained only 2.5% more of the variation in VO2max, than HR alone (16.5%), when including all normalized indicators. Recent publications by Sacha et al. (2013) suggested that, because of physiological and mathematical relationships between HR and HRV, the dependence of HRV indicator values on HR can be modified by mathematical manipulation. This is due to the known fact that RR variation is significant higher for a slow aver- age HR than for higher mean HR. Following suggestions by Sacha et al. (2013) to minimize the HRV indicator’s dependence on HR, correlational and regression statistical analyses in this study were performed firstly with the actual HR, RR, and HRV indicator val- ues and again after each were normalized by dividing by the mean RR or RR2. Correlations found between the HR, RR intervals, pNN50, and VO2max were significant (p < 0.05), but of very low to medium strength (0.19 ≤ r ≤ 0.41). A significant positive correlation was found between mean RR interval and VO2max (p < 0.01; r = 0.41) and as expected a significant negative correlation between mean HR and VO2max (p < 0.01; r = −0.41). These associations concur with some previous study findings. Higher fitness is asso- ciated with a lower HR, higher VO2max, and also higher vagal cardiac control (Nagai et al., 2004; Spierer et al., 2007; Gilder and Ramsbottom, 2008). The strength of the associations found in this study are lower than values reported in literature but this may be due to the fact that VO2max was only indirectly determined and not directly with gas analyses. The fact that only one HRV indicator (pNN50) correlated sig- nificantly with VO2max, may indicate that correlations between HRV indicators and VO2max exist mainly due to the relationship between HR (independent of variability) and VO2max. Regression analysis confirmed that, when including HR, RR, RMSSD, pNN50, LF, HF, LF/HF, SD1, and SD2, the most important predictor of cardio vascular fitness and exercise ability as represented by VO2max, is HR. Results also showed when testing the normalized indicators, HR explained the largest per- centage of the changes in VO2max. Thus, HR on its own is the most important predictor of changes in an important car- diac health metric such as VO2max. Thus, the more complex concept of HRV quantification unlock only a small percent- age of additional information with regards to autonomic func- tion, compared to information obtained from only HR and RR interval measurements. These results may indicate that during investigation of exercise ability (VO2max) phenomena, quan- tification of HRV may not add significant more value. This is a novel idea which should be investigated further in clinical populations. Limitations of this study include the fact that VO2max was not directly determined with gas analyses, but only indirectly determined. Another drawback is that the tachogram used to determine HRV, was sampled only in a resting, supine position. Previous studies indicated that HRV measured during a stressor, such as standing upright, show more significant correlations with cardiopulmonary fitness indicators than supine HRV measure- ments (Grant et al., 2009). For future studies it is recommended to investigate participants from other age groups as well as clini- cal groups to answer the question whether these results are only applicable to healthy young participants and if not; how it differs in other groups. REFERENCES Barakat, H., Barakat, H., and Baaj, M. K. (2012). CVD and obesity in transitional Syria: a perspective from the Middle East. Vasc. Health Risk Manag. 8, 145–150. doi: 10.2147/VHRM.S28691 Bravi, A., Longtin, A., and Seely, A. J. (2011). Review and classification of variability analysis techniques with clinical applications. Biomed. Eng. Online 10, 90. doi: 10.1186/1475-925X-10-90 Cooper, K. H. (1968). A means of assessing maximal oxygen intake. JAMA 203, 201–204. doi: 10.1001/jama.1968.03140030033008 Field, A. (1994). Discovering Statistics Using SPSS. London: Sage. Gilder, M., and Ramsbottom, R. (2008). Change in heart rate variability following orthostasis relates to volume of exercise in healthy woman. Auton. Neurosci. 143, 73–76. doi: 10.1016/j.autneu.2008.06.002 Go, A. S., Mozaffarian, D., Roger, V. L., Benjamin, E. J., Berry, J. D., Borden, W. B., et al. (2013). Heart disease and stroke statistics update: a report from the American Heart Association. Circulation 127, e6–e245. doi: 10.1161/CIR.0b013e31828124ad Grant, C. C., Clark, J. R., Janse van Rensburg, D. C., Strydom, N., and Viljoen, M. (2009). The relationship between exercise capacity and heart rate variability: supine and in response to an orthostatic stressor. Auton. Neurosci. 151, 186–188. doi: 10.1016/j.autneu.2009.08.015 Grant, C. C., Janse van Rensburg, D. C., Strydom, N., and Viljoen, M. (2011). Importance of tachogram length and period of recording during non-invasive investigation of the autonomic nervous system. Ann. Noninvasive Electrocardiol. 16, 131–139. doi: 10.1111/j.1542-474X.2011.00422.x Kannel, W. B., Kannel, C., Paffenbarger, R. S. Jr., and Cupples, L. A. (1987). Heart rate and cardiovascular mortality: the Framingham study. Am. Heart J. 113, 1489–1494. doi: 10.1016/0002-8703(87)90666-1 Lahiri, M. K., Kannankeril, P. J., and Goldberger, J. J. (2008). Assessment of auto- nomic function in cardiovascular disease. J. Am. Coll. Cardiol. 51, 1725–1733. doi: 10.1016/j.jacc.2008.01.038 Landis, J. R., and Koch, G. G. (1977). The measurement of observer agreement for categorical data. Biometrics 33, 159–174. doi: 10.2307/2529310 Mourot, L., Bouhaddi, M., Perrey, S., Roillon, J. D., and Regnard, J. (2004). Quantitative Poincaré plot analysis of heart rate variability: effect of endurance training. Eur. J. Appl. Physiol. 91, 79–87. doi: 10.1007/s00421-003- 0917-0 Frontiers in Physiology | Clinical and Translational Physiology November 2013 | Volume 4 | Article 337 | 4
- 5. Grant et al. HR compared with HRV Nagai, N., Hamada, T., Kimura, T., and Moritani, T. (2004). Moderate physical exer- cise increases cardiac autonomic nervous system activity in children with low heart rate variability. Childs. Nerv. Syst. 20,209–214. doi: 10.1007/s00381-004- 0916-4. Paterson, D. H., Govindasamy, D., Vidmar, M., Cunningham, D. A., and Koval, J. J. (2004). Longitudinal study of determinants of dependence in an elderly popula- tion. J. Am. Geriatr. Soc. 52, 1632–1638. doi: 10.1111/j.1532-5415.2004.52454.x Sacha, J., Barabach, S., Statkiewicz-Barabach, G., Sacha, K., Muller, A., Piskorski, J., et al. (2013). How to strengthen or weaken HRV dependence on heart rate- description of the method and its perspectives. Int. J. Cardiol. 168, 1660–1663. doi: 10.1016/j.ijcard.2013.03.038 Spierer, D. K., DeMeersman, R. E., Kleinveld, J., McPherson, E., Fullilove, R. E., Alba, A., et al. (2007). Exercise training improves cardiovascular and autonomic profiles in HIV. Clin. Auton. Res. 17, 341–348. doi: 10.1007/s10286-007-0441-0 Stringer, W. W. (2010). Cardiopulmonary exercise testing: current applications. Expert Rev. Respir. Med. 4, 179–188. doi: 10.1586/ers.10.8 Wilmore, J. H., and Costill, D. L. (2004). Physiology of sport and exercise. Hum. Kinet. 3, 140–142. doi: 10.1177/1356336X06069280 Yang, Q., Cogswell, M. E., Flanders, W. D., Hong, Y., Zhang, Z., Loustalot, F., et al. (2012). Trends in cardiovascular health metrics and associations with all-cause and CVD mortality among US adults. JAMA 307, 1273–1283. doi: 10.1001/jama.2012.339 Conflict of Interest Statement: The authors declare that the research was con- ducted in the absence of any commercial or financial relationships that could be construed as a potential conflict of interest. Received: 27 August 2013; accepted: 01 November 2013; published online: 20 November 2013. Citation: Grant CC, Murray C, Janse van Rensburg DC and Fletcher L (2013) A com- parison between heart rate and heart rate variability as indicators of cardiac health and fitness. Front. Physiol. 4:337. doi: 10.3389/fphys.2013.00337 This article was submitted to Clinical and Translational Physiology, a section of the journal Frontiers in Physiology. Copyright © 2013 Grant, Murray, Janse van Rensburg and Fletcher. This is an open- access article distributed under the terms of the Creative Commons Attribution License (CC BY). The use, distribution or reproduction in other forums is permitted, provided the original author(s) or licensor are credited and that the original publication in this journal is cited, in accordance with accepted academic practice. No use, distribution or reproduction is permitted which does not comply with these terms. www.frontiersin.org November 2013 | Volume 4 | Article 337 | 5