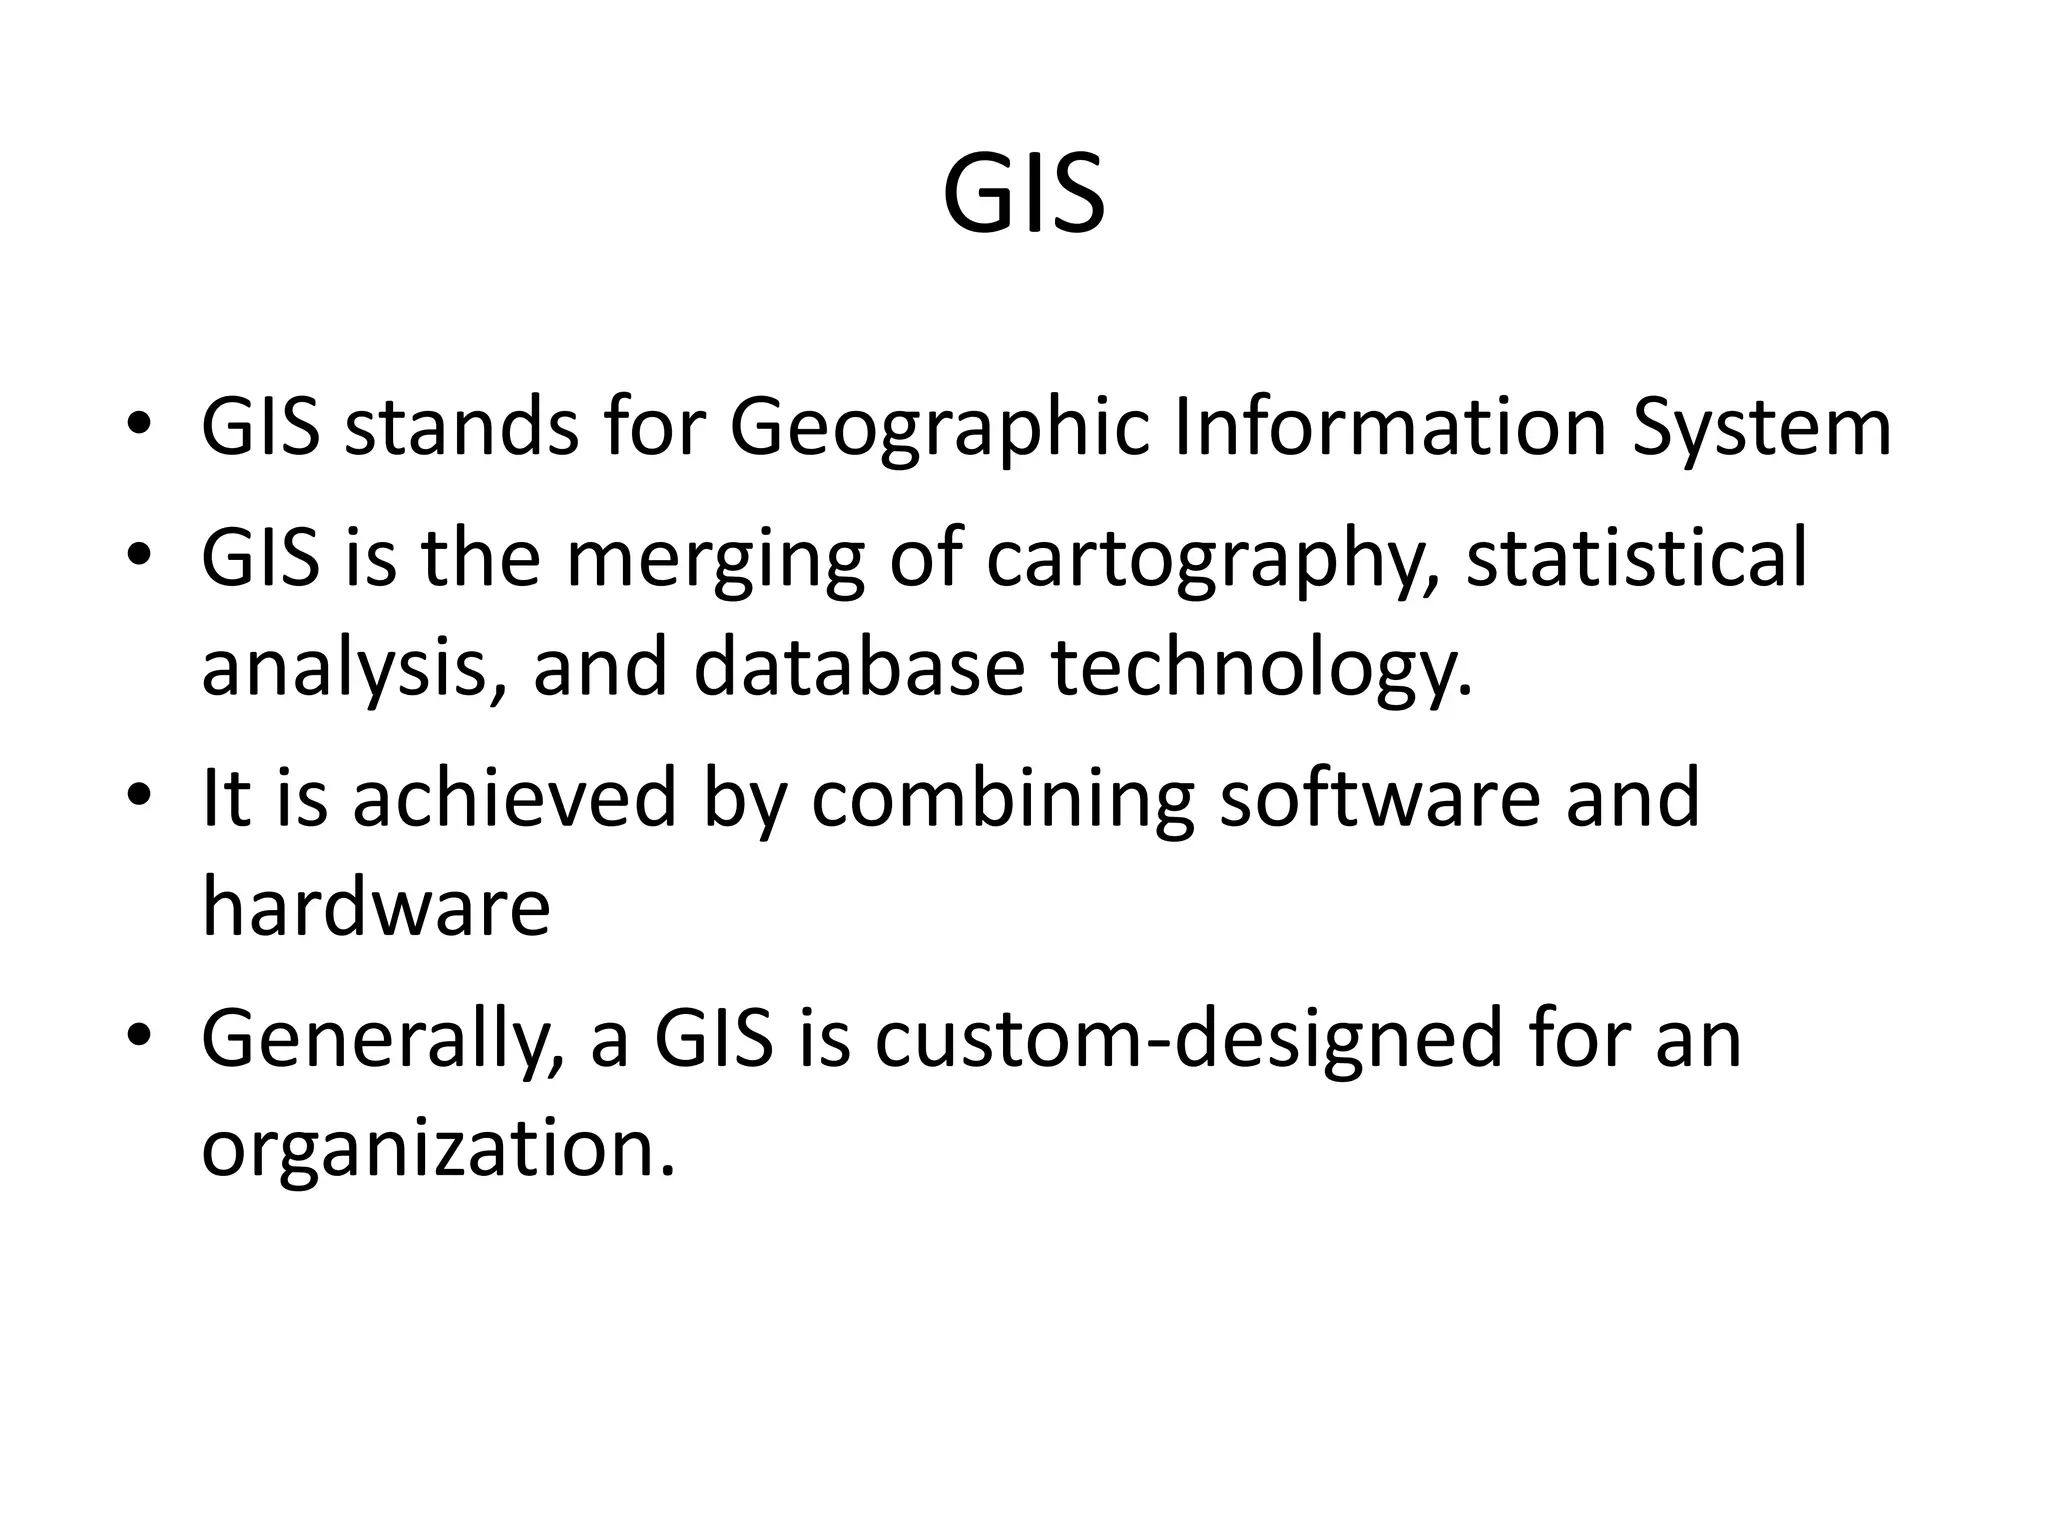
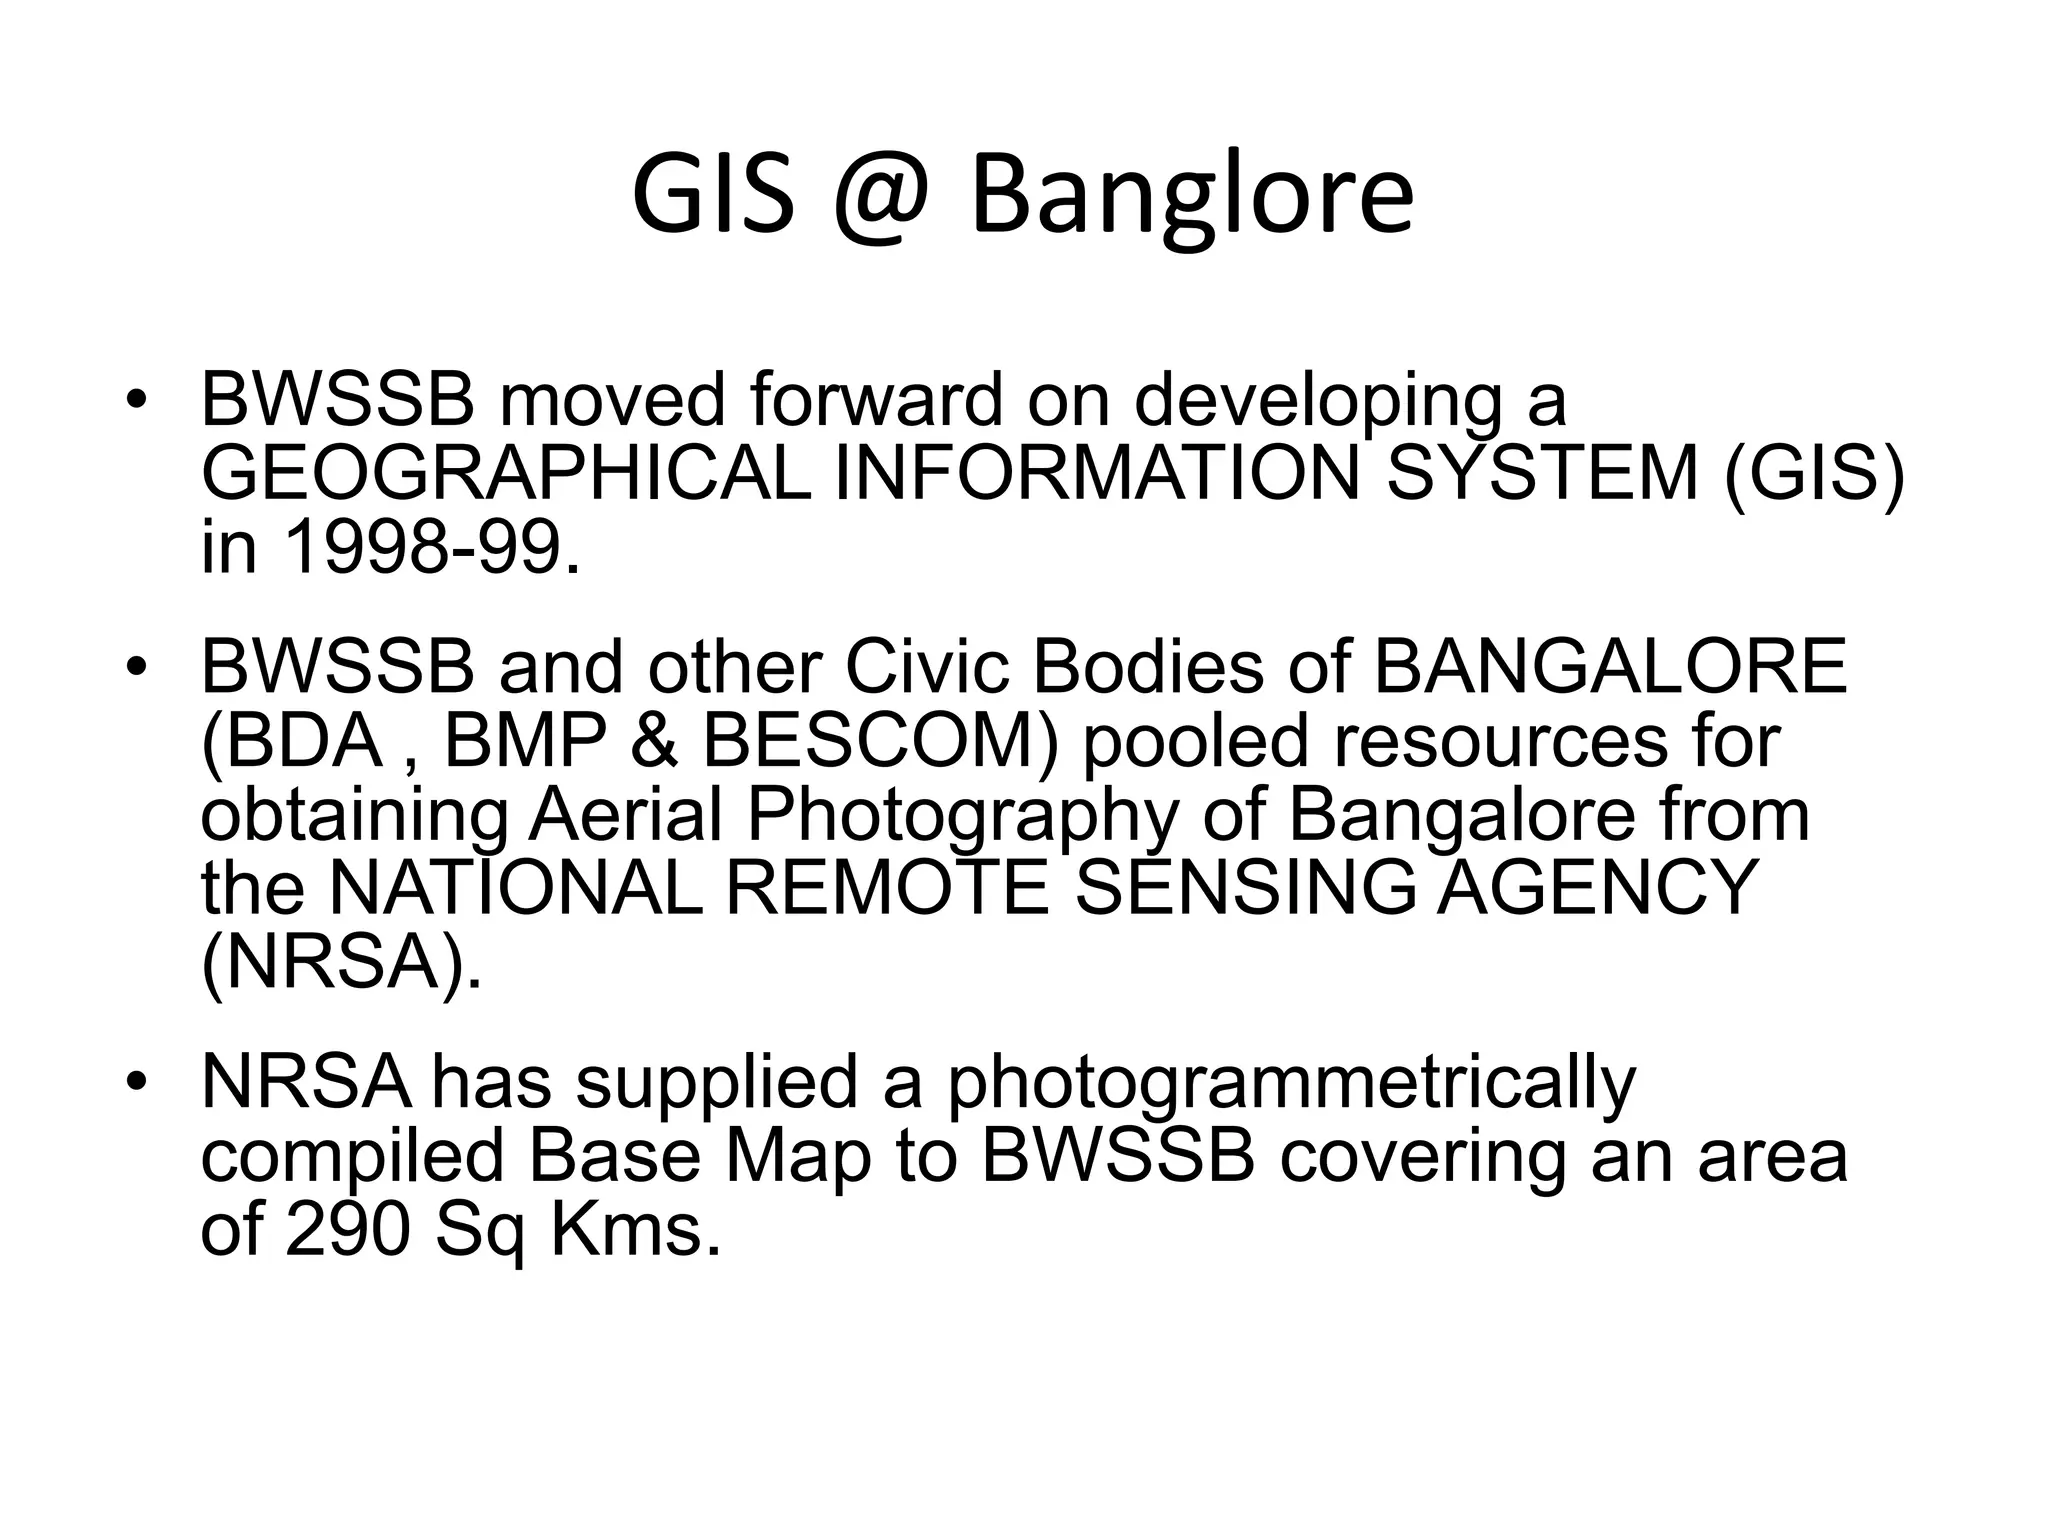
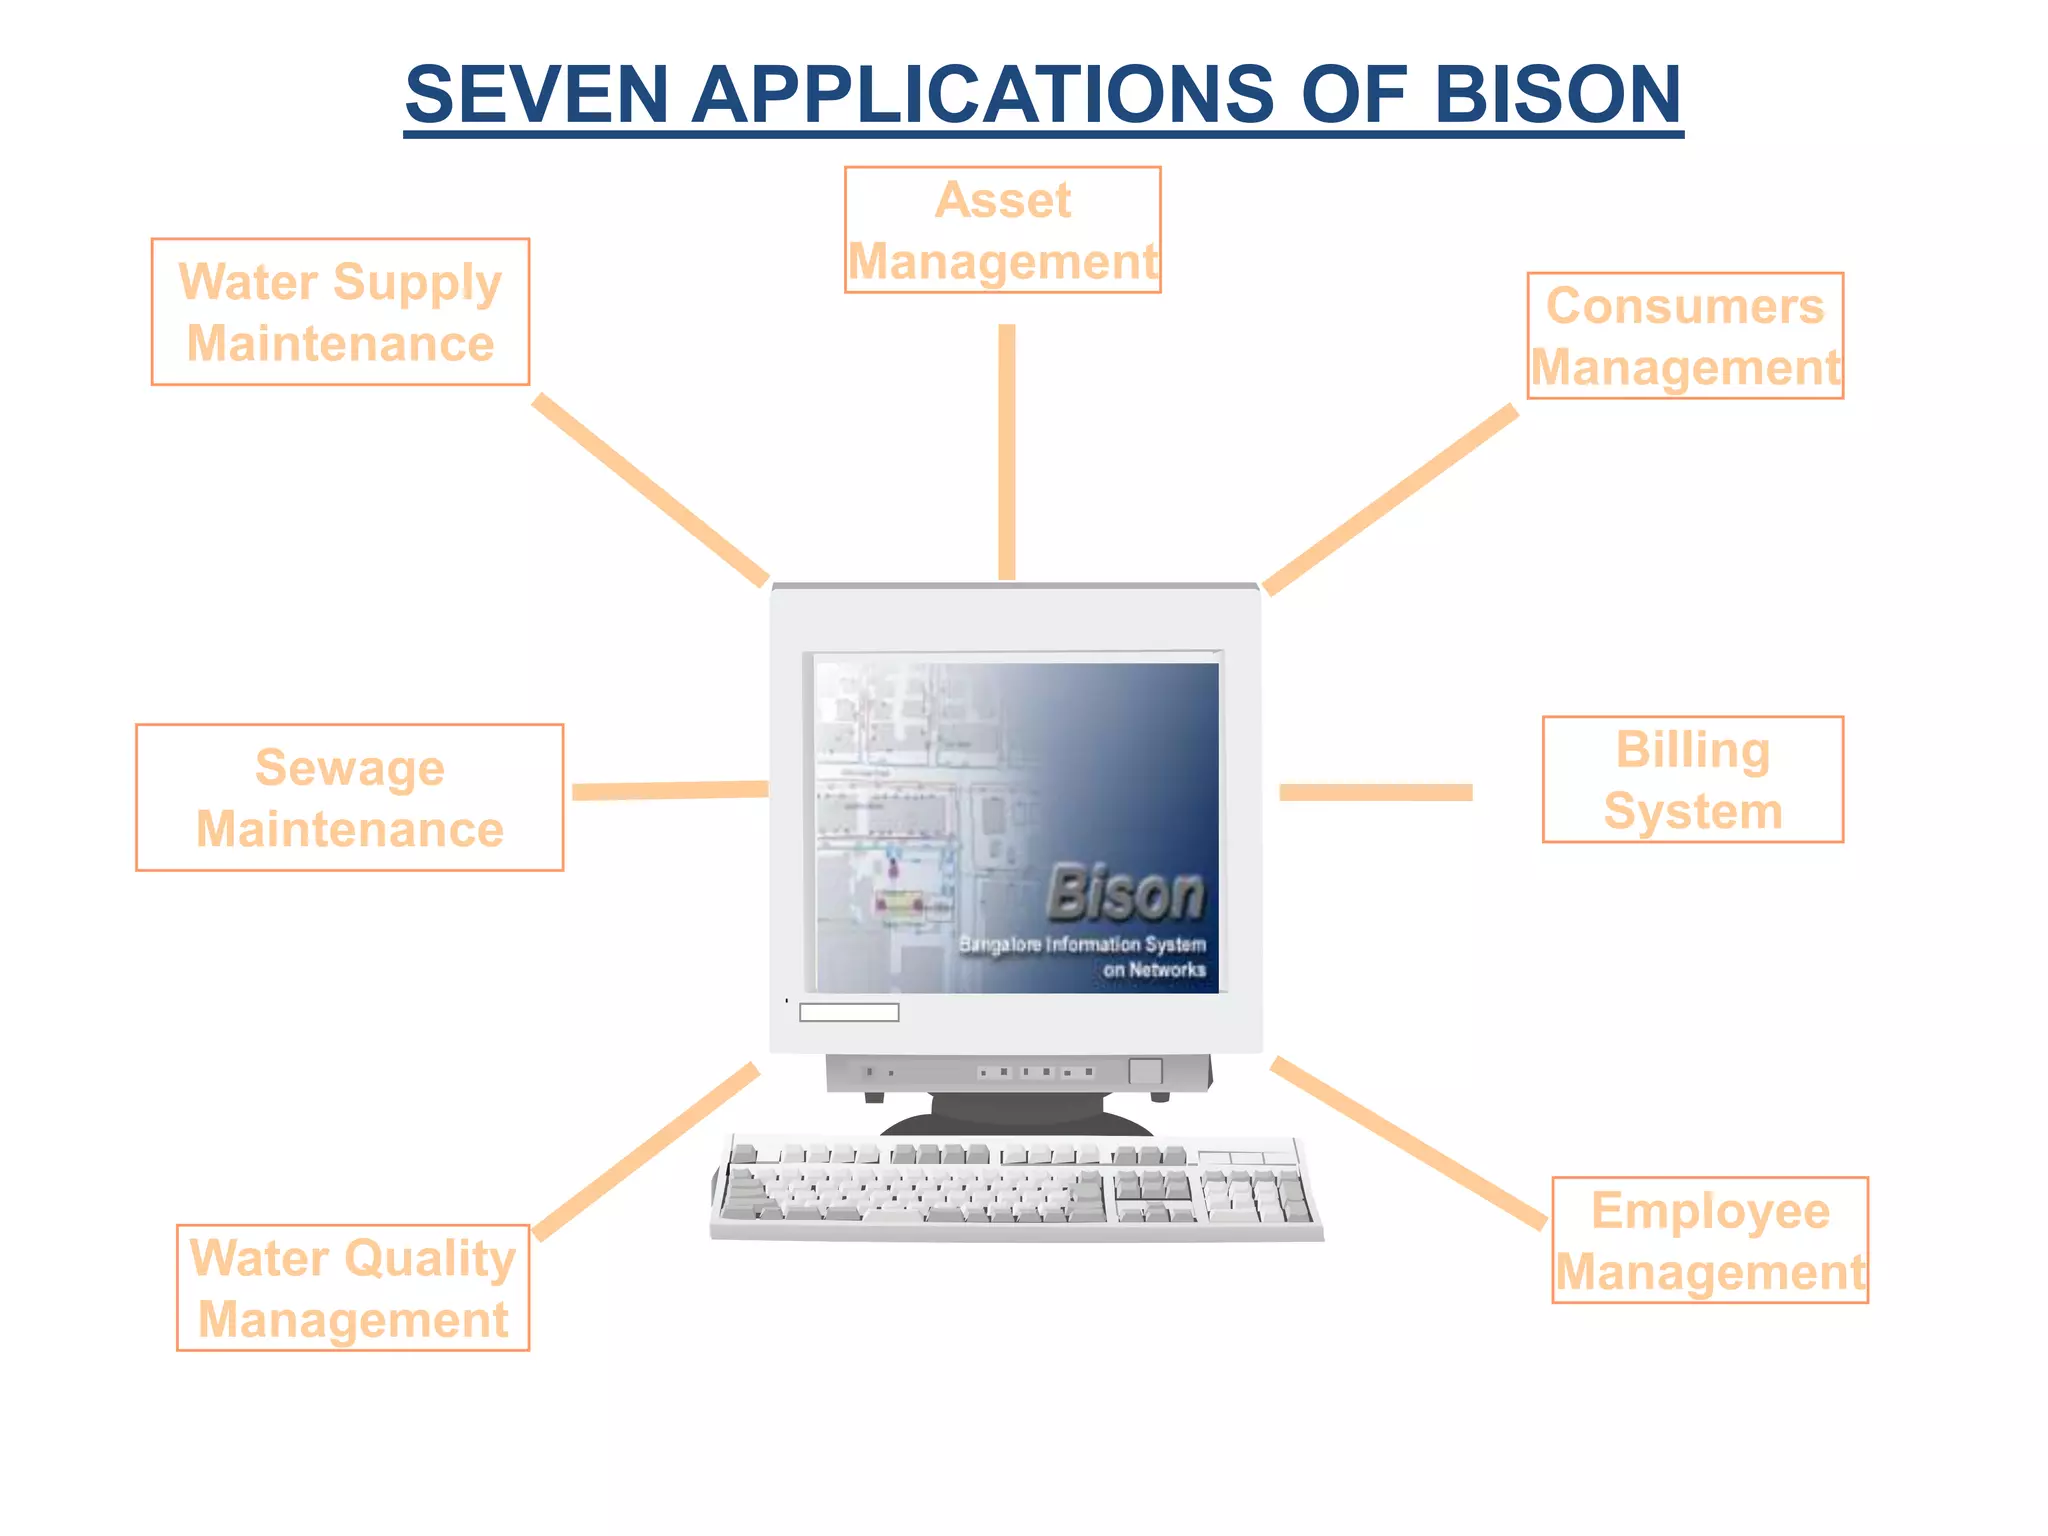
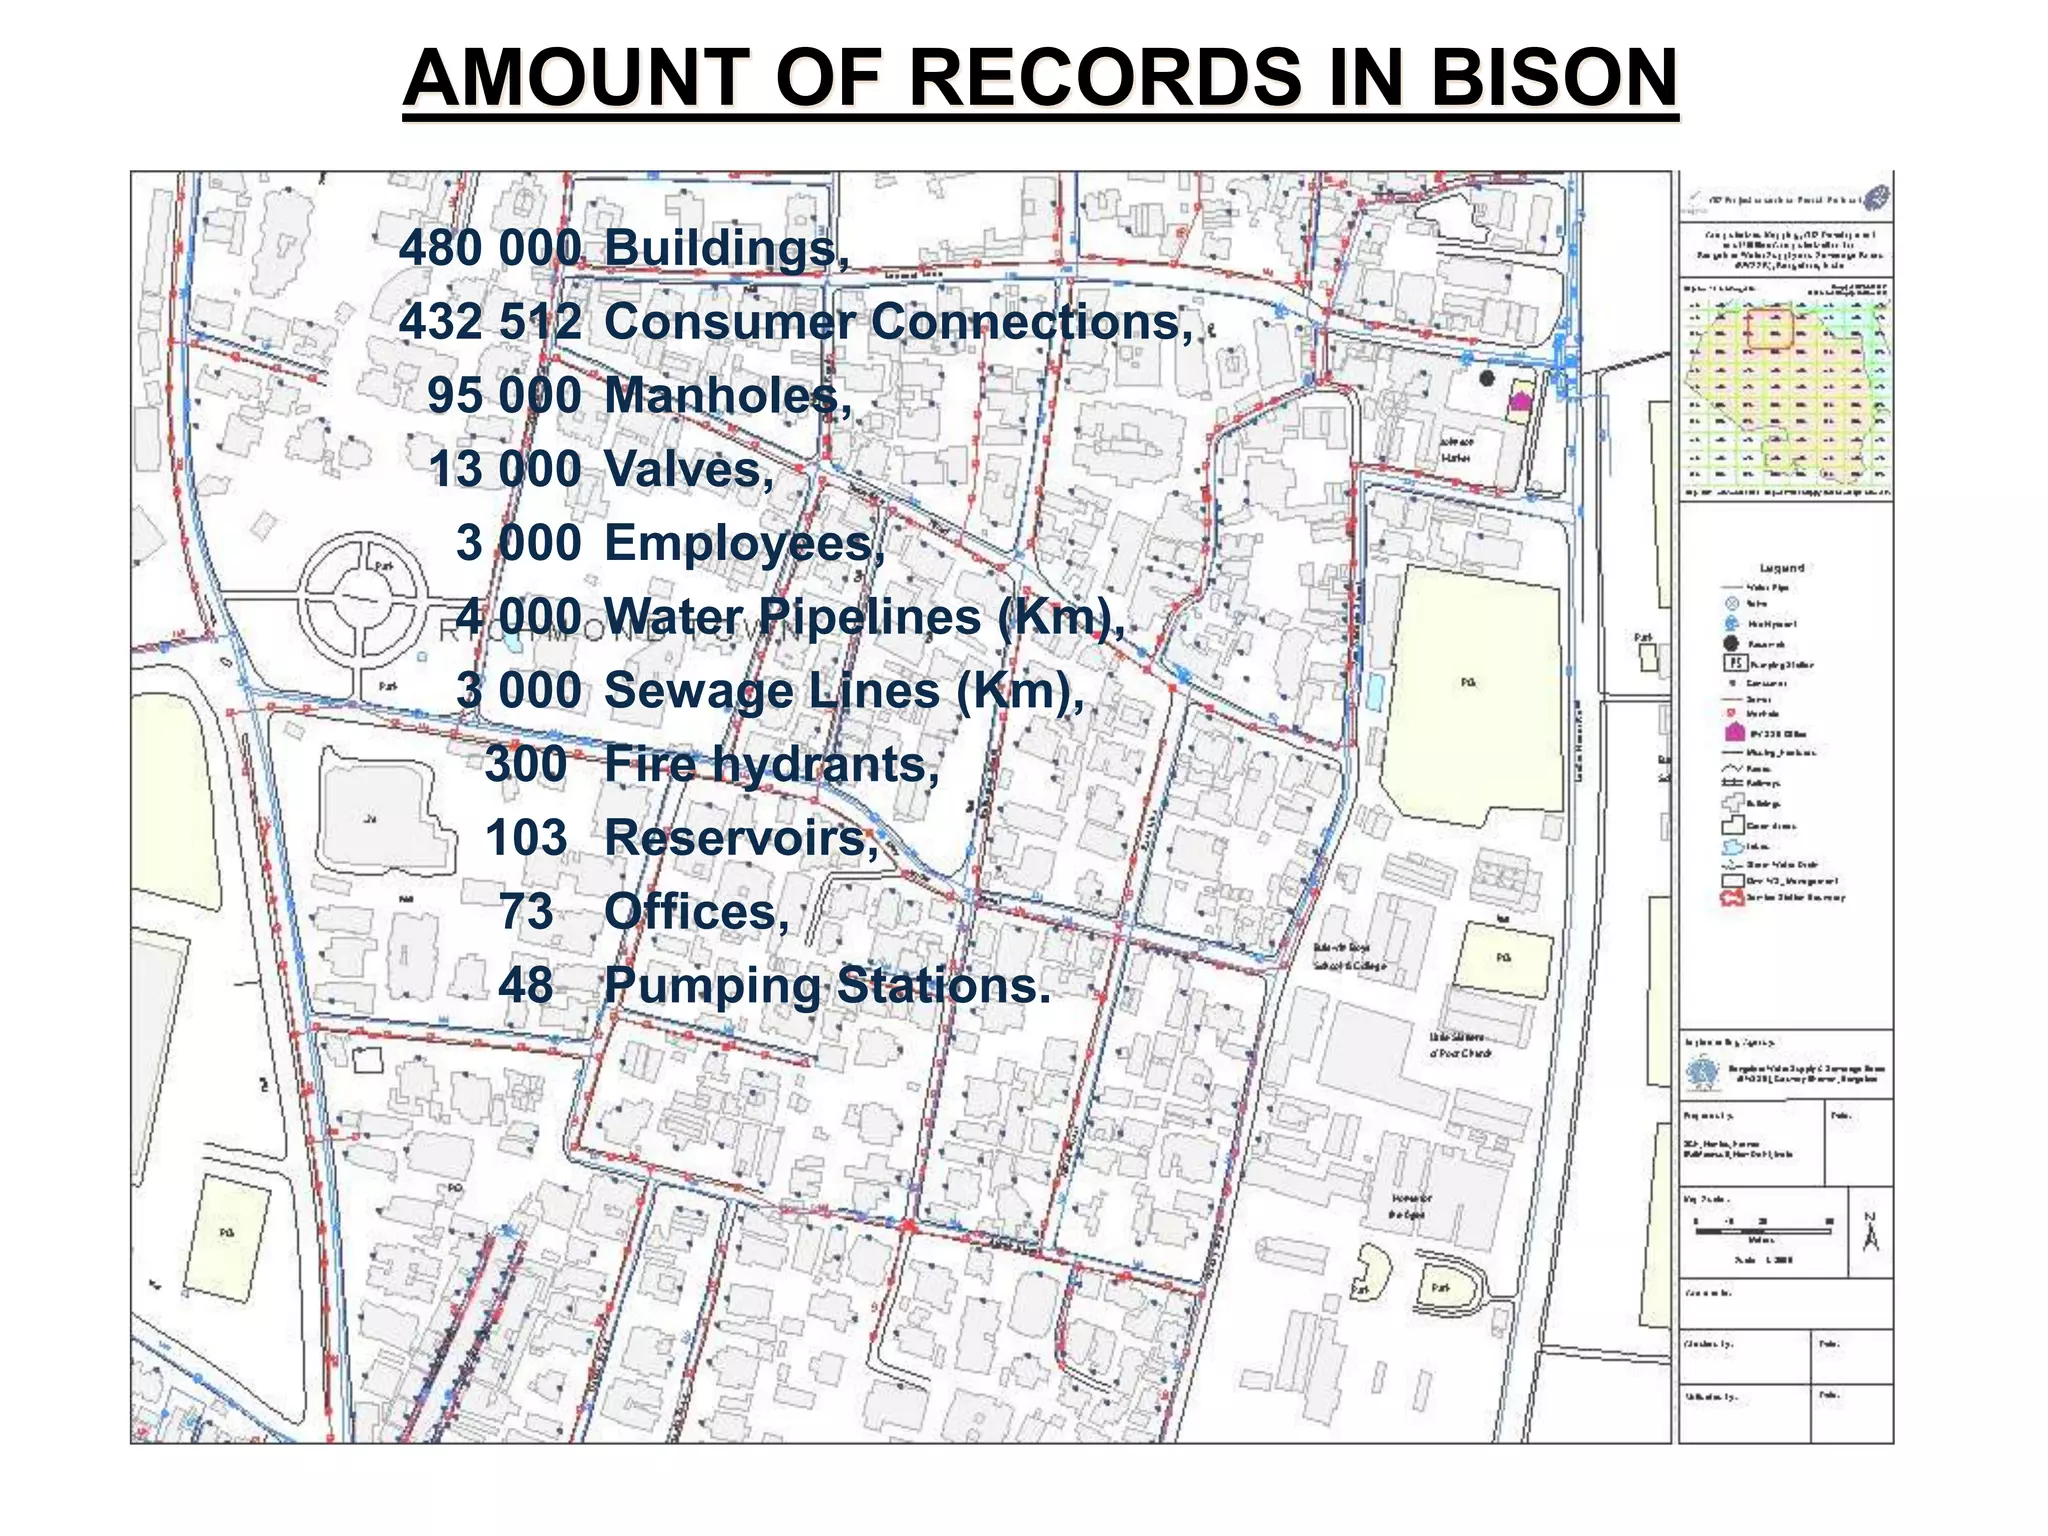
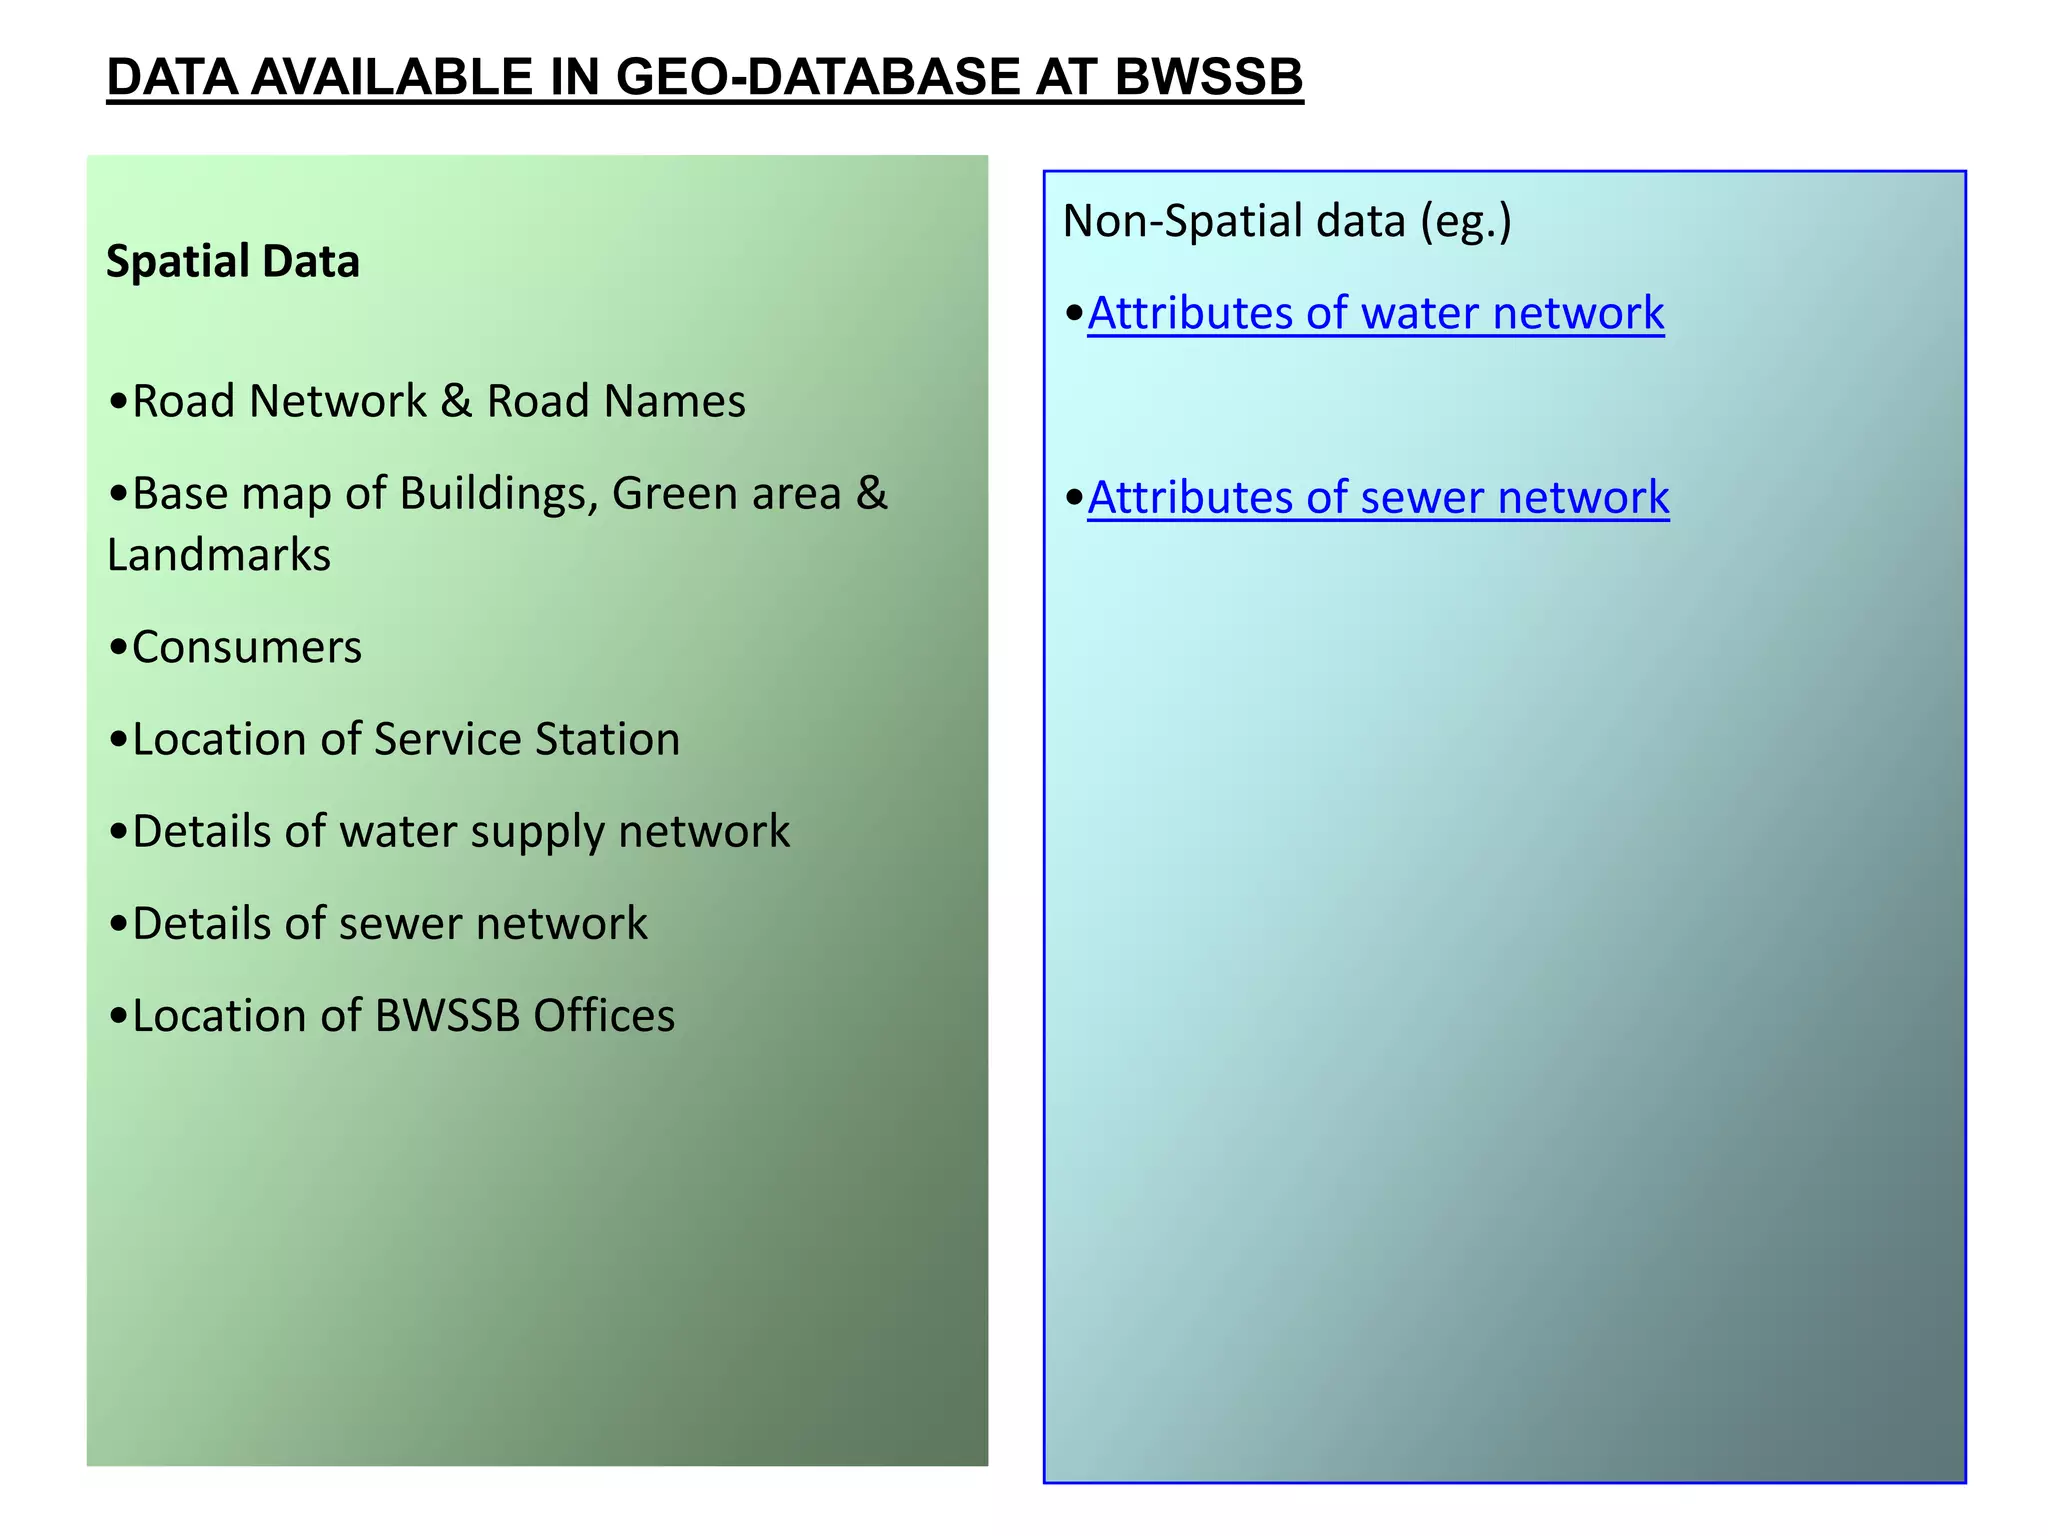
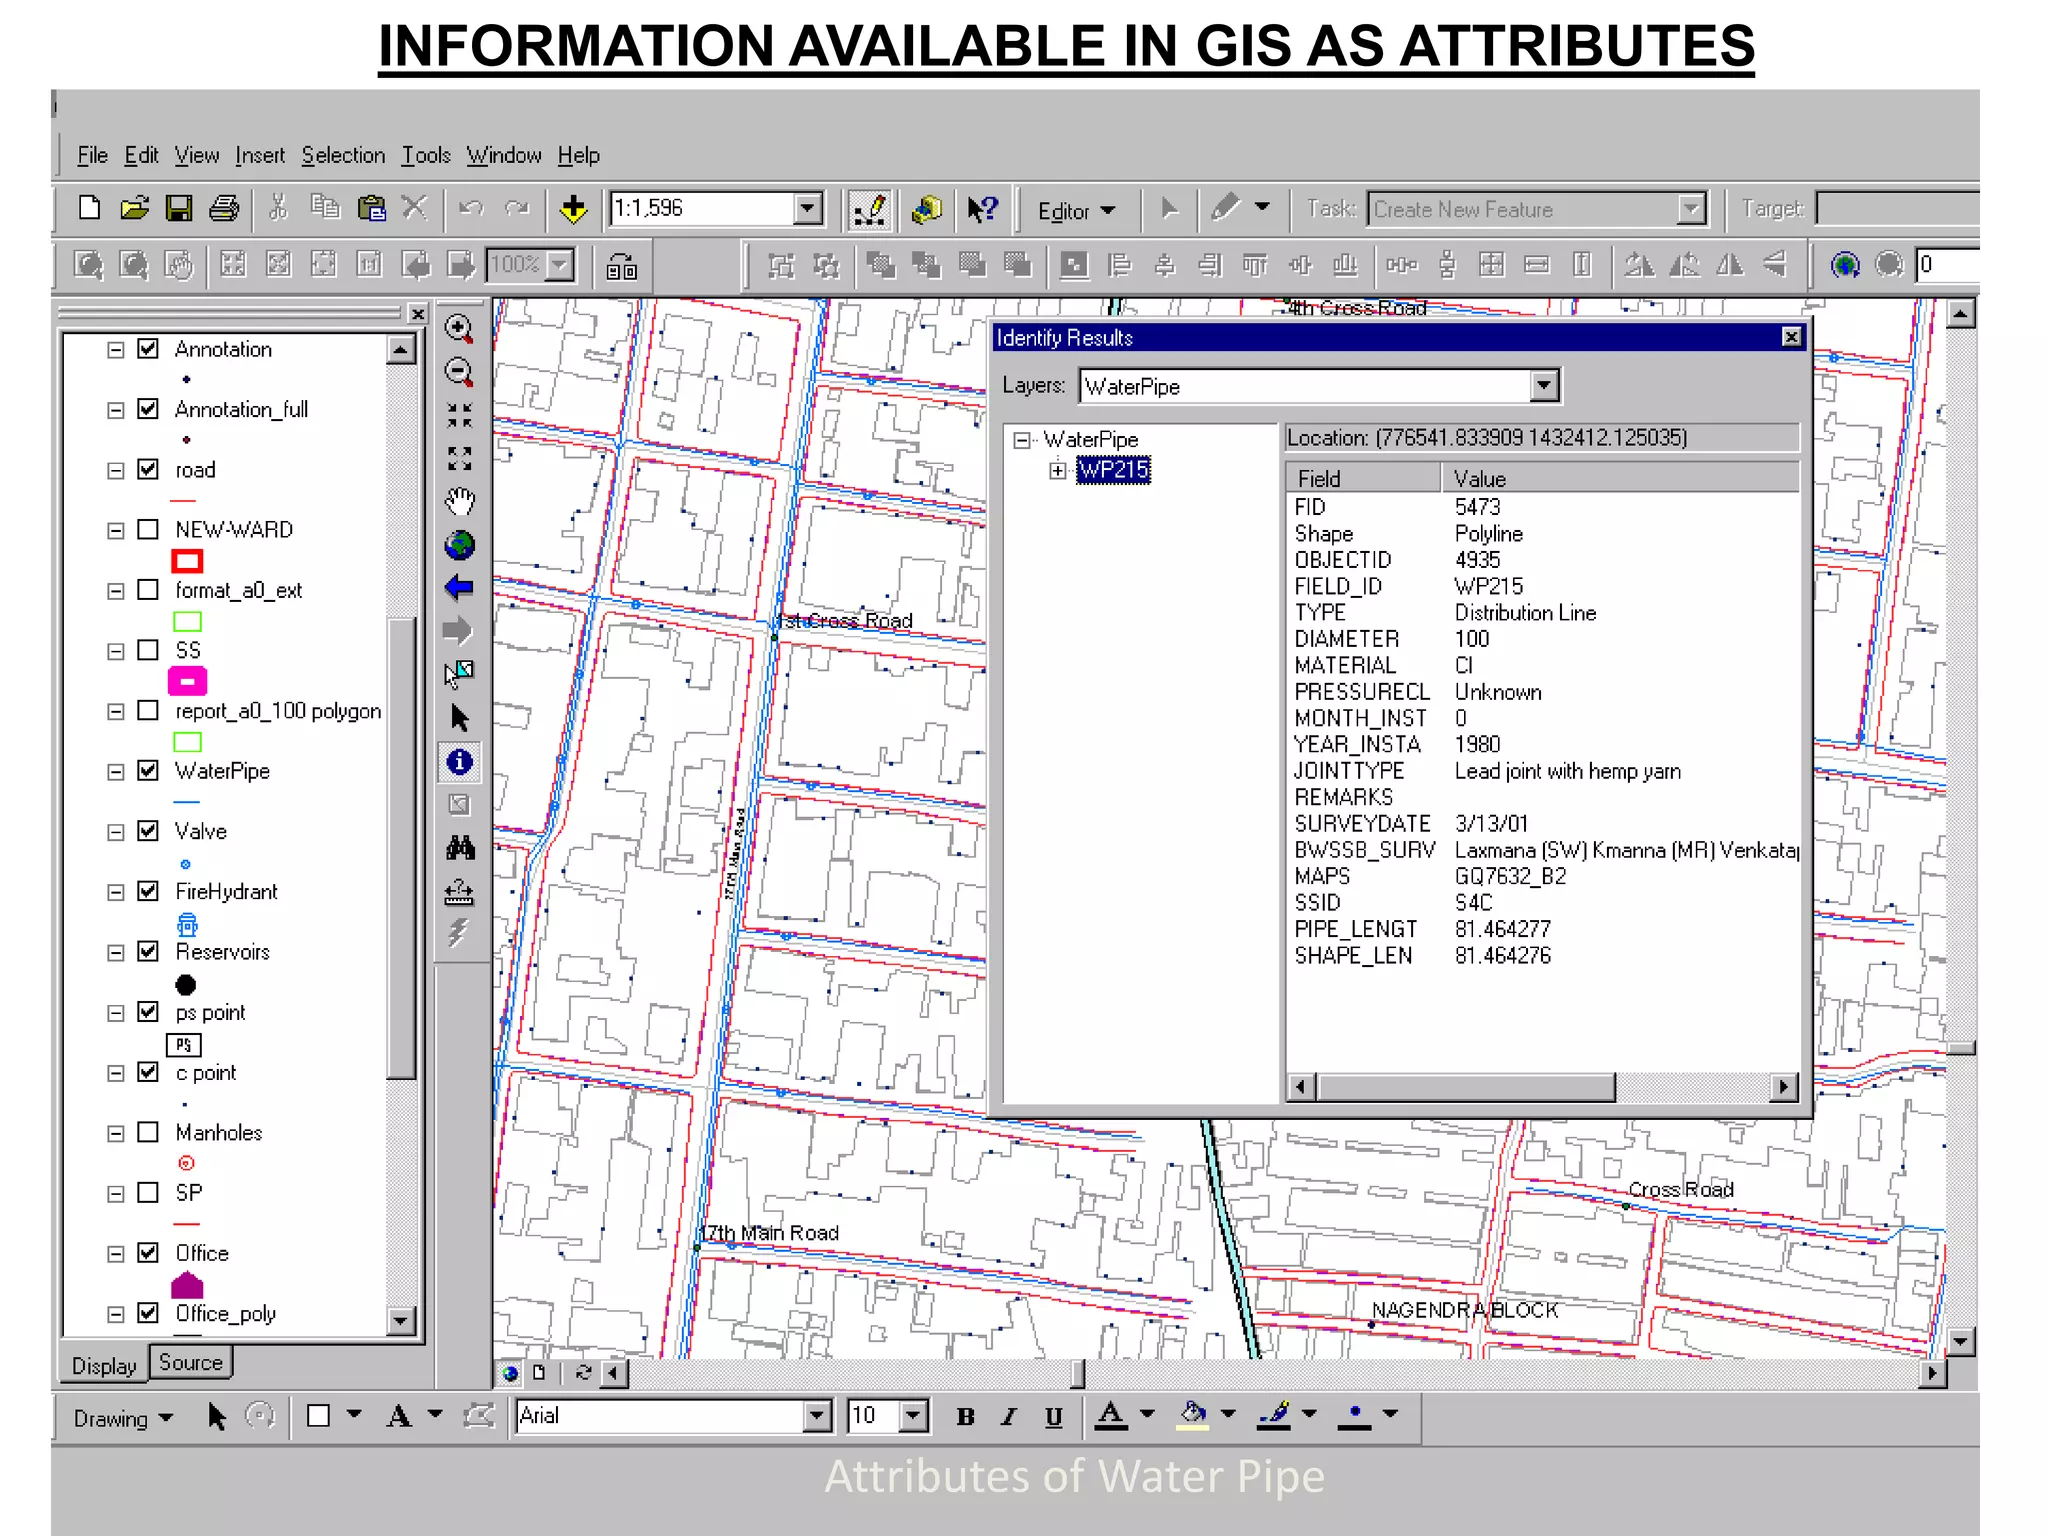
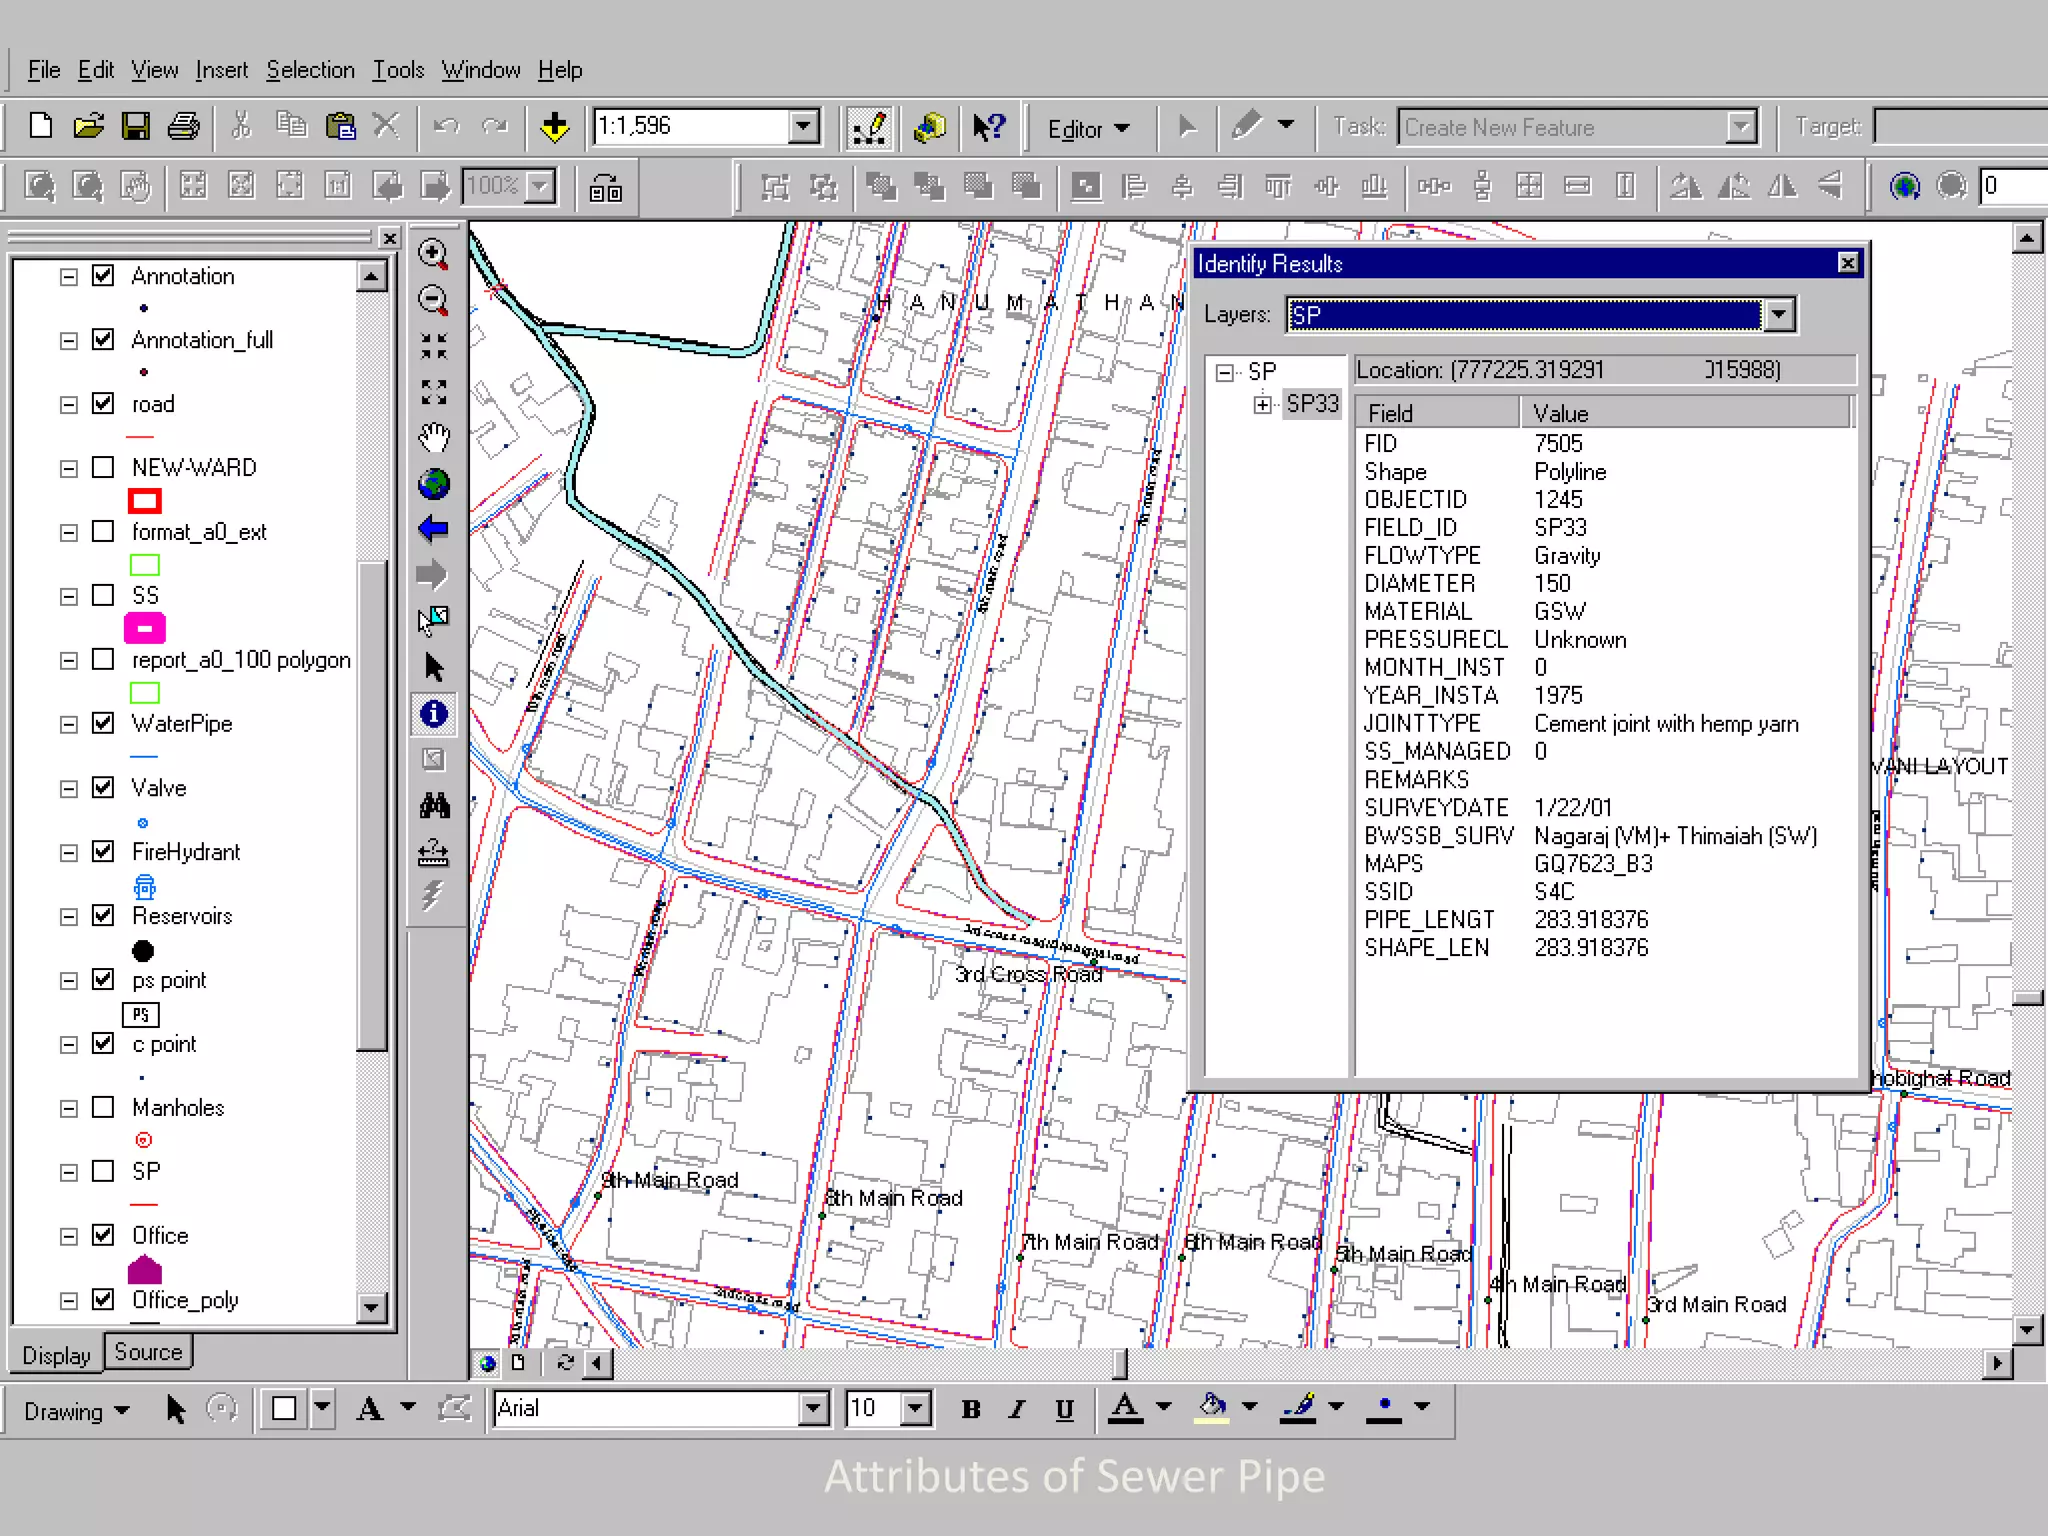
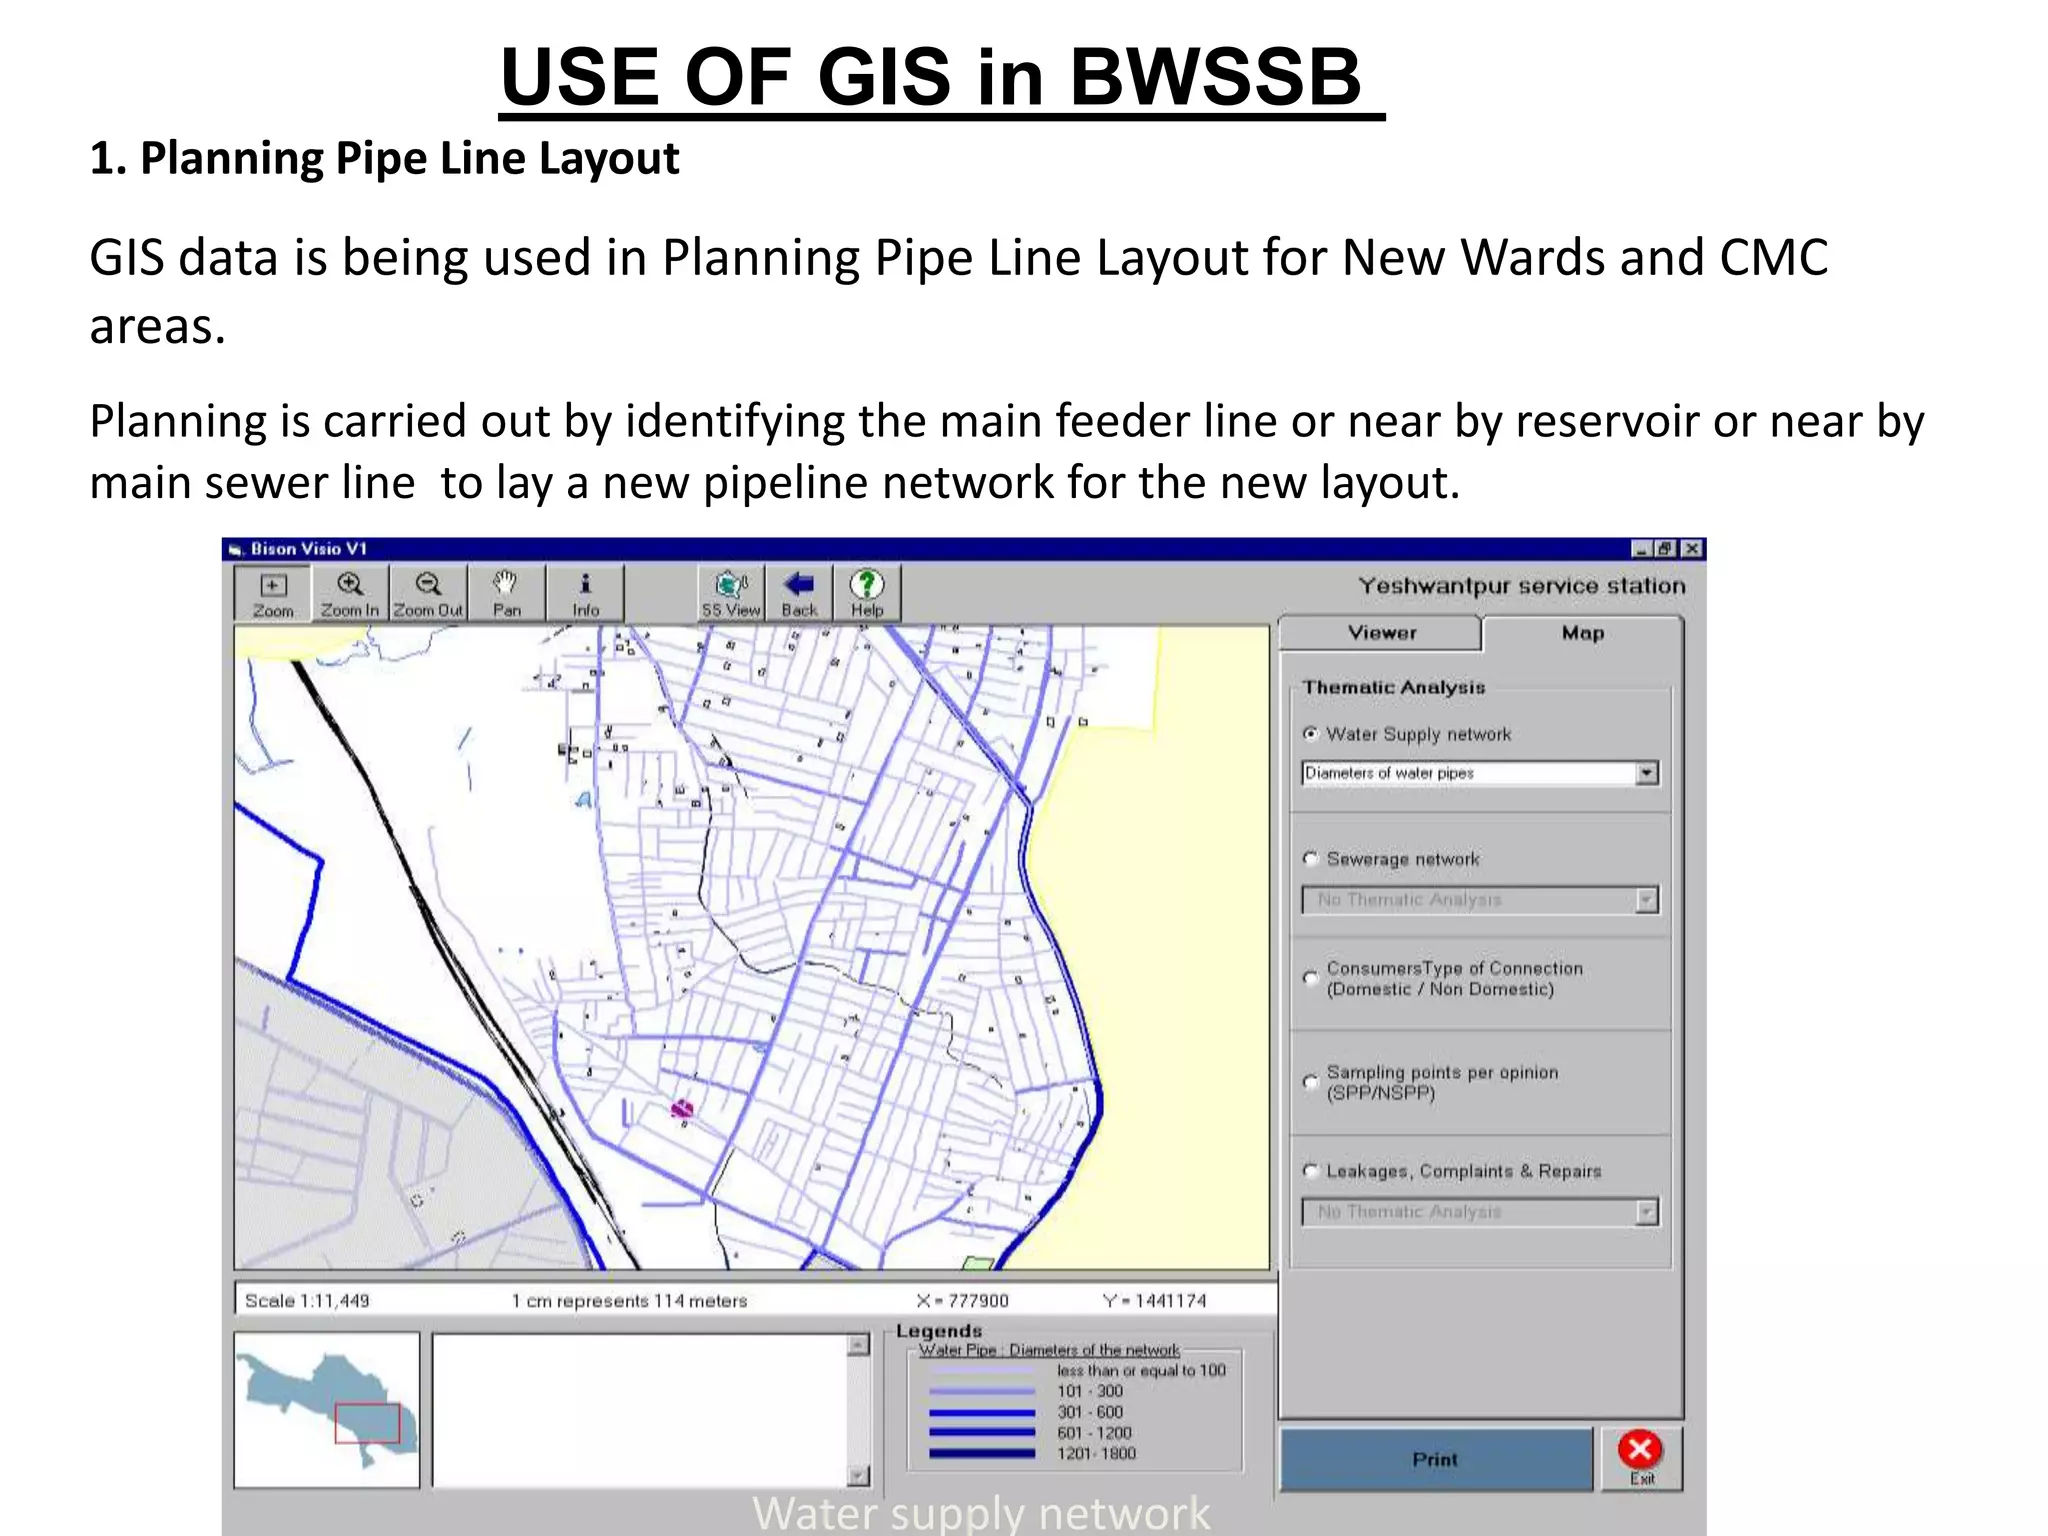
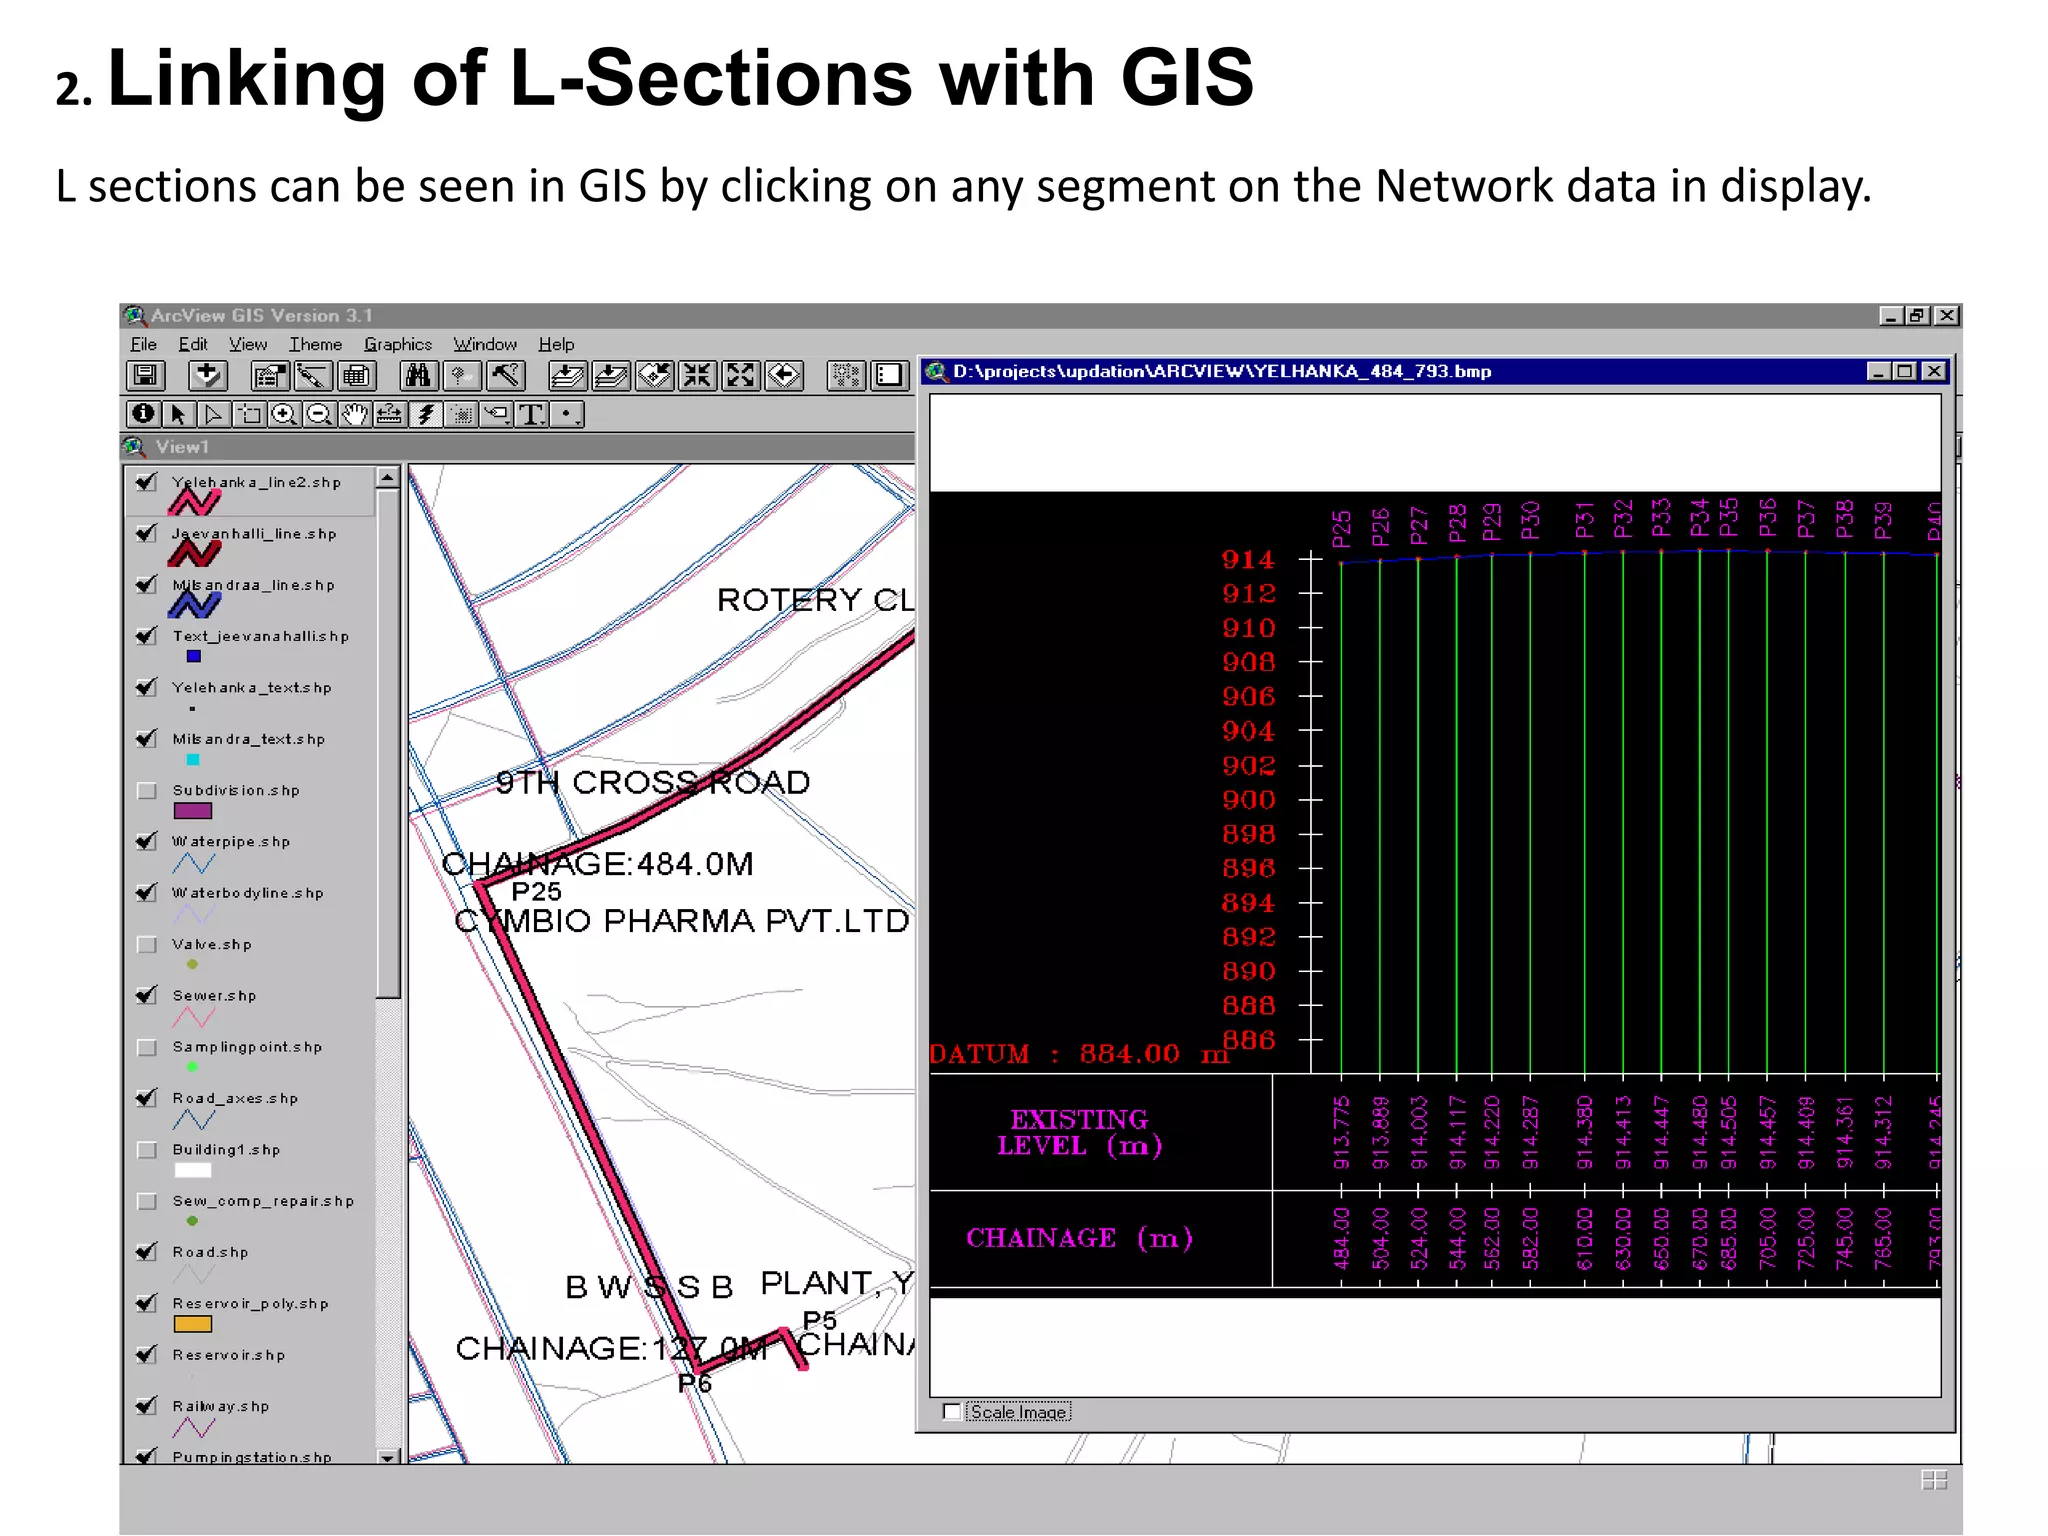
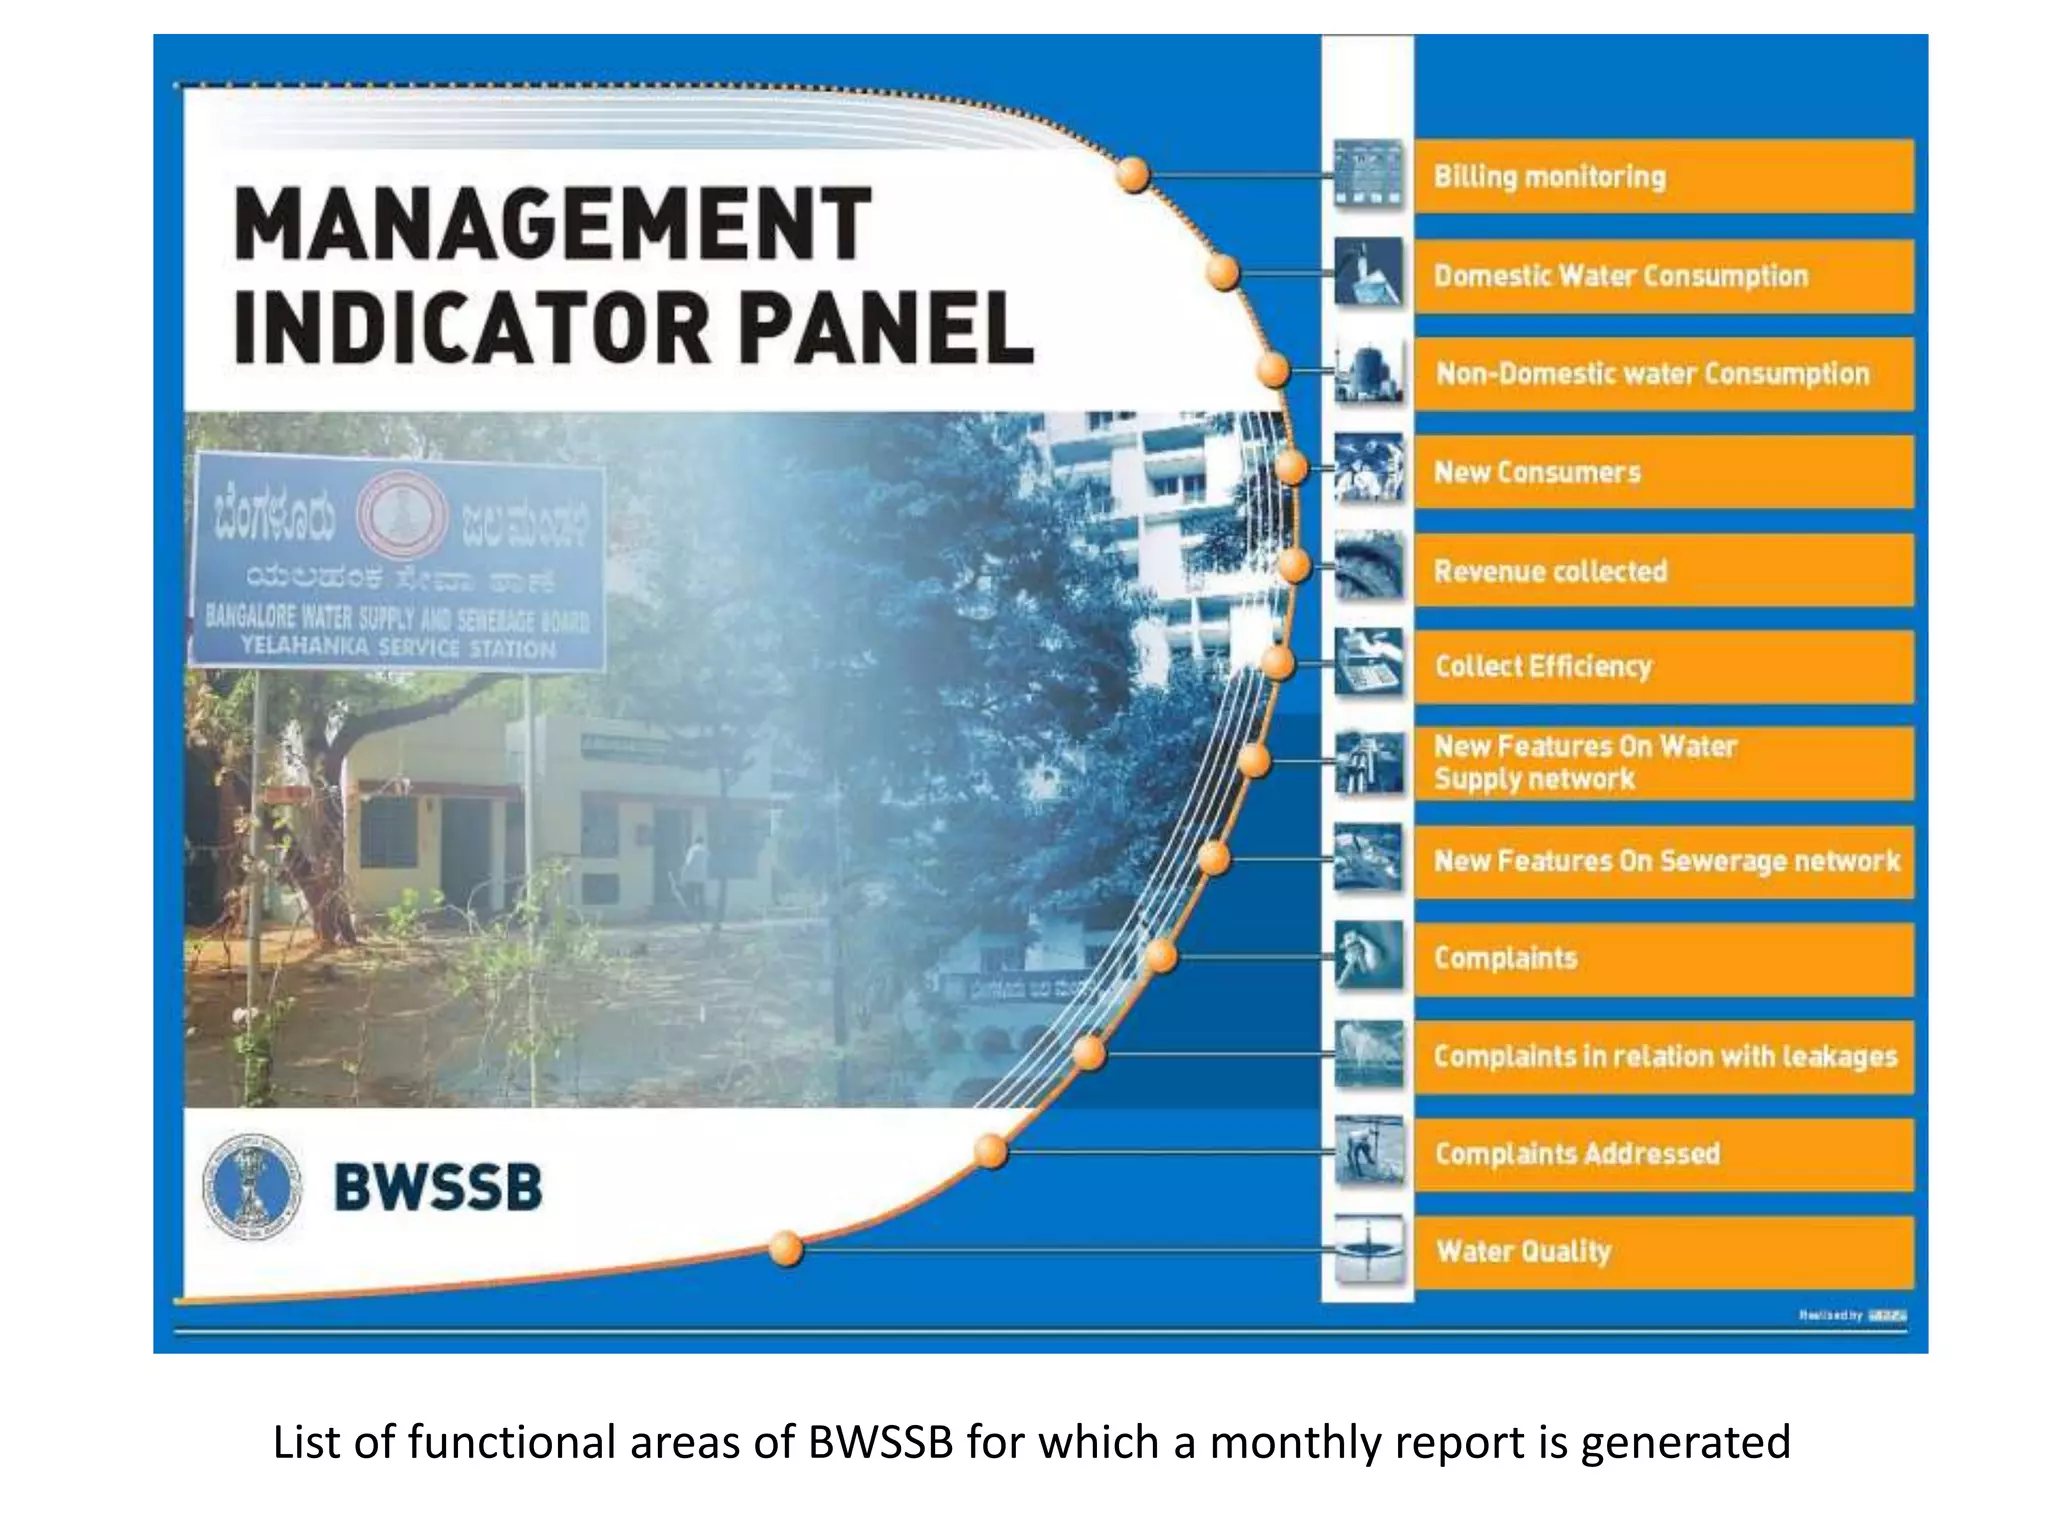
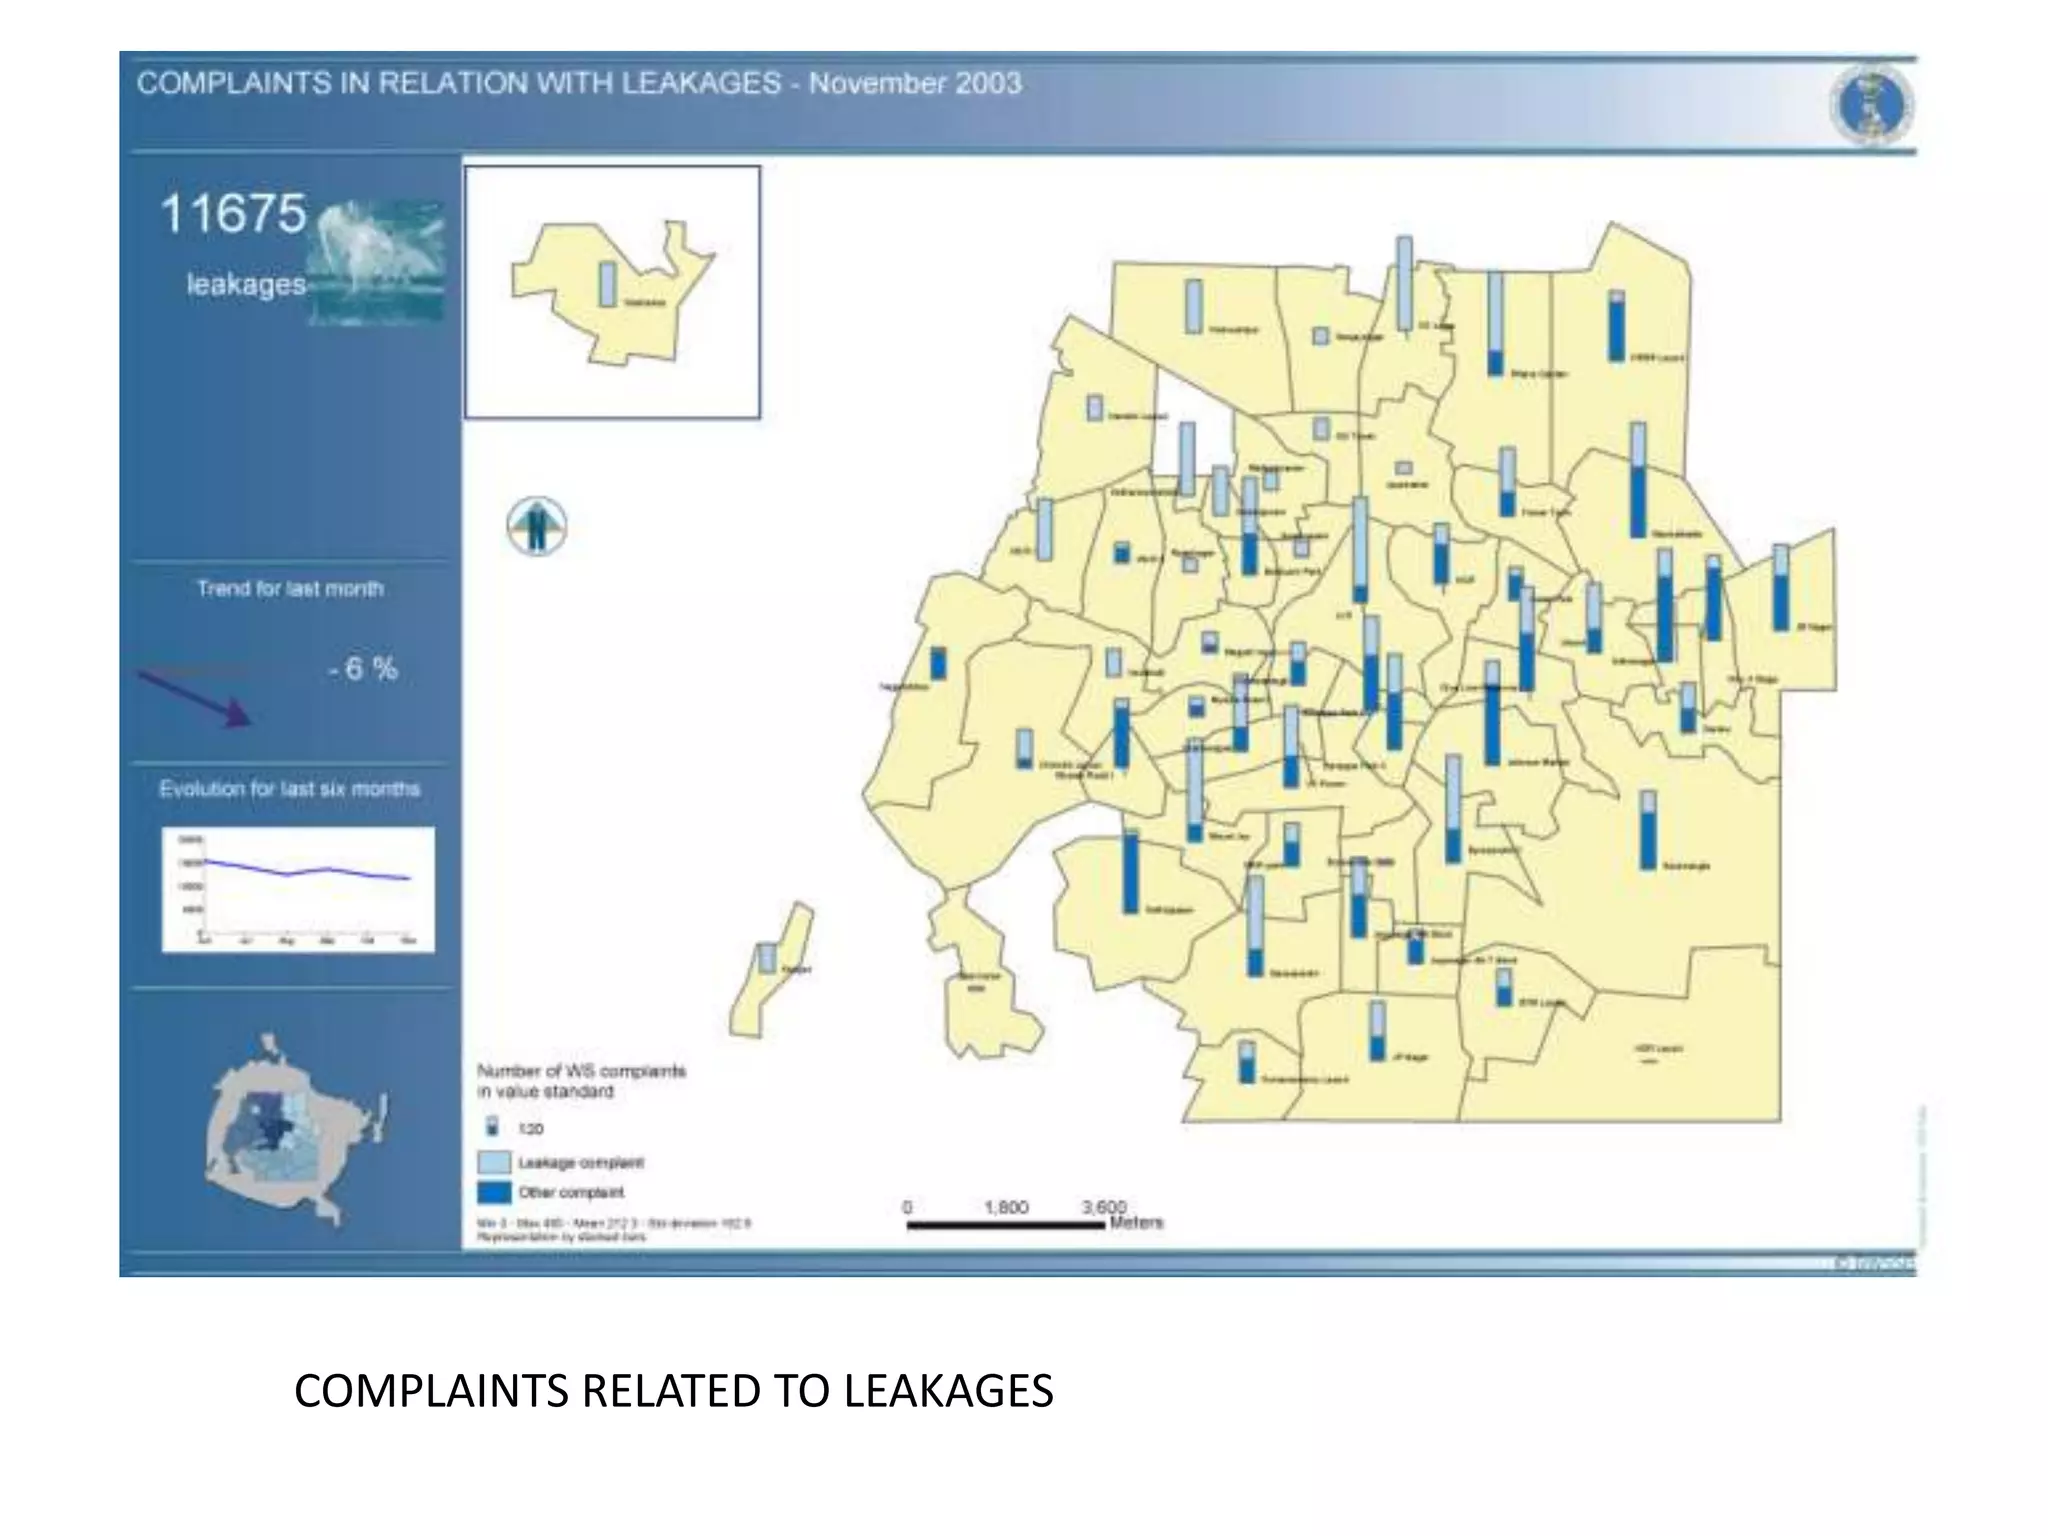
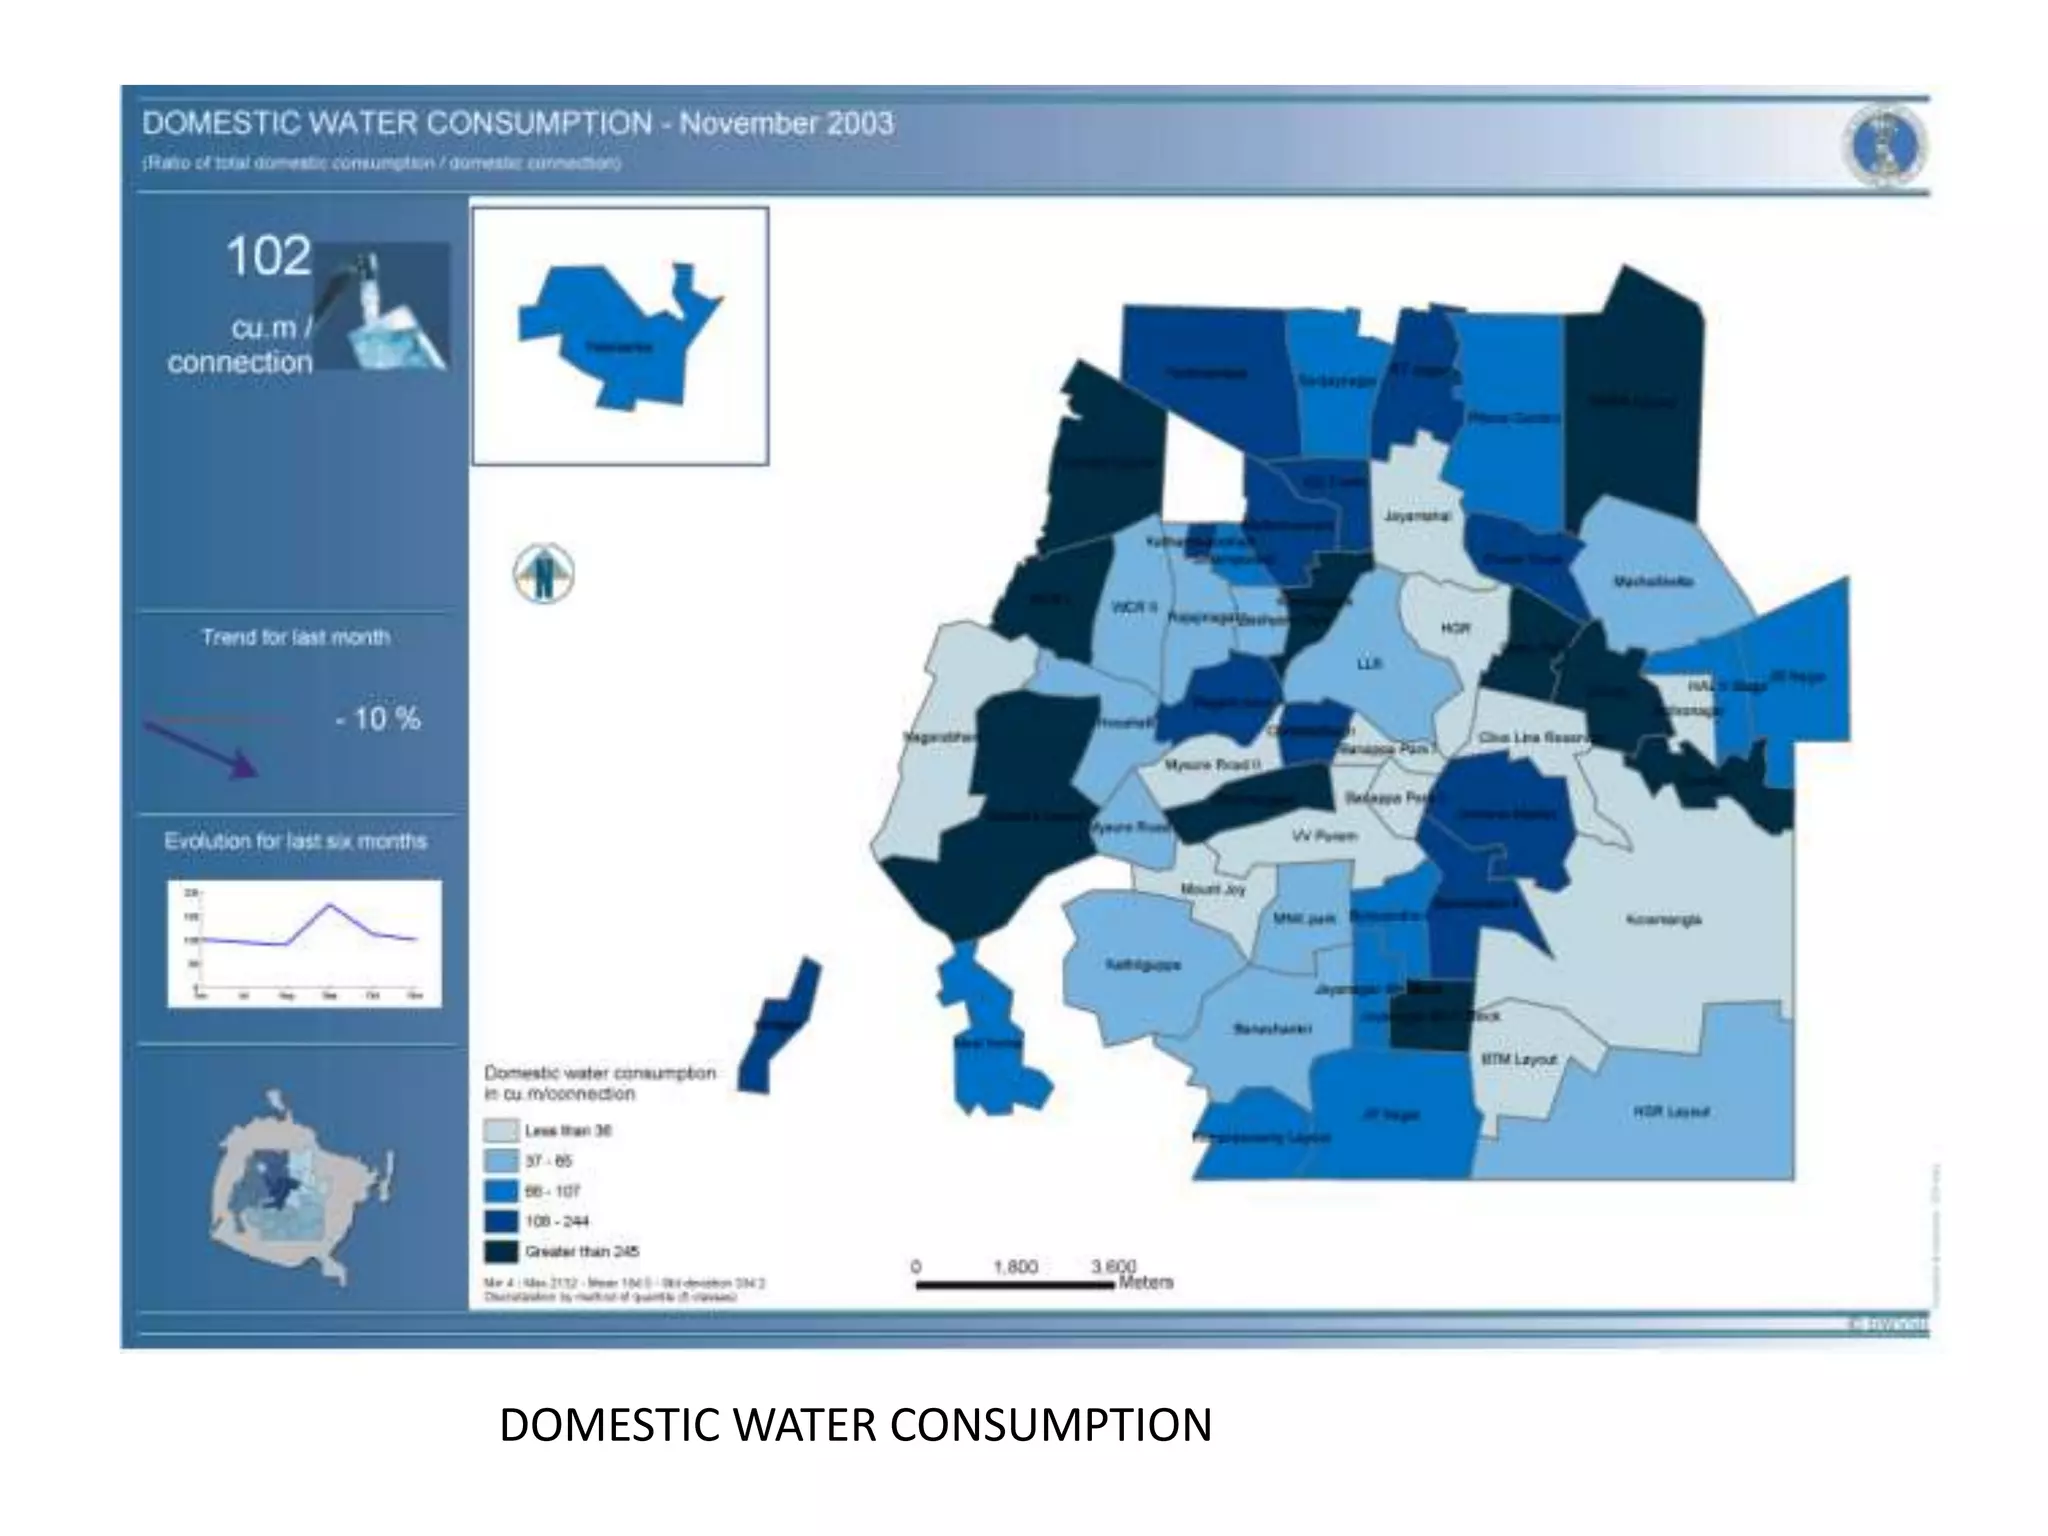
2. GIS
• GIS stands for Geographic Information System
• GIS is the merging of cartography, statistical
analysis, and database technology.
• It is achieved by combining software and
hardware
• Generally, a GIS is custom-designed for an
organization.
3. GIS @ Banglore
• BWSSB moved forward on developing a
GEOGRAPHICAL INFORMATION SYSTEM (GIS)
in 1998-99.
• BWSSB and other Civic Bodies of BANGALORE
(BDA , BMP & BESCOM) pooled resources for
obtaining Aerial Photography of Bangalore from
the NATIONAL REMOTE SENSING AGENCY
(NRSA).
• NRSA has supplied a photogrammetrically
compiled Base Map to BWSSB covering an area
of 290 Sq Kms.
4. • BWSSB under the Indo-French protocol in 1999
assigned the work of developing a GIS System to M/s
SCE France. This led to the development of BISON
(Bangalore Information System on Networks)
applications for the operational activities of BWSSB.
The GIS development was completed in the year
2002.
• Genesys International Corporation Ltd, an
internationally known, ISO 9001-2000, GIS and
mapping company, has taken charge of
Implementation and Maintenance of GIS at BWSSB
w.e.f Nov 2003.
5. GIS SETUP IN BWSSB
HO
Central East
West
North
South
11 SS
14 SS
14 SS
9 SS
8 SS
6. BWSSB Head Office is connected to all its Divisional Offices through
LAN/WAN
The GIS Hardware/Software setup at BWSSB is as below:
Hardware / Software
Head Office – One Server with 5 PIII workstations, One Plotter,
Scanner and A3 Colour Printer, with ArcInfo 8.1, Arc SDE
(Spatial Database Engine), ArcView 8.0, ArcPress and Oracle 8i
RDBMS
Divisional – One Server with 2 PIII workstations and A3
offices Printer, Software - Arcview 3.1 and Oracle
RDBMS
Service Stations – One Desktop PC with Printer
7. BISON MODULES AND THEIR
APPLICATIONS
Database
Management
Data Updation Decision Support Tool
Chairman
Chief Engineers
Updation
Viewer
Cartography
Communication
tool
9. 480 000 Buildings,
432 512 Consumer Connections,
95 000 Manholes,
13 000 Valves,
3 000 Employees,
4 000 Water Pipelines (Km),
3 000 Sewage Lines (Km),
300 Fire hydrants,
103 Reservoirs,
73 Offices,
48 Pumping Stations.
AMOUNT OF RECORDS IN BISON
10. DATA AVAILABLE IN GEO-DATABASE AT BWSSB
Spatial Data
•Road Network & Road Names
•Base map of Buildings, Green area &
Landmarks
•Consumers
•Location of Service Station
•Details of water supply network
•Details of sewer network
•Location of BWSSB Offices
Non-Spatial data (eg.)
•Attributes of water network
•Attributes of sewer network
13. 1. Planning Pipe Line Layout
GIS data is being used in Planning Pipe Line Layout for New Wards and CMC
areas.
Planning is carried out by identifying the main feeder line or near by reservoir or near by
main sewer line to lay a new pipeline network for the new layout.
Water supply network
USE OF GIS in BWSSB
14. 2. Linking of L-Sections with GIS
L sections can be seen in GIS by clicking on any segment on the Network data in display.
15. 3. Facilitating Complaint Management and Maintenance Work
System is designed to cater to the need for addressing Complaints
related to the Water and Sewage Network.
The output from the System enables :
a. Quick identification of Location from the digital map
b. Better appreciation of the problem, as a holistic view of the network
area is available.
c. Connectivity with Service Stations provides speedy implementation
of corrective action.
d. A Database of all interactions is maintained and this serves as an
input for periodic analysis and decision making at Apex Level.
16. 4. Thematic Analysis of Water Supply Distribution
Water Connection patterns like domestic, non domestic,partial domestic, industrial etc.
17. 5. Water Quality Check
Data on the results of Water Quality Testing, done at the BWSSB laboratory, is stored
in the GIS for Analysis and Corrective action when required.
SAMPLING POINTS
18. MIS EMBEDDED IN GIS
STATISTICAL REPORTS
CONSUMERS
COMPLAINTS
MAINTENANCE
MANAGEMENT INDICATOR PANEL (MIP)
19. An example - Statistical report on length of pipe lines for the city of Bangalore.The
statistics show the lengths of pipes for both sewer and water, Service Station wise.
20. List of functional areas of BWSSB for which a monthly report is generated