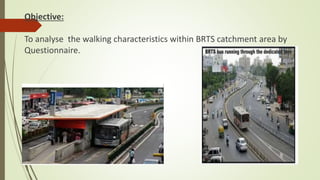
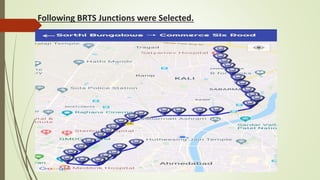
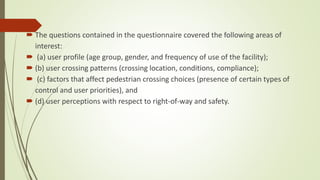
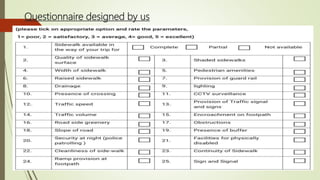
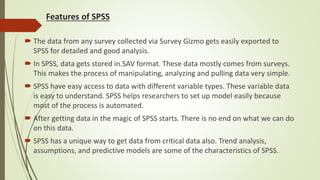
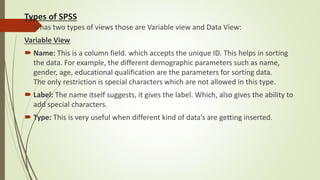
1. UNIVERSITY PROJECT:WALK CHARACTERISTICS WITHIN BRTS
CATCHMENT AREA :A CASE STUDY OF AHMEDABAD BRTS
GUIDED BY : PROF. BIVINA GEETHA RAJENDRAN
SUBMITTED BY: ABHISHEK YADAV(16BCL003)
AXAY SHARMA(16BCL008)
DEEP SHAH(16BCL018)
3. BRIEF ABOUT AHMEDABAD BRTS
Ahmedabad is the largest city and former capital of the western Indian state of
Gujarat. It is the administrative headquarters of the Ahmedabad district and the
seat of the Gujarat High court. With population of more than 5.8 million and an
extended population of 6.3 million, it is the fifth- largest and seventh-largest
metropolitan area of India.
Public transportation is one of the important component of urban transport
system, particularly in a city like Ahmedabad. Today in the city , the utilization of
Bus Rapid Transit System (BRTS) is increasing day by day looking for cost effective
transit solutions and for environmental concerns. In such a situation it becomes
quite essential to understand the degree of accessibility and the walking
characteristics within BRTS catchment area.
4. In Bus Rapid Transit System, Buses move in the dedicated lanes at high speed
without the obstruction from vehicle crossing the lanes. BRTS-Ahmadabad also
known as JANMARG is a bus rapid transit system in Ahmadabad, India. Technical
procedures were started in 2006.
Public transport is used as a major mode of transportation in metropolitan cities.
Using public transport helps in reducing pollution, congestion on roads.
Patronage of a public transport system depends on factors like availability and
quality of walkways, connectivity of walkways. So efficient design of walkways is
a significant factor for successful operation of a bus rapid transit system.
5. LITERATURE REVIEW
It was found that BRT could attract significantly private vehicles users to change mode
choice. The proportion of motorcycle users shifting is higher than passenger car
users.(REFERENCE:T. Satienman et al. /IATSS Research 39(2016)121-129.
It has already been observed from studies in the USA that when development
concentrates along the corridors, transit patronage increases. However ,in the
Ahmedabad context , this relationship is missing ,which may be due to a lack of
utilization of land along the corridors. An increase in diversity can be done by
increasing the height of buildings and hence the FSI.(REFERENCE: Urban Sci.2018
,2,95;doi:10.3390/urbansci2040095).
6. From research papers it was found that land-use diversity ,road connectivity ,
and job accessibility by BRTS were found to be relatively low in that
area.(REFERENCE: IJSRD-International Journal for scientific Research and
development |Vol.2,Issue 12,2015|ISSN(online):2321-0613)
7. FACTORS AFFECTING TRANSIT ACCESSIBILITY
Socio and Demographic Factors such as age, gender,educational level, income
and occupation, size.
Climatic factors such as temperature , humidity , availability of daylight hours ,
heat, Precipitation etc.
Topography such as hilly , plain , undulated areas.
Average walk trip distance and Travel time.
Purpose of walking.
8. Land use of surrounding area whether it is residential , commercial or an open
place.
Station area street characteristics i.e. availability of sidewalk , quality and size of
streets as well as sidewalk ,connectivity, provision of rain shelters, aesthetics,
lighting, safety and security.
Availability of alternative modes.
Regional accessibility : It refers to a location relative to the regional urban centre
(either a central city or central business district), or the number of jobs and
public services available within a given travel distance or time.
Density: It refers to the number of homes, people or jobs per unit of area.
9. Centricity (also called centeredness) : It refers to the portion of employment,
commercial, entertainment, and other major activities concentrated in multi-
modal centers, such as central business districts (CBDs), downtowns and large
industrial parks
Connectivity : It refers to the degree to which a road or path system is
connected, and therefore the directness of travel between destinations.
10. METHODOLOGY ADOPTED
Reviewing various research papers to get an idea between ridership and
various important factors.
Collecting the factors which affects the ridership.
Design questionnaire from such factors.
Filling Questionnaire survey from riders perspective.
Analyzing the data from SPSS Software.
12. Design of survey questionnaires
Following points are kept in mind in designing the questionnaire survey:
clear definition of questions.
Reasonable length of questionnaire.
lack of personal or potentially offensive questions.
appropriate format for data coding into computers.
13. The questions contained in the questionnaire covered the following areas of
interest:
(a) user profile (age group, gender, and frequency of use of the facility);
(b) user crossing patterns (crossing location, conditions, compliance);
(c) factors that affect pedestrian crossing choices (presence of certain types of
control and user priorities), and
(d) user perceptions with respect to right-of-way and safety.
15. SOFTWARE :SPSS
SPSS stands for “Statistical Package for the Social Sciences”. It is an IBM tool. This
tool first launched in 1968. This is one software package. This package is mainly
used for statistical analysis of the data.
SPSS is mainly used in the following areas like healthcare, marketing, and
educational research, market researchers, health researchers, survey companies,
education researchers, government, marketing organizations, data miners, and
many others.
It provides data analysis for descriptive statistics, numeral outcome predictions,
and identifying groups. This software also gives data transformation, graphing
and direct marketing features to manage data smoothly.
16. Features of SPSS
The data from any survey collected via Survey Gizmo gets easily exported to
SPSS for detailed and good analysis.
In SPSS, data gets stored in.SAV format. These data mostly comes from surveys.
This makes the process of manipulating, analyzing and pulling data very simple.
SPSS have easy access to data with different variable types. These variable data
is easy to understand. SPSS helps researchers to set up model easily because
most of the process is automated.
After getting data in the magic of SPSS starts. There is no end on what we can do
on this data.
SPSS has a unique way to get data from critical data also. Trend analysis,
assumptions, and predictive models are some of the characteristics of SPSS.
17. SPSS is easy for you to learn, use and apply.
It helps in to get data management system and editing tools handy.
SPSS offers you in-depth statistical capabilities for analyzing the exact outcome.
SPSS helps us to design, plotting, reporting and presentation features for more
clarity.
18. Types of SPSS
It has two types of views those are Variable view and Data View:
Variable View
Name: This is a column field. which accepts the unique ID. This helps in sorting
the data. For example, the different demographic parameters such as name,
gender, age, educational qualification are the parameters for sorting data.
The only restriction is special characters which are not allowed in this type.
Label: The name itself suggests, it gives the label. Which, also gives the ability to
add special characters.
Type: This is very useful when different kind of data’s are getting inserted.
19. Width: We can measure the length of characters.
Decimal: While entering the percentage value this type help us to decide how
much one needs to define the digits required after the decimal.
Value: This helps the user to enter the value.
Missing: This helps the user to skip unnecessary data which is not required
during analysis.
20. Align: Alignment as the name suggests helps to align left or right. But in this case
for ex. Left align.
Measure: This helps to measure the data being entered in the tools like ordinal,
cardinal, nominal.
The data has to enter in the sheet named “variable view”. It allows us to
customize the data type as required for analyzing it.
To analyze the data one needs to populate the different column headings like
Name, Label, Type, Width, Decimals, Values, Missing, Columns, Align, and
Measures.
These headings are the different attributes which, help to characterize the data
accordingly.
21. Data View
The data view is structured as rows and columns. By importing file or adding
data manually we can work with SPSS.
22. Following are the Steps for importing Excel file into SPSS.
First step is to click on File
=> Open
=> Select Data
=> Dialog Box
=> Files of type
=> .xls file.
After selecting the excel file which is going to be imported for performing the
data analysis, we need to ensure that in the dialog box which we selected is
“read variable names from the first row of data”.
And at the end click OK. Your file has now imported in SPSS.
23. Conclusion
The bottom line is though Excel offers a good way of data organization, SPSS is
more suitable for in-depth data analysis. This tool is very useful in the analysis
and visualization of data.