Downloaded 10 times


![Lessons learned
table structure [ tidy data ]
To allow your data to be easily:
imported by data management systems;
analyzed by analysis software, and ;
combined with other data (interoperability)
make sure that:
each row represents a single observation (record)
each column represents a single variable (parameter) or type of measurement
(field)
every cell contains only one piece of information (no highlighting of cells)
there is only one table for each type of information (no multiple worksheets)
Cross-tab structure / contingency table: different columns contain measurements of
the same variable: easier to read but difficult to add data (columns) to the records
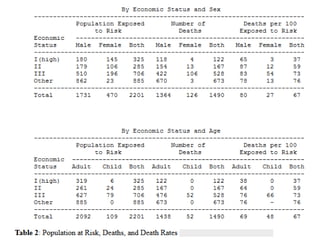
(rows). See Titanic table versus Titanic raw data
“The problem is that people like to view data in a totally different way than a computer
likes to process it.” (Kien Leong)](https://image.slidesharecdn.com/proofrdm2016part4versie2016-03-01-160302150811/85/A-basic-course-on-Research-data-management-part-4-caring-for-your-data-or-making-data-reusable-8-320.jpg)


![Data Coach [ website ]
TU/e data librarians (datacoach@tue.nl)
Leon Osinski, Sjef Öllers
Recommended reading
Van den Eynden, Veerle e.a. (2011), Managing and sharing data: best
practice for researchers, UK Data Archive
Strasser, Carly (2015), Research data management, NISO
Recommended online course
Essentials 4 data support [English & Dutch]
Support](https://image.slidesharecdn.com/proofrdm2016part4versie2016-03-01-160302150811/85/A-basic-course-on-Research-data-management-part-4-caring-for-your-data-or-making-data-reusable-13-320.jpg)


This document provides an overview of research data management, focusing on making data reusable and accessible through good practices. It emphasizes the importance of metadata, data organization, and long-term data availability, offering various tools and resources for effective data management. Additionally, it discusses the necessity of documenting datasets properly to ensure usability and interoperability.


![Research data management : [part of] PROOF course Finding and controlling sci...](https://cdn.slidesharecdn.com/ss_thumbnails/proofrdm19-11-2014-141119054859-conversion-gate02-thumbnail.jpg?width=640&height=640&fit=bounds)


