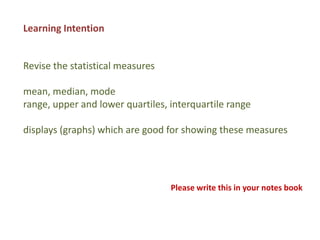
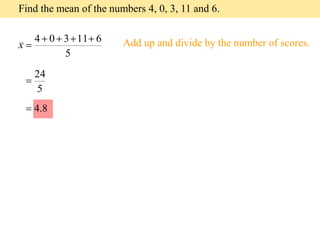
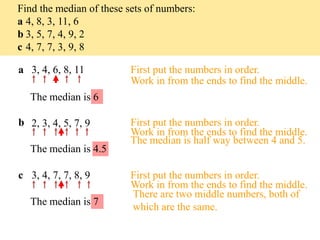
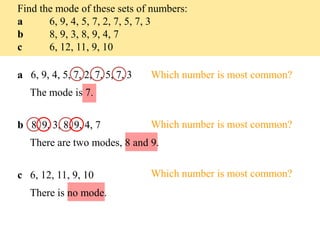
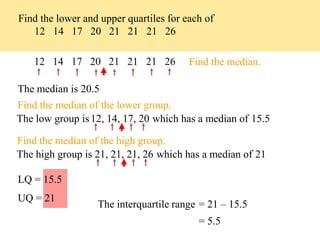
The document provides instruction on calculating and displaying various statistical measures including the mean, median, mode, range, quartiles, and interquartile range. It includes examples of finding these measures for different data sets and discusses box plots and histograms as good graph types for visualizing the data. Learners are asked to use a graphics calculator to calculate these statistical measures and display them in a box plot graph.


![Mean, Mode, Median[1]](https://cdn.slidesharecdn.com/ss_thumbnails/meanmodemedian1-100111162840-phpapp01-thumbnail.jpg?width=640&height=640&fit=bounds)


![Report in al1[1]](https://cdn.slidesharecdn.com/ss_thumbnails/reportinal11-130912002650-phpapp01-thumbnail.jpg?width=640&height=640&fit=bounds)


