Beyond the EU: DORA and NIS 2 Directive's Global Impact
Construct Two-Way Tables and Interpret Relative Frequencies
1. Course 3, Lesson 9-3
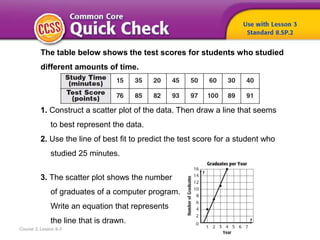
The table below shows the test scores for students who studied
different amounts of time.
1. Construct a scatter plot of the data. Then draw a line that seems
to best represent the data.
2. Use the line of best fit to predict the test score for a student who
studied 25 minutes.
3. The scatter plot shows the number
of graduates of a computer program.
Write an equation that represents
the line that is drawn.
7. 1
Need Another Example?
2
Step-by-Step Example
1. Felipe surveyed students at his school. He found that 78 students
own a cell phone and 57 of those students own an MP3 player.
There are 13 students that do not own a cell phone, but own an
MP3 player. Nine students do not own either device. Construct a
two-way table summarizing the data.
Create a table using the two
categories: cell phones and
MP3 players. Fill in the table
with the given values.
Use reasoning to complete the
table. Remember, the totals are
for each row and column. The
column labeled “Total” should
have the same sum as the row
labeled “Total.”
21
22
30 10070
8. Answer
Need Another Example?
The eighth grade class went to a water park. Out of the
65 students who went to the park, 17 swam in the wave
pool. There were a total of 46 students who rode down
the water slide and 16 of those also swam in the wave
pool. Construct a two-way table to summarize the data.
9. 1
Need Another Example?
2
3
Step-by-Step Example
2. Find and interpret the relative frequencies of students in the survey from
Example 1 by row.
To find the relative frequencies by row, write the ratios of each value
to the total in that row. Round to the nearest hundredth.
Based on the relative frequency value of 0.73 in one of the cells, you can
imply that most students that own a cell phone also own an MP3 player. The
data also suggest that over half of the students that do not own a cell phone
will own an MP3 player.
Only the totals needed are shown in the table.
10. Answer
Need Another Example?
People at a movie theater were surveyed about whether they bought popcorn
or soda. Find and interpret the relative frequencies of people in the survey by
row. Round to the nearest hundredth if necessary.
Sample answer: Over half of the people that
bought soda also bought popcorn. About half
of the people that did not buy soda bought
popcorn.
11. How did what you learned
today help you answer the
How are patterns used
when comparing two quantities?
Course 3, Lesson 9-3
GeometryStatistics and Probability
12. How did what you learned
today help you answer the
How are patterns used
when comparing two quantities?
Course 3, Lesson 9-3
GeometryStatistics and Probability
Sample answers:
• You can analyze information about a group by
constructing a two-way table.
• By examining the relative frequencies, you can
determine possible associations between two different
categories from the same group.
13. How can you use a
Venn diagram to construct
a two-way table?
Course 3, Lesson 9-3
Ratios and Proportional RelationshipsFunctionsStatistics and Probability