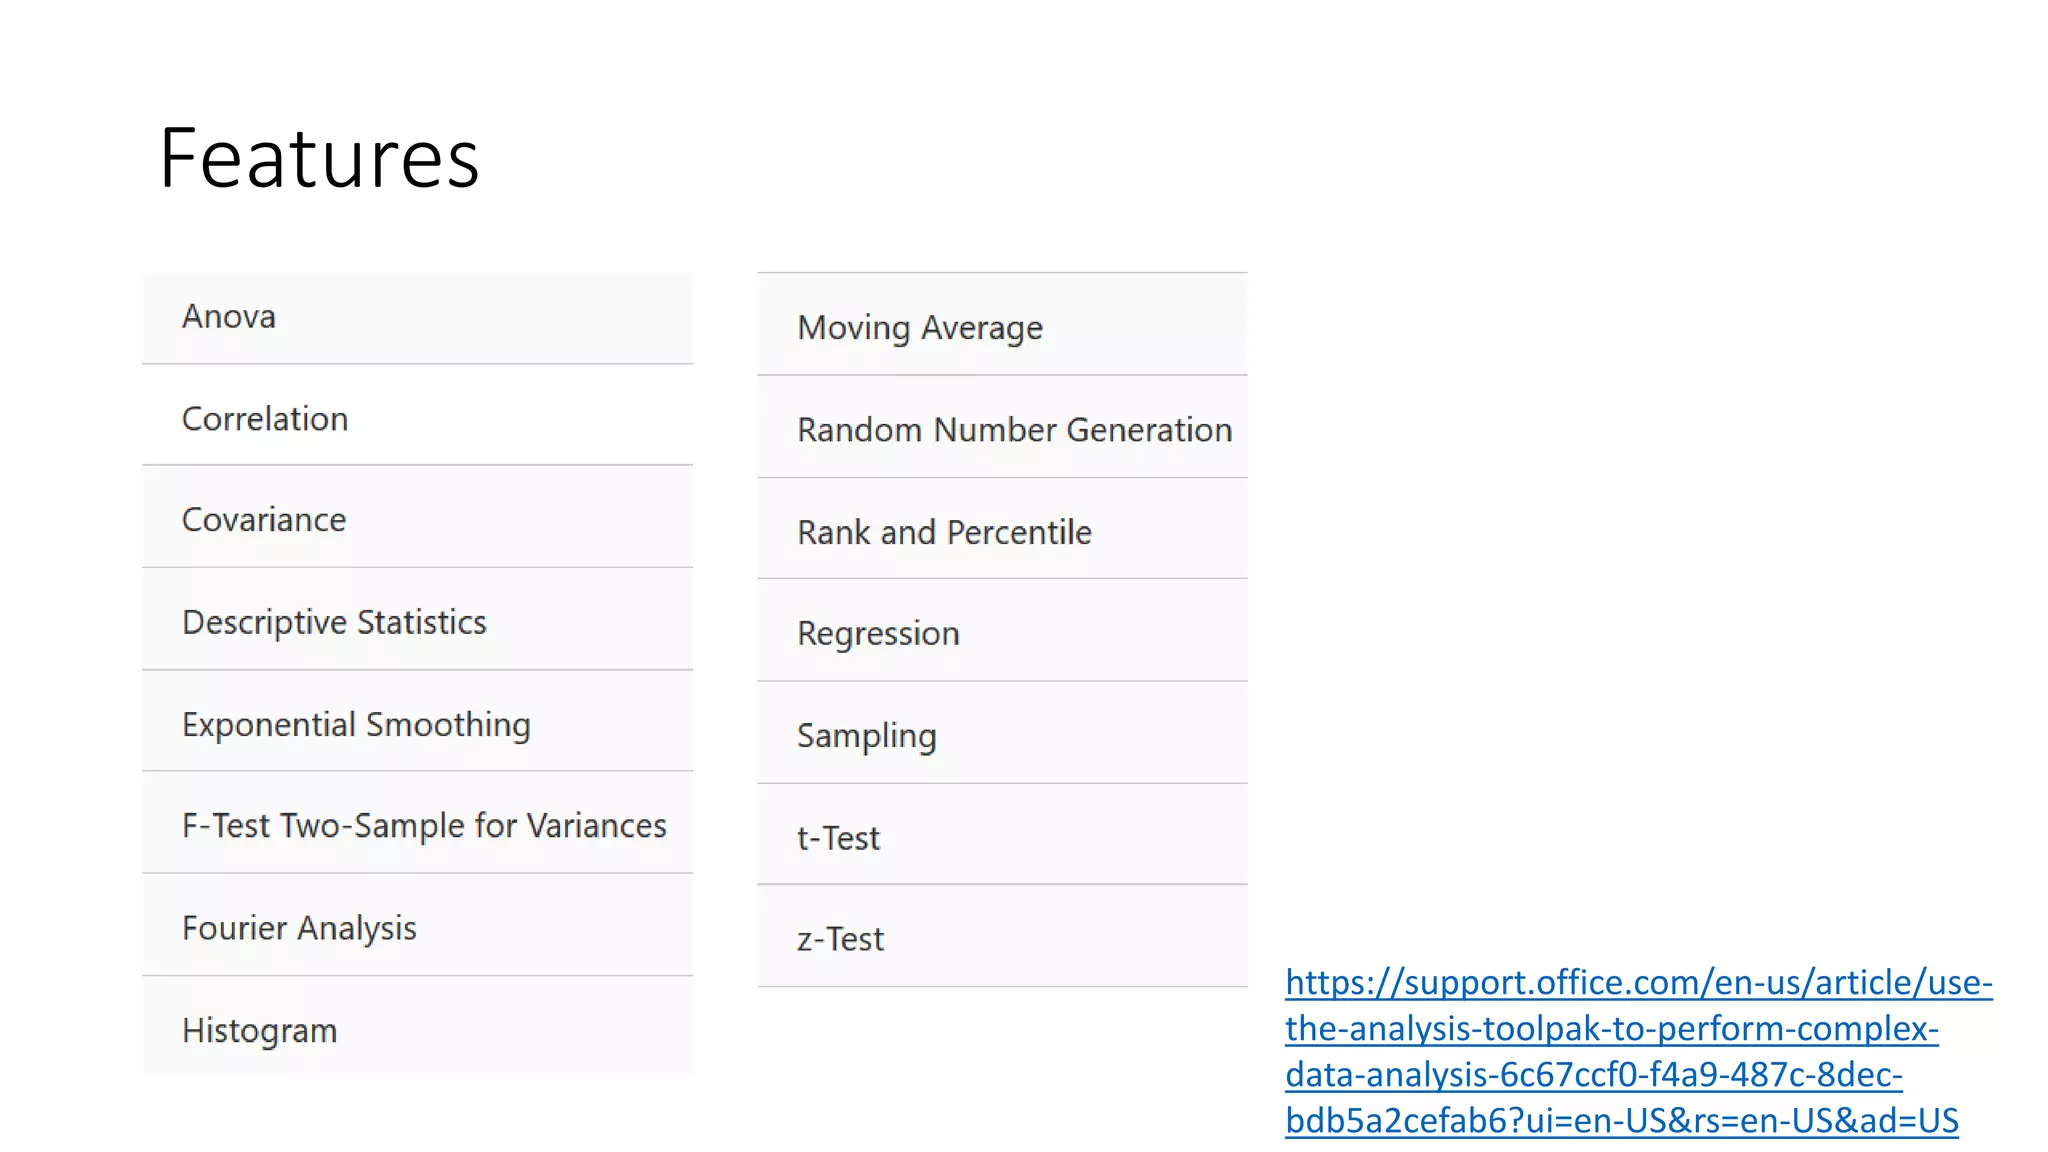

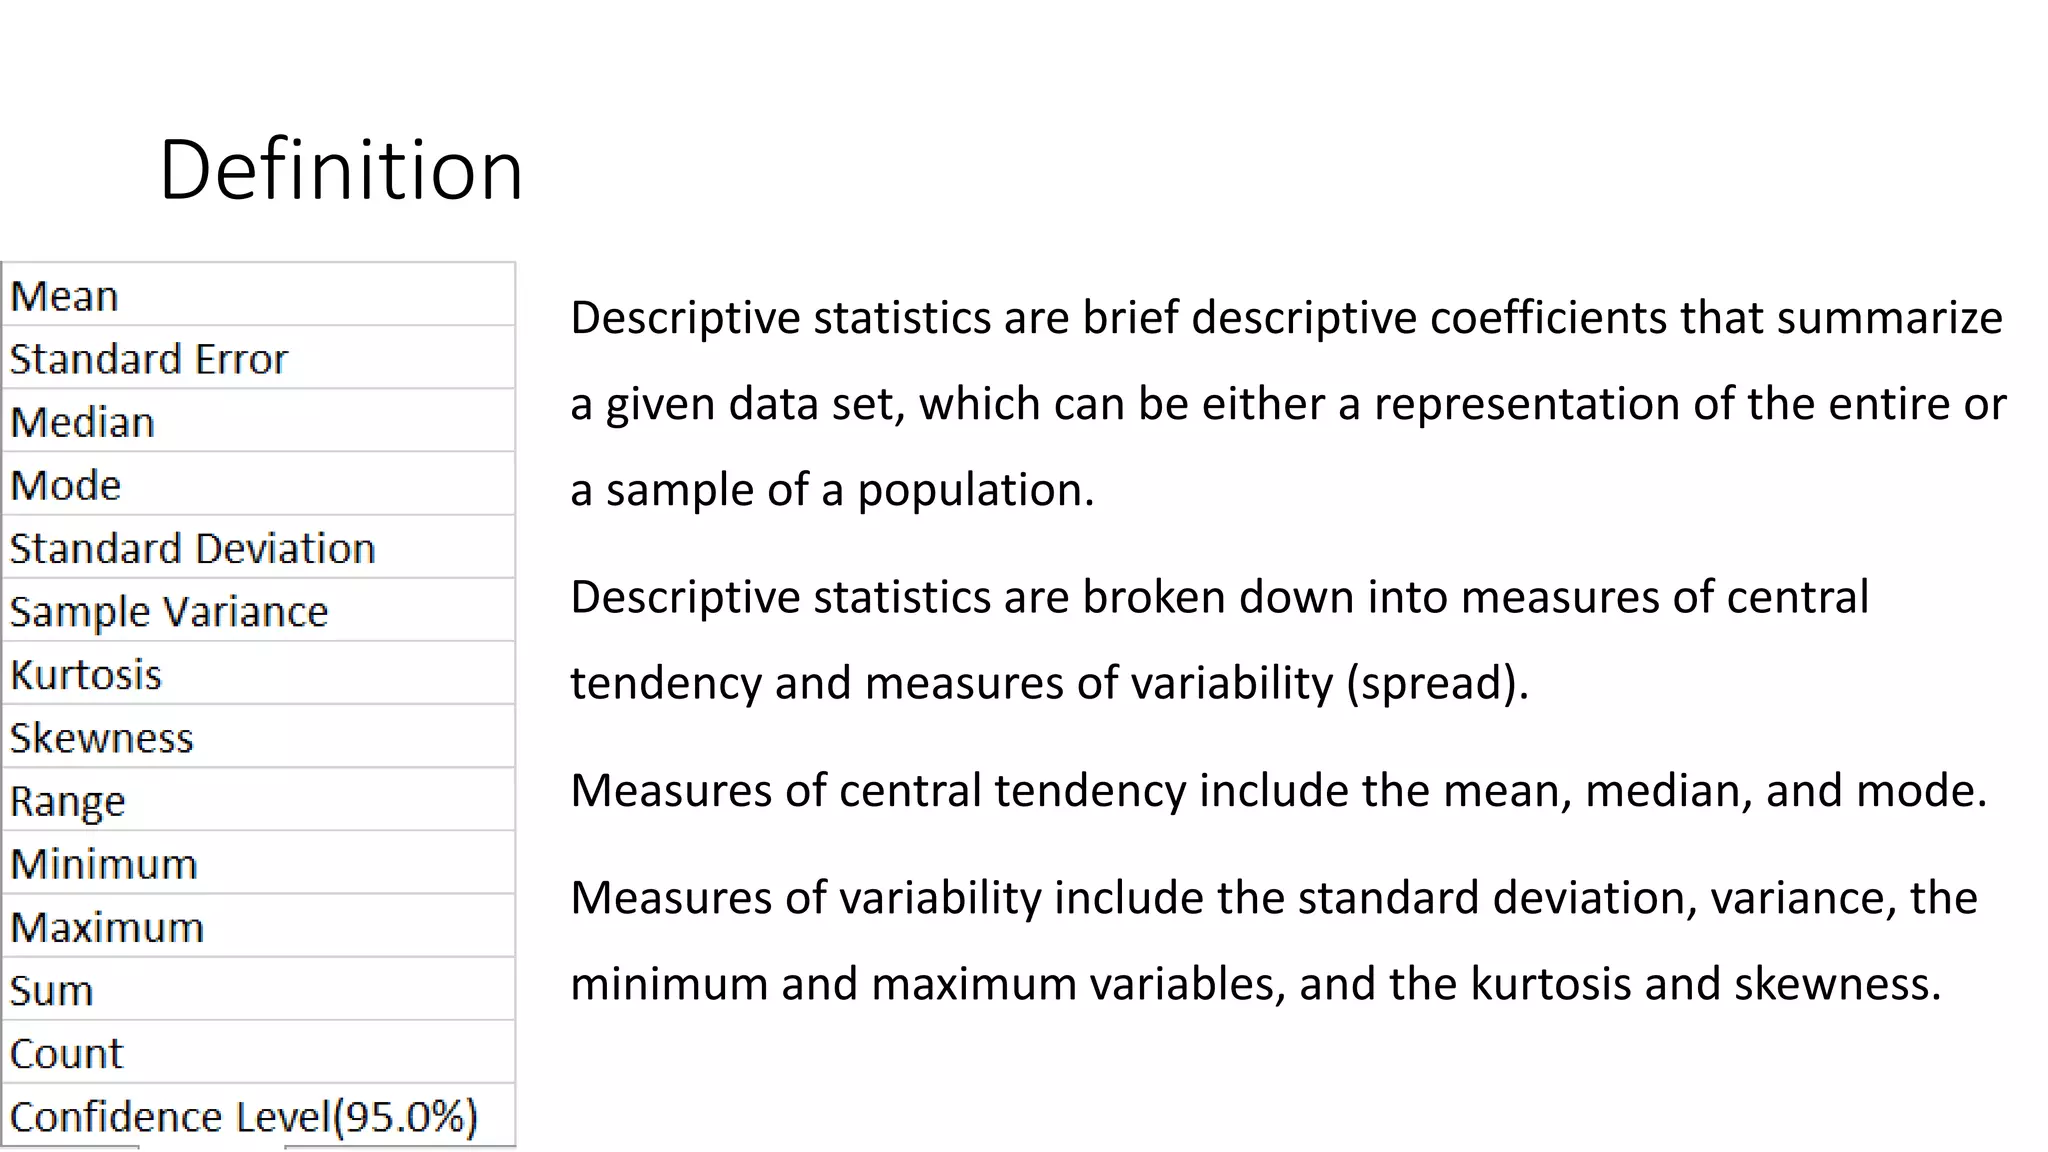
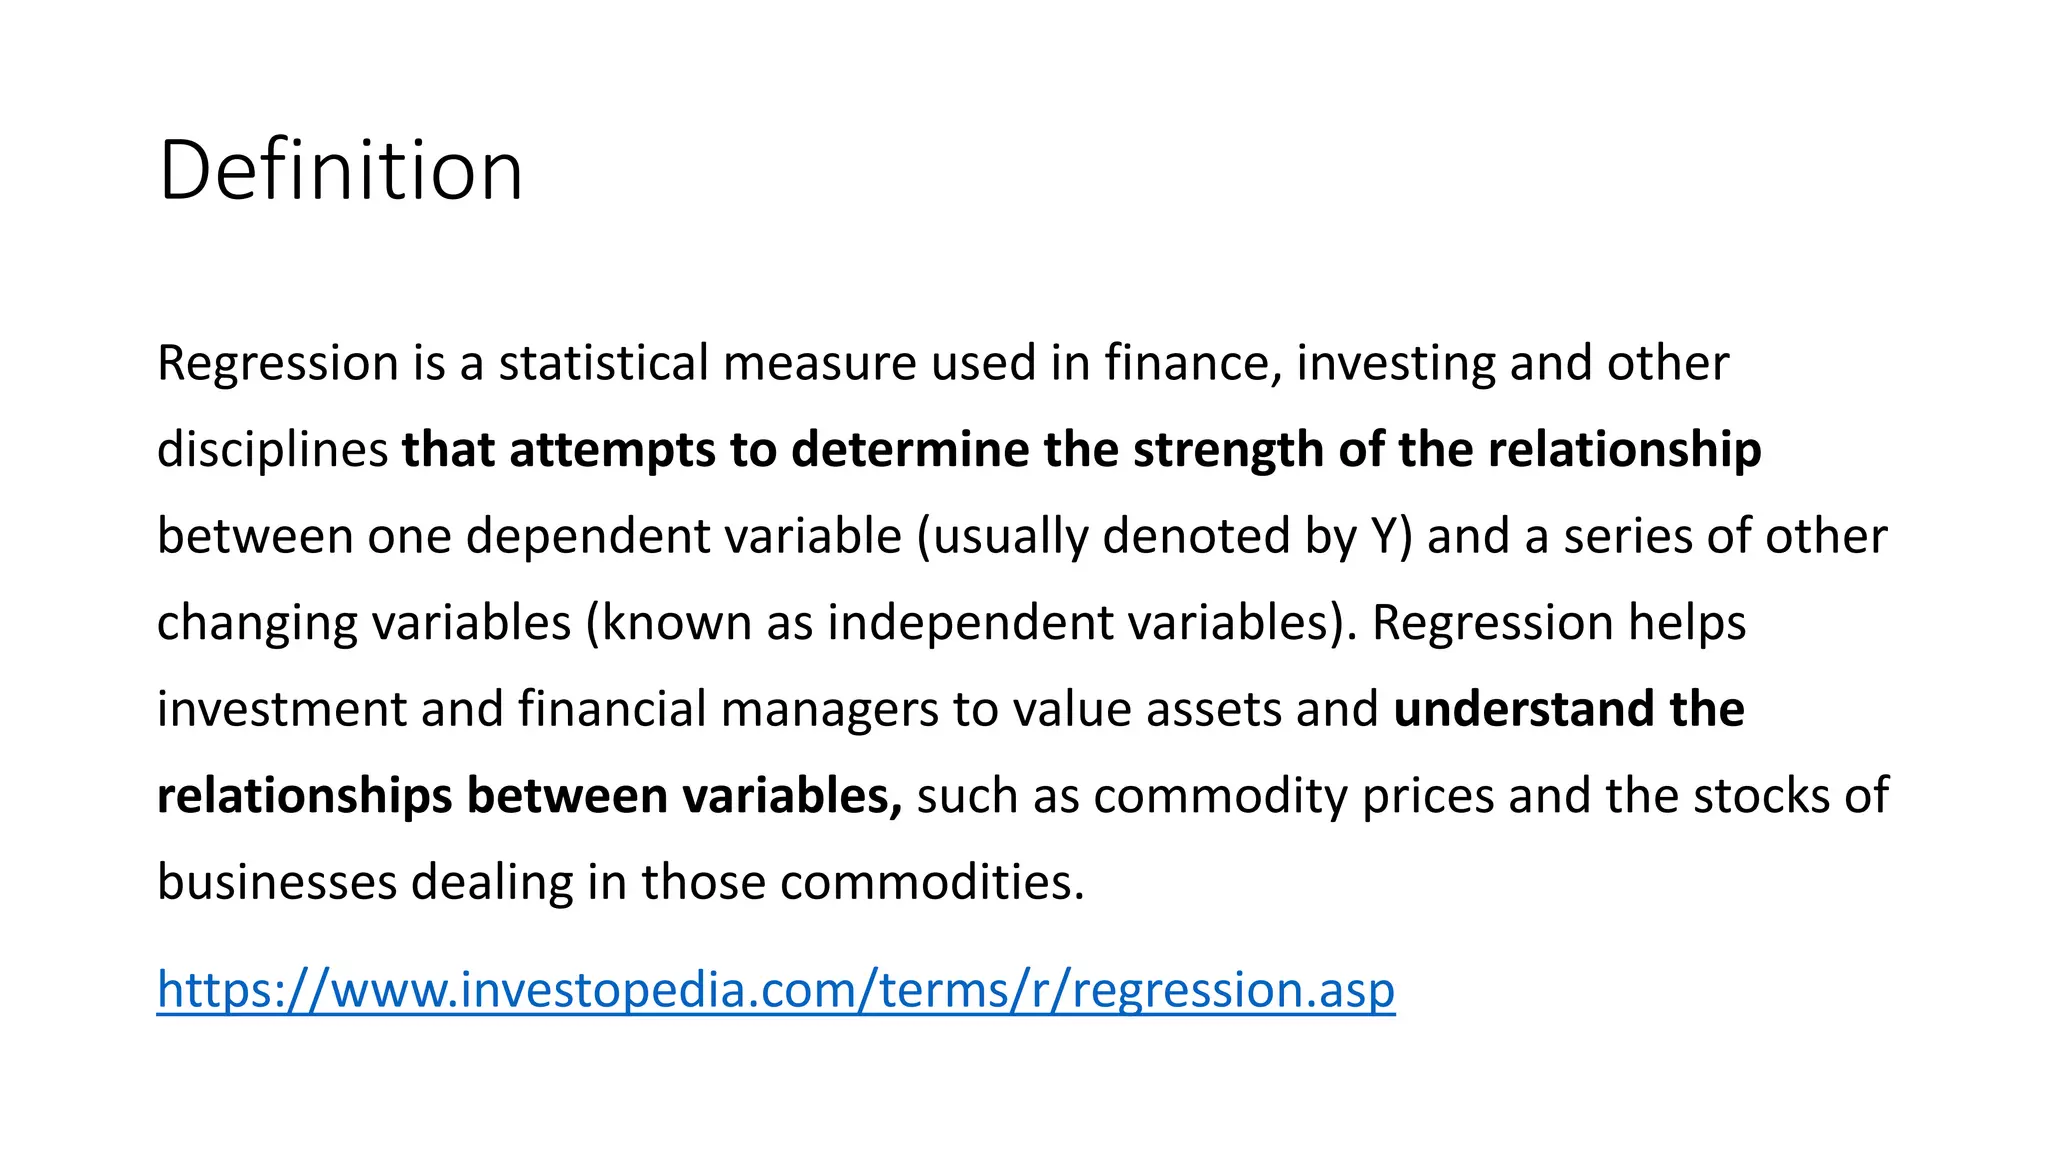
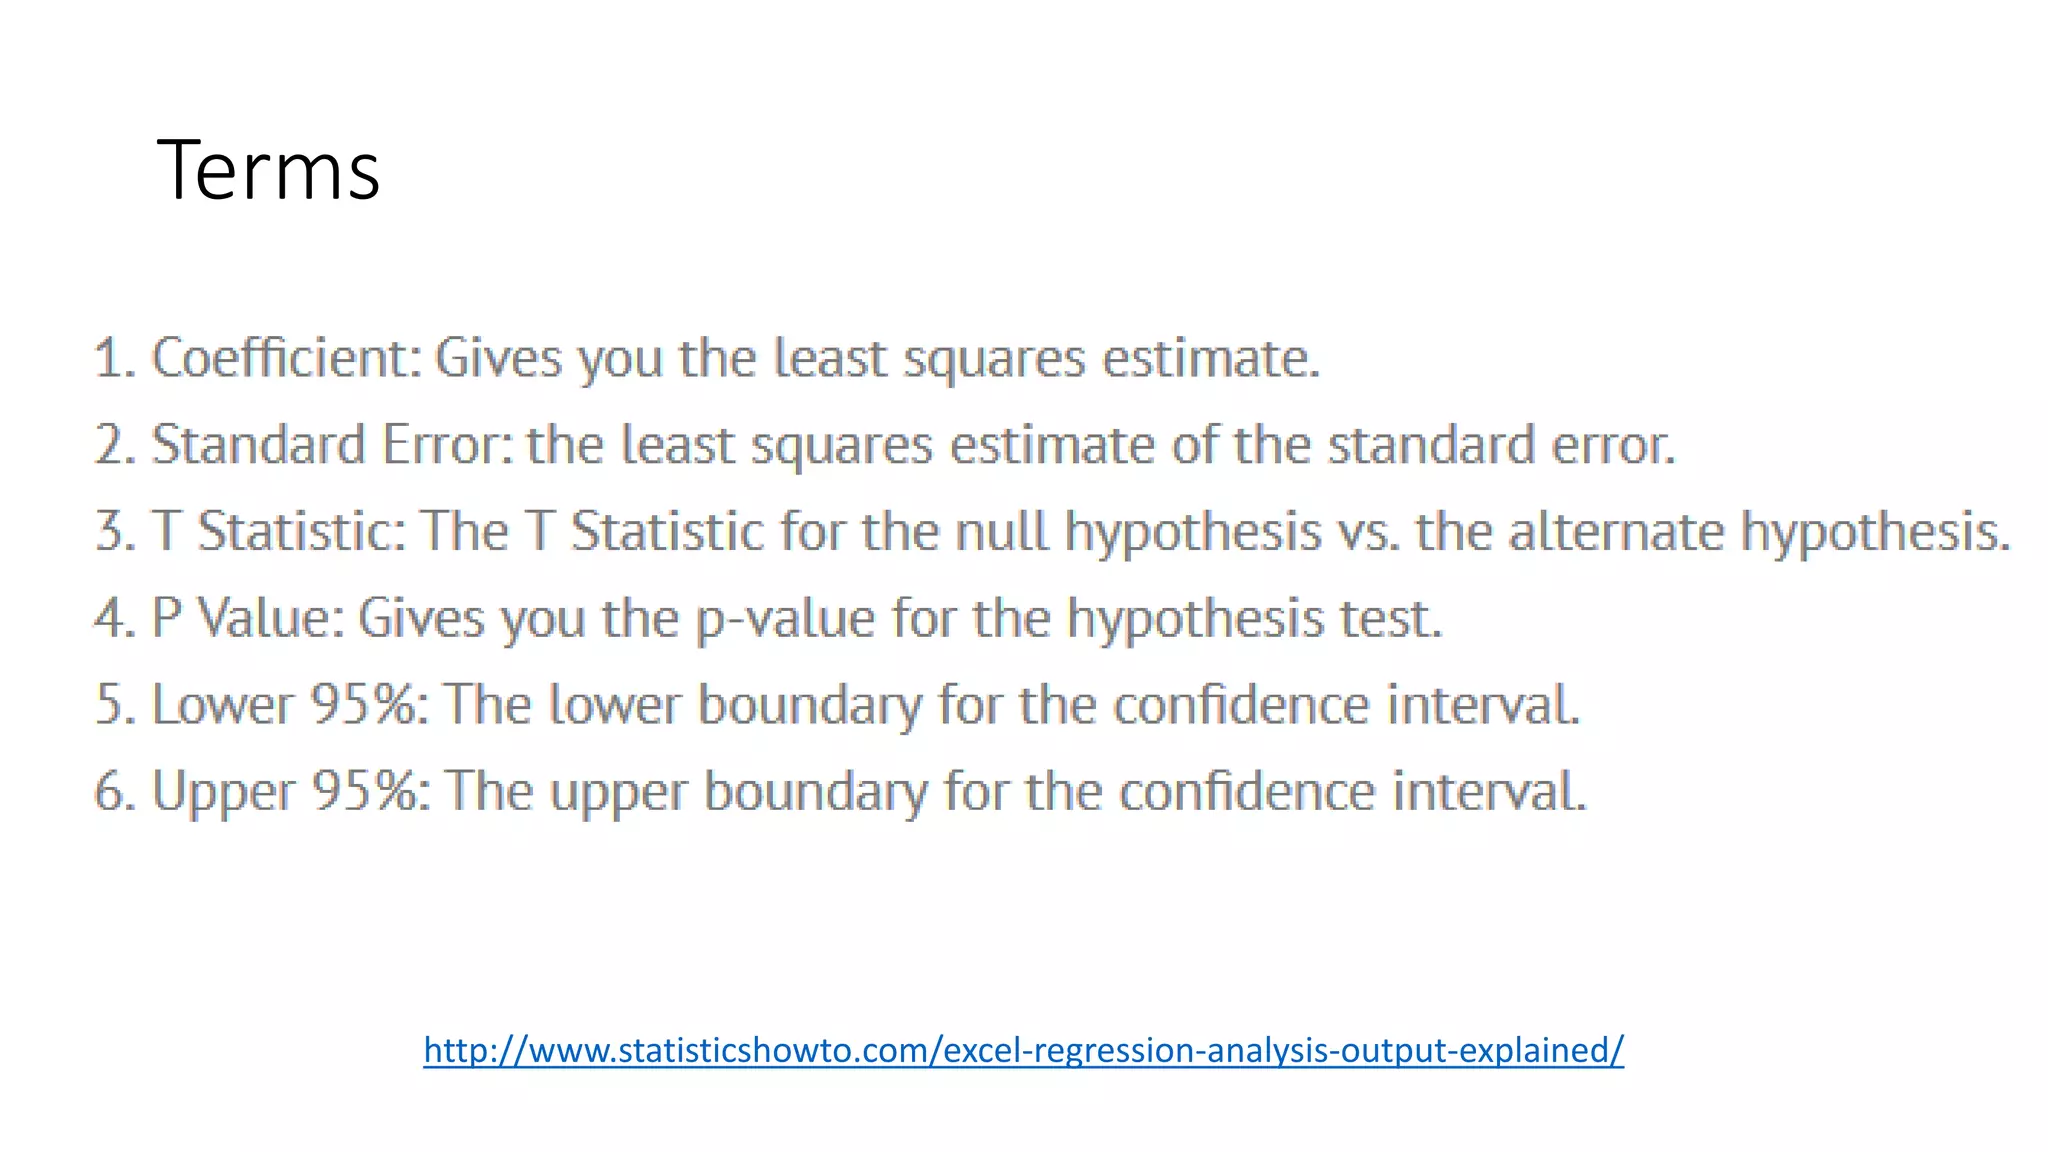
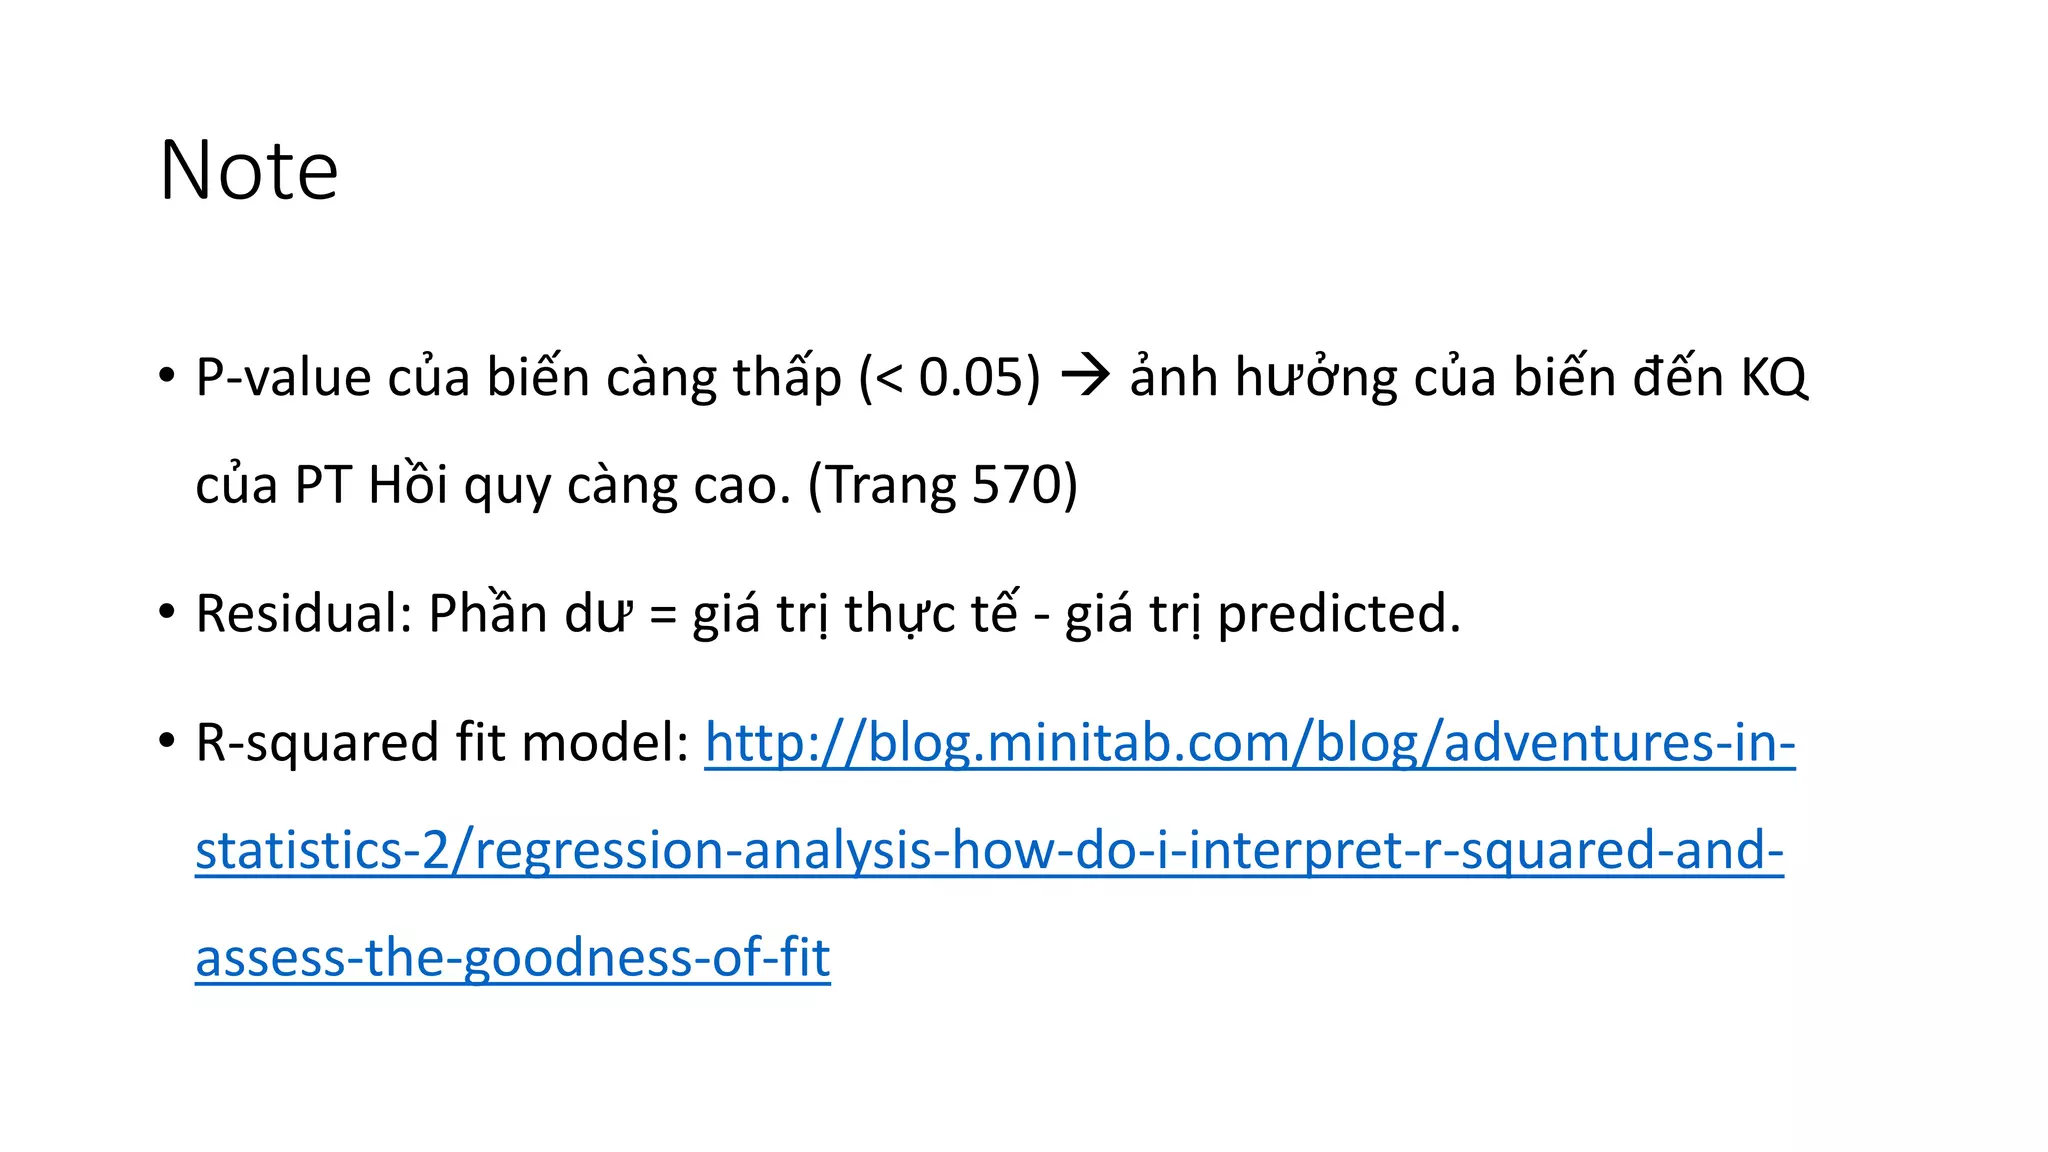


The document outlines a presentation on advanced Excel tools for data analysis, focusing on features such as the Analysis ToolPak, regression, and solver functionalities. It highlights the utility of the Analysis ToolPak for performing complex statistical analyses easily within Excel, offering free access and pre-installation. Additionally, the agenda includes insights into descriptive statistics, regression methods, and upcoming discussions on Power BI.


![[FTU Presentation][KTDN07] Brands](https://cdn.slidesharecdn.com/ss_thumbnails/brands-161027083823-thumbnail.jpg?width=640&height=640&fit=bounds)


![[LSC Training] Tech Training Session](https://cdn.slidesharecdn.com/ss_thumbnails/lsctechnologytraining-final-161027084913-thumbnail.jpg?width=640&height=640&fit=bounds)
![[MSPVN - Azure Workshop] Day 1 - Azure Web App with WordPress deployment](https://cdn.slidesharecdn.com/ss_thumbnails/azure-firstday-170618112120-thumbnail.jpg?width=640&height=640&fit=bounds)


![[Marketing Arena 2017][First Round] Team SHARP](https://cdn.slidesharecdn.com/ss_thumbnails/marketingarena2017sharpversion01-170519155346-thumbnail.jpg?width=640&height=640&fit=bounds)
![[MSPVN - Azure Workshop] Day 2 - Azure Web App and WooCommerce for Online Shop](https://cdn.slidesharecdn.com/ss_thumbnails/azure-secondday-170618112501-thumbnail.jpg?width=640&height=640&fit=bounds)


![[DSC Europe 25] Nikolay Burlutskiy - Best Practices for Building Enterprise M...](https://cdn.slidesharecdn.com/ss_thumbnails/uirvaiuvq8y1w8hzd9tx-7-251212103249-2619edb4-thumbnail.jpg?width=640&height=640&fit=bounds)
![[DSC Europe 25] Uros Pesic - The Reality of AI in Marketing.pdf](https://cdn.slidesharecdn.com/ss_thumbnails/rtkodnmtycovsllvzsyn-9-251215095918-b0c6bfe3-thumbnail.jpg?width=640&height=640&fit=bounds)
![[DSC Europe 25] Branko Urosevic -Rethinking Financial Talent: Integrating Cod...](https://cdn.slidesharecdn.com/ss_thumbnails/8jjrus8ttko6qj64f58f-3-251212103250-642c6374-thumbnail.jpg?width=640&height=640&fit=bounds)


![[DSC Europe 25] Jon Dajci - Bridging TradFi and DeFi: Building the Future of ...](https://cdn.slidesharecdn.com/ss_thumbnails/fqmhfvlbqhkihjvqvhmu-7-251211083849-6af7e325-thumbnail.jpg?width=640&height=640&fit=bounds)

![[DSC Europe 25] Hans Kleinsman - The Compliance Gearbox: How Tax Tech Mediate...](https://cdn.slidesharecdn.com/ss_thumbnails/dxdytie1toel0hr90bjs-2-251212103250-174fdbe7-thumbnail.jpg?width=640&height=640&fit=bounds)


![[DSC Europe 25] Branko Dzakula - From Defense to Attack: How AI Redefines Cyb...](https://cdn.slidesharecdn.com/ss_thumbnails/80bdzdxpr3ky2g0qvyk9-8-251211083048-ce5fc1ee-thumbnail.jpg?width=640&height=640&fit=bounds)
