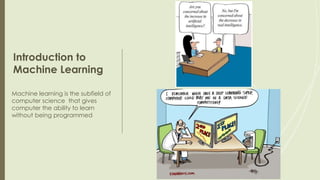
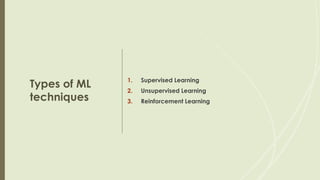
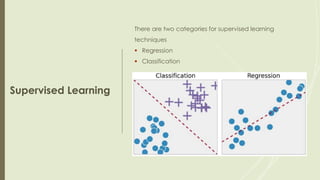
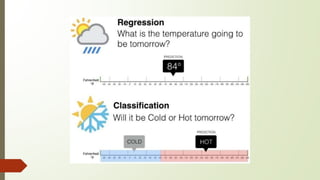
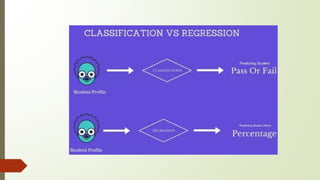
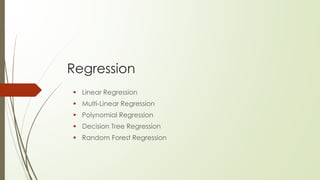
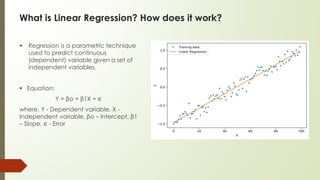
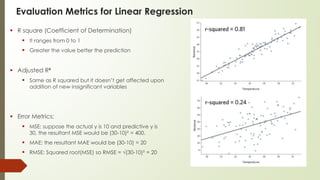
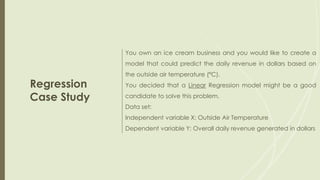
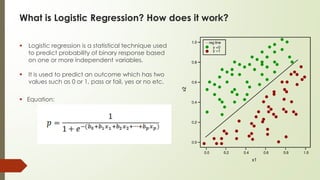
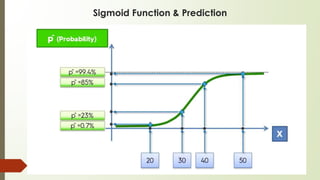
Supervised Machine
Learning
By Rahul Pal
Lead Data Scientist
Agenda
 Introduction to Machine Learning
 Introduction to Supervised Learning
 Classification vs Regression
 Introduction to Linear Regression
 Learning of Linear Regression
 Introduction to Logistic Regression
 Learning to Logistic Regression
 Case Studies
`
Introduction to
Machine Learning
Machine learning is the subfield of
computer science that gives
computer the ability to learn
without being programmed
Practical Examples
Types of ML
techniques
1. Supervised Learning
2. Unsupervised Learning
3. Reinforcement Learning
Supervised Learning
There are two categories for supervised learning
techniques
 Regression
 Classification
Regression
 Linear Regression
 Multi-Linear Regression
 Polynomial Regression
 Decision Tree Regression
 Random Forest Regression
Linear Regression
What is Linear Regression? How does it work?
 Regression is a parametric technique
used to predict continuous
(dependent) variable given a set of
independent variables.
 Equation:
Y = βo + β1X + ∈
where, Y - Dependent variable, X -
Independent variable, βo – Intercept, β1
– Slope, ∈ - Error
What are the
assumptions made
in Linear regression?
1. There exists a linear and additive relationship
between dependent (DV) and independent
variables (IV)
2. There must be no correlation among independent
variables (no multicollinearity
3. The error terms must possess constant variance (no
heteroskedasticity)
4. No autocorrelation
5. The dependent variable and the error terms
must possess a normal distribution.
How to check for those Assumptions?
Normal Q-Q plot
(to check Normal
distribution of errors)
Residual vs. Fitted Values
Plot
(for heteroskedasticity)
Other tests:
1. Durbin Watson Statistic (DW) - Autocorrelation
2. Variance Inflation Factor (VIF) – Multicollinearity
3. Breusch-Pagan/Cook Weisberg Test – Heteroskedasticity
Evaluation Metrics for Linear Regression
 R square (Coefficient of Determination)
 It ranges from 0 to 1
 Greater the value better the prediction
 Adjusted R²
 Same as R squared but it doesn’t get affected upon
addition of new insignificant variables
 Error Metrics:
 MSE: suppose the actual y is 10 and predictive y is
30, the resultant MSE would be (30-10)² = 400.
 MAE: the resultant MAE would be (30-10) = 20
 RMSE: Squared root(MSE) so RMSE = √(30-10)² = 20
Regression
Case Study
You own an ice cream business and you would like to create a
model that could predict the daily revenue in dollars based on
the outside air temperature (°C).
You decided that a Linear Regression model might be a good
candidate to solve this problem.
Data set:
Independent variable X: Outside Air Temperature
Dependent variable Y: Overall daily revenue generated in dollars
Logistic Regression
What is Logistic Regression? How does it work?
 Logistic regression is a statistical technique used
to predict probability of binary response based
on one or more independent variables.
 It is used to predict an outcome which has two
values such as 0 or 1, pass or fail, yes or no etc.
 Equation:
Sigmoid Function & Prediction
Evaluation Metrics for Logistic Regression
 Confusion Matrix (in fig): It can also be used to
derive
 Accuracy : (TP+TN) / (TP+TN+TF+FP)
 Precision : (TP) / (TP+FP)
 Recall : (TP) / (TP+FN)
 F-1 Score : 2*(Precision*Recall) / (Precision+Recall)
 Other metrics:
 Receiver Operator Characteristic (ROC)
 Akaike Information Criteria (AIC)
Classification
Case Study
You own a advertisement agency. You have customer data who
watches your ads and clicks on it or not. On the basis of this data
you want to try enhancing your customer targeting.
You wanted to categorize your customers into those who will
click on ad vs those who won’t. So we will build a logistic model
to achieve this goal and maximize our click conversion rate.
Data set:
Independent variable X: Customer Related Data
Dependent variable Y: Clicked on Ad
“
”
Thank You.
Feel free to contact for any queries
Rahul Pal
the.rahul.pal@gmail.com

Supervised learning - Linear and Logistic Regression( AI, ML)

  • 1.
    Supervised Machine Learning By RahulPal Lead Data Scientist
  • 2.
    Agenda  Introduction toMachine Learning  Introduction to Supervised Learning  Classification vs Regression  Introduction to Linear Regression  Learning of Linear Regression  Introduction to Logistic Regression  Learning to Logistic Regression  Case Studies
  • 3.
    ` Introduction to Machine Learning Machinelearning is the subfield of computer science that gives computer the ability to learn without being programmed
  • 4.
  • 5.
    Types of ML techniques 1.Supervised Learning 2. Unsupervised Learning 3. Reinforcement Learning
  • 6.
    Supervised Learning There aretwo categories for supervised learning techniques  Regression  Classification
  • 9.
    Regression  Linear Regression Multi-Linear Regression  Polynomial Regression  Decision Tree Regression  Random Forest Regression
  • 10.
  • 11.
    What is LinearRegression? How does it work?  Regression is a parametric technique used to predict continuous (dependent) variable given a set of independent variables.  Equation: Y = βo + β1X + ∈ where, Y - Dependent variable, X - Independent variable, βo – Intercept, β1 – Slope, ∈ - Error
  • 12.
    What are the assumptionsmade in Linear regression? 1. There exists a linear and additive relationship between dependent (DV) and independent variables (IV) 2. There must be no correlation among independent variables (no multicollinearity 3. The error terms must possess constant variance (no heteroskedasticity) 4. No autocorrelation 5. The dependent variable and the error terms must possess a normal distribution.
  • 13.
    How to checkfor those Assumptions? Normal Q-Q plot (to check Normal distribution of errors) Residual vs. Fitted Values Plot (for heteroskedasticity)
  • 14.
    Other tests: 1. DurbinWatson Statistic (DW) - Autocorrelation 2. Variance Inflation Factor (VIF) – Multicollinearity 3. Breusch-Pagan/Cook Weisberg Test – Heteroskedasticity
  • 15.
    Evaluation Metrics forLinear Regression  R square (Coefficient of Determination)  It ranges from 0 to 1  Greater the value better the prediction  Adjusted R²  Same as R squared but it doesn’t get affected upon addition of new insignificant variables  Error Metrics:  MSE: suppose the actual y is 10 and predictive y is 30, the resultant MSE would be (30-10)² = 400.  MAE: the resultant MAE would be (30-10) = 20  RMSE: Squared root(MSE) so RMSE = √(30-10)² = 20
  • 16.
    Regression Case Study You ownan ice cream business and you would like to create a model that could predict the daily revenue in dollars based on the outside air temperature (°C). You decided that a Linear Regression model might be a good candidate to solve this problem. Data set: Independent variable X: Outside Air Temperature Dependent variable Y: Overall daily revenue generated in dollars
  • 17.
  • 18.
    What is LogisticRegression? How does it work?  Logistic regression is a statistical technique used to predict probability of binary response based on one or more independent variables.  It is used to predict an outcome which has two values such as 0 or 1, pass or fail, yes or no etc.  Equation:
  • 19.
  • 20.
    Evaluation Metrics forLogistic Regression  Confusion Matrix (in fig): It can also be used to derive  Accuracy : (TP+TN) / (TP+TN+TF+FP)  Precision : (TP) / (TP+FP)  Recall : (TP) / (TP+FN)  F-1 Score : 2*(Precision*Recall) / (Precision+Recall)  Other metrics:  Receiver Operator Characteristic (ROC)  Akaike Information Criteria (AIC)
  • 21.
    Classification Case Study You owna advertisement agency. You have customer data who watches your ads and clicks on it or not. On the basis of this data you want to try enhancing your customer targeting. You wanted to categorize your customers into those who will click on ad vs those who won’t. So we will build a logistic model to achieve this goal and maximize our click conversion rate. Data set: Independent variable X: Customer Related Data Dependent variable Y: Clicked on Ad
  • 22.
    “ ” Thank You. Feel freeto contact for any queries Rahul Pal the.rahul.pal@gmail.com