![Cedric F. Lam ( [email_address] ) and Winston I. Way ( [email_address] ) SPIE Photonics West, Jan 29, 2009, San Jose, CA A System’s View of Metro and Regional Optical Networks](https://image.slidesharecdn.com/72352LamWay-123398959369-phpapp01/85/A-System-s-View-of-Metro-and-Regional-Optical-Networks-1-320.jpg)
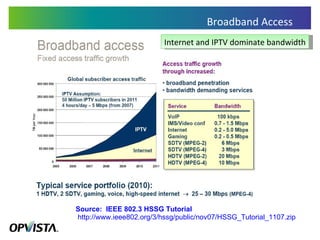
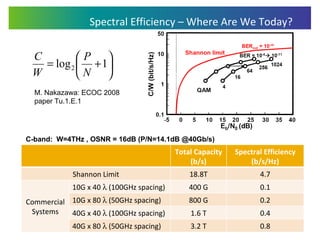
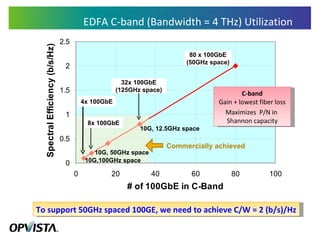
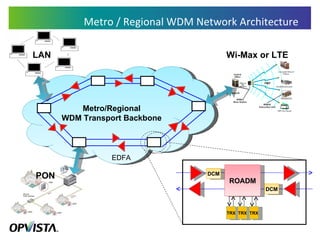
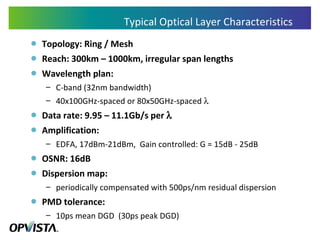
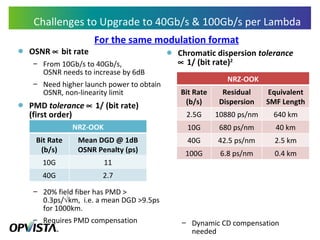
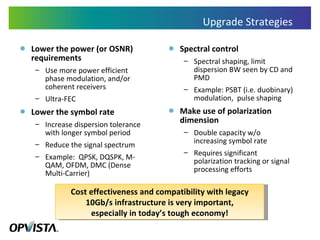
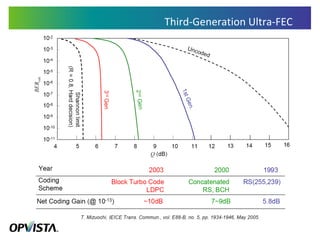
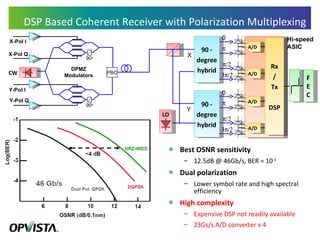
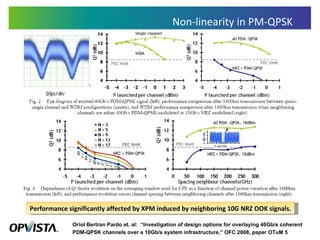
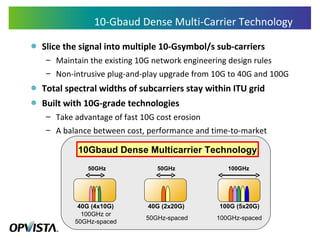
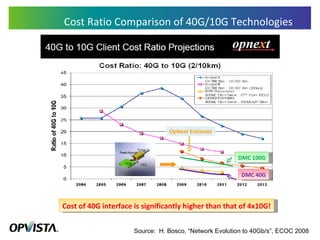
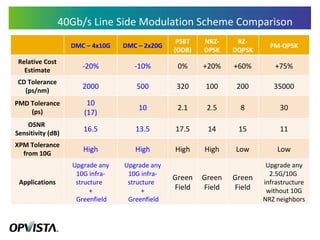
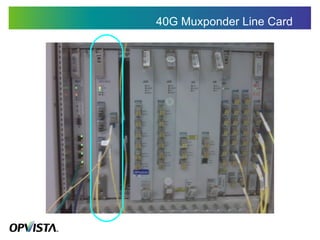
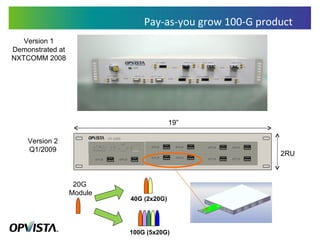
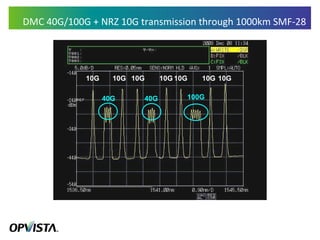
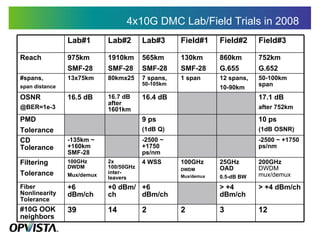
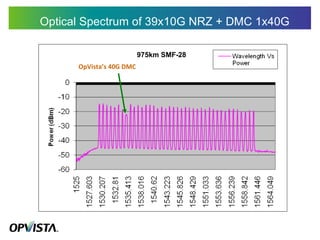
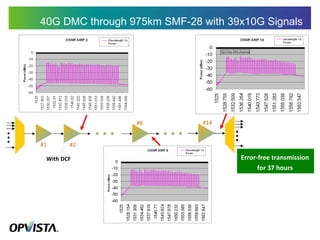
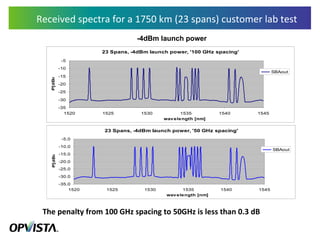
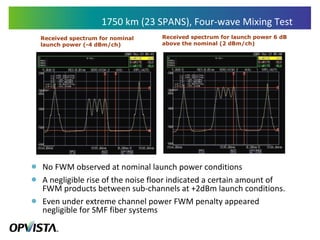
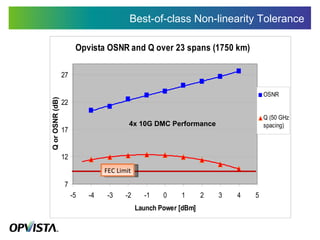
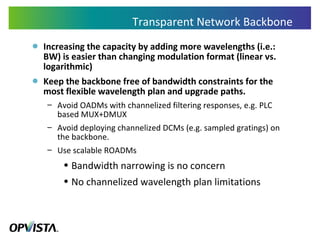
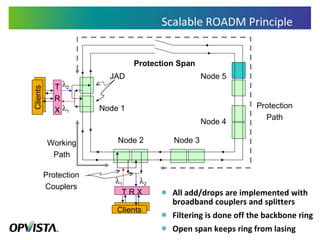
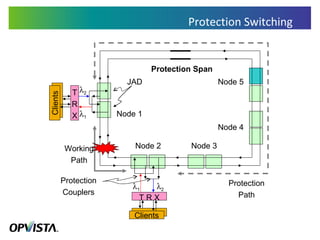
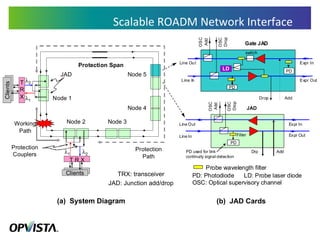
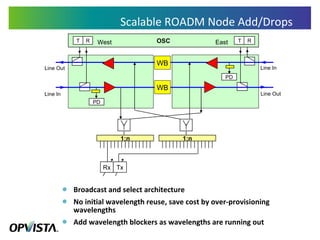
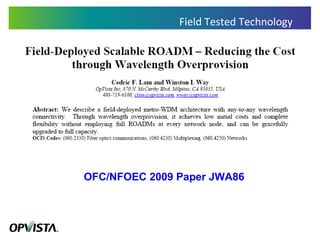
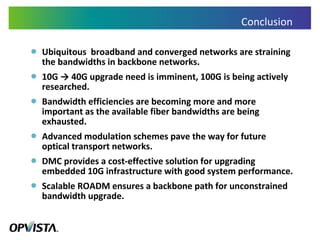

The document discusses optical network technologies for upgrading to higher data rates. It introduces dense multi-carrier (DMC) technology as a cost-effective solution to upgrade existing 10Gb/s networks to 40Gb/s and 100Gb/s. DMC works by slicing signals into multiple lower symbol rate sub-carriers. It also discusses scalable reconfigurable optical add-drop multiplexer (ROADM) architectures to provide a flexible backbone without bandwidth constraints. Field trials showed DMC successfully transmitting 40Gb/s and 100Gb/s over long distances with high tolerance to nonlinearities and impairments.


![Multiband Transceivers - [Chapter 3] Basic Concept of Comm. Systems](https://cdn.slidesharecdn.com/ss_thumbnails/ch3-150613070933-lva1-app6892-thumbnail.jpg?width=640&height=640&fit=bounds)


![DWDM & Packet Optical Fundamentals by Dion Leung [APRICOT 2015]](https://cdn.slidesharecdn.com/ss_thumbnails/dwdmpackettutorialapricot20151425453497-150304173624-conversion-gate01-thumbnail.jpg?width=640&height=640&fit=bounds)


