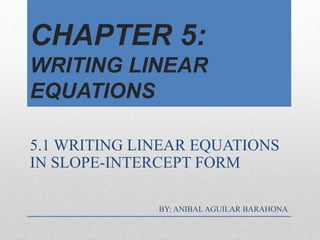
5.1 writing linear equations in slope intercept form
•Download as PPTX, PDF•
2 likes•1,210 views
You can use this presentation to introduce students in how to write linear equations given the slope and the y-intercept. This is the first case in writing linear equations.
Report
Share
Report
Share

Recommended
Parallel and perpendicular_lines 1.1
This document discusses finding the equations of parallel and perpendicular lines. It explains that two lines are parallel if they have equal slopes, and perpendicular if the product of their slopes is -1. It provides examples of writing the equation of a line parallel or perpendicular to a given line, passing through a specified point. The document also includes exercises for writing equations of parallel and perpendicular lines based on given information.
Data handling class 8th
This video from SK Knowledge Point discusses different types of diagrams used to represent numerical data, including pictographs, bar graphs, double bar graphs, pie charts, and histograms. It explains that pictographs use symbols to represent data values, while bar graphs and histograms use bars to show frequencies. Pie charts represent parts of a whole through proportional sectors of a circle. Various examples are provided of each type of diagram. The video encourages viewers to like, share and subscribe to the channel for more math content.
Data handling
This document provides an introduction to data handling and various graphs and charts used to represent data. It defines key terms like arithmetic mean, range, mode, and median that are used to describe data sets. It also describes common graph types like bar graphs, pie charts, and line graphs; and provides examples of how each graph organizes and visualizes different types of data.
Data handling
This document provides an introduction to data handling and various terms related to organizing and presenting numerical data. It defines arithmetic mean as the average value calculated by summing all observations and dividing by the number of observations. Range is defined as the difference between the highest and lowest values. Mode refers to the value that occurs most frequently in a data set. Median means the middle number of a sorted list of values. The document also describes common graphs for visualizing data, including bar graphs, pie charts, and line graphs.
Isomorphic graph
The document discusses various graph theory topics including isomorphism, cut sets, labeled graphs, and Hamiltonian circuits. It defines isomorphism as two graphs being structurally identical with a one-to-one correspondence between their vertices and edges. Cut sets are edges whose removal would disconnect a connected graph. Labeled graphs assign labels or weights to their vertices and/or edges. A Hamiltonian circuit is a closed walk that visits each vertex exactly once.
What is Line Graph
this presentation is about line graph. in this presentation we will study about the line graph, its parts and its different types.
Line graphs, slope, and interpreting line graphs
The document discusses how to draw and interpret line graphs from data. It provides instructions on properly labeling the axes, plotting data points, and drawing a best-fit line through the points. It also defines slope as the constant in the linear equation y=kx and explains how to calculate slope using the rise over run formula.
Presentation of Data
Present the data using various diagram and graphs
Simple Bar Diagram, Multiple Bar Diagram, Compound/ Subdivided Bar Diagram, Proportional Bar Diagram,Pie-chart
Pictogram,Line Diagram, Population Pyramid.
Graph Theory: Matrix representation of graphs
The document discusses different matrix representations of graphs:
1) Incidence matrices represent the relationship between vertices and edges, with each column having two 1s. Circuit matrices represent circuits, with each row as a circuit vector. Cut-set matrices represent edge sets whose removal disconnects the graph.
2) Path matrices represent paths between vertex pairs, with columns of all 0s/1s indicating edges not/in every path. Adjacency matrices directly encode vertex connectivity.
3) Exercises are provided to construct the incidence matrix, circuit matrix, fundamental circuit matrix, and cut-set matrix for a given graph.
Bar Graphs And Histograms
This document provides information about different types of graphs including bar graphs, double bar graphs, and histograms. It explains that bar graphs can display and compare data, double bar graphs can compare two related data sets, and histograms show the frequency of data values within intervals using touching bars of equal width. Steps are provided for constructing each type of graph using example data sets.
5.5 writing linear equations
1) Parallel lines have the same slope. Perpendicular lines have slopes that are negative reciprocals of each other.
2) To determine if two lines are parallel or perpendicular, you calculate their slopes. If the slopes are equal, the lines are parallel. If the slopes are negative reciprocals, the lines are perpendicular.
3) To find the equation of a line parallel or perpendicular to a given line, you use the slope of the given line and the point-slope formula. For a parallel line, you use the same slope. For a perpendicular line, you use the negative reciprocal slope.
NCV 4 Mathematical Literacy Hands-On Support Slide Show - Module 2 Part 3
This slide show complements the learner guide NCV 4 Mathematical Literacy Hands-On Training by San Viljoen, published by Future Managers Pty Ltd. For more information visit our website www.futuremanagers.net
K map
K map or karnaugh's map is a very important topic when studying boolean algebra.
Here is my powerpoint presentation to explain it in the easiest manner.Also I have added a question for your understanding.For the solution please write me up in the comment box.
Data handling
This document discusses different types of graphs used to represent data. It outlines eight main types of graphs: bar graphs, pie charts, tally charts, area graphs, pictographs, waterfall graphs, line graphs, and polar graphs. Each graph type is briefly described, including details about bar graphs having two axes (X and Y), pie charts showing proportional sectors, and waterfall charts representing cumulative positive or negative values. Pictographs use pictures to represent data, while line graphs connect data points with straight lines. The document provides a high-level overview of common graph types used for data visualization.
Wireframe models
Wireframe models represent 3D objects using geometric primitives like points, lines, and polygons. They connect vertices with edges to form polygonal nets or meshes. There are three common representations: explicit vertex lists that store each vertex coordinate; polygon listings that define polygons through vertex indices; and explicit edge listings that store each unique edge and define polygons through edge indices. Wireframe models are easy to create but cannot represent curved surfaces or differentiate interior/exterior.
Implicit Interpolation Analytical Curves
Here in this presentation we will be getting to know about Implicit Interpolation Analytical Curves related to Manufacturing and Designing, Design criteria, we'll be going through interpolating Curves and Equations, interpolating Matrices and Blending Functions
Lesson 1-1: Basic Geometric Figures
This document defines and explains basic geometric figures including points, lines, line segments, rays, planes, and angles. It provides descriptions of each figure and conventions for naming them properly. Examples are given to illustrate the definitions and naming. The document serves as an introduction to the fundamental concepts and terminology of geometry.
Directions & planes
The document discusses directions and planes in a cubic unit cell. It provides three key points:
1) Directions and planes are used to identify the orientation of atoms, which influences properties like slip, failure modes, conductivity, and more.
2) Miller indices provide a simple notation for representing planes and directions using intercepts with the x, y, and z axes of the unit cell.
3) Specific procedures are outlined for determining the Miller indices that represent a plane or direction using points of intersection with the unit cell axes.
How to Create Bar and Line Graphs
The document provides instructions for creating bar and line graphs, including how to label the axes, choose an appropriate scale and interval, and add a title. It explains that the dependent variable goes on the y-axis and independent variable on the x-axis. Bar graphs are used to compare categorical data, while line graphs show relationships between variables and trends over time. Examples of properly formatted bar and line graphs are also included.
Graph ppt
This document provides information about different types of graphs. It defines what a graph is as a two-dimensional drawing that shows the relationship between two sets of numbers using a line, curve, bars, or other symbols. It then describes several common types of graphs: circle graphs that display data in circular sections; bar graphs that use vertical or horizontal bars of equal width; pictographs that use pictures and symbols with a key; broken line graphs that join data points over time with line segments; continuous line graphs where points on the line also have meaning; and scatter plots that show a set of plotted points.
DIAGRAMMATIC PRESENTATION OF DATA
This document discusses diagrammatic presentations of data, which use geometric techniques like bar diagrams, pie charts, and cartograms to visually present numerical information. The main advantages of these diagrams are that they are attractive, easy to remember and understand, simplify complex data, and help make comparisons. There are one-dimensional, two-dimensional, and three-dimensional diagrams. Examples provided include line graphs, bar graphs, sub-divided bar graphs, rectangular diagrams, and pie charts. Pie charts in particular can be used to show percentages and proportional relationships between parts of a whole.
Qt graphical representation of data
The document discusses various types of graphic representations of data including graphs, diagrams, and charts. It describes graphs as a pictorial presentation of data using lines, bars, and dots. It explains the meaning and significance of graphs, compares tabular and graphic representations, and outlines general rules for constructing graphs. The document also discusses one variable graphs, two variable graphs, time series graphs, and different types of charts including histograms, frequency polygons, box plots, Pareto charts, fishbone diagrams, and more. It covers the merits, demerits, and limitations of using graphs.
Geometric model & curve
This document discusses geometric modeling and curves. It provides information on:
- Geometric modeling is the process of creating mathematical models of physical objects and systems using computer software.
- There are different types of geometric models including wireframe, surface, and solid modeling.
- Curves can be represented mathematically in both implicit and parametric forms, with parametric being most common in modeling as it overcomes limitations of other forms.
- Parametric curves define a curve using a parameter, where varying the parameter provides points on the curve. Common parametric representations include lines, conics, and higher-order curves composed of simpler curve segments.
Alg2 lesson 2.3
1) The slope of a line passing through (-3,5) and (2,1) can be determined using the slope formula: m=(Δy/Δx) which is (1-5)/(-3-2)=-4/5.
2) Lines can be classified by their slope as having a positive, zero, negative, or undefined slope.
3) A line parallel to the graph of 4x-2y=10 that passes through (2,1) has a slope of 2.
Controlled assessment - Data Presentation
This document provides guidance for students presenting data on changes in river channel characteristics from the upper to lower course. It outlines hypotheses about how channel size, efficiency, and gradient will change downstream and lists essential graphs to include, such as cross-sectional area, efficiency, and gradient over 12 sites. Students are instructed to draw cross-sections to scale for their 4 sites and include photos and text to make the cross-sections more sophisticated. Examples of student cross-sections are shown. The document also provides examples of bar, line, and scatter graphs to present trends in cross-sectional area, efficiency, velocity, and gradient downstream.
5 1c Graphing lines from a point and slope
Given a point and slope, this document provides instructions for graphing the line through that point with the given slope. It explains that you should plot the point, determine if the slope is positive, negative, zero, or undefined, then use the slope to move up/down and over from the point to draw the line. It also notes that if the slope is a whole number, it should be converted to a ratio, and provides examples of graphing lines from different points with various slopes.
Introduction to graph
A graph is a visual representation of data using points connected by lines or bars. It can show relationships between different types of data. Common types of graphs include bar graphs, pie charts, histograms, and line graphs. Bar graphs compare categories using vertical or horizontal bars of different heights or lengths. Pie charts show proportions using a circle divided into wedge-shaped slices. Histograms display frequency distributions using rectangular bars of varying heights. Line graphs track changes over time by connecting data points with lines. Rene Descartes introduced the Cartesian coordinate system to precisely locate points on a graph using their x and y coordinates.
7 2
This document discusses writing linear equations in point-slope form. It explains that a linear equation describes all points that lie on a line and can be determined by plugging coordinates into the equation. It also notes that the equation of a line can be written if the slope and coordinates of one point are known. Finally, it provides the point-slope form equation of y - y1 = m(x - x1) and assigns examples and problems for students to complete.
M1 l3
This document discusses writing equations of lines. It explains that a linear equation can be written in the form of y=mx+b, where m is the slope and b is the y-intercept. It provides examples of writing the equation of a line when given a slope and point, and when given two points, by finding the slope and using one of the points to solve for b and write the full equation in y=mx+b form.
More Related Content
What's hot
Graph Theory: Matrix representation of graphs
The document discusses different matrix representations of graphs:
1) Incidence matrices represent the relationship between vertices and edges, with each column having two 1s. Circuit matrices represent circuits, with each row as a circuit vector. Cut-set matrices represent edge sets whose removal disconnects the graph.
2) Path matrices represent paths between vertex pairs, with columns of all 0s/1s indicating edges not/in every path. Adjacency matrices directly encode vertex connectivity.
3) Exercises are provided to construct the incidence matrix, circuit matrix, fundamental circuit matrix, and cut-set matrix for a given graph.
Bar Graphs And Histograms
This document provides information about different types of graphs including bar graphs, double bar graphs, and histograms. It explains that bar graphs can display and compare data, double bar graphs can compare two related data sets, and histograms show the frequency of data values within intervals using touching bars of equal width. Steps are provided for constructing each type of graph using example data sets.
5.5 writing linear equations
1) Parallel lines have the same slope. Perpendicular lines have slopes that are negative reciprocals of each other.
2) To determine if two lines are parallel or perpendicular, you calculate their slopes. If the slopes are equal, the lines are parallel. If the slopes are negative reciprocals, the lines are perpendicular.
3) To find the equation of a line parallel or perpendicular to a given line, you use the slope of the given line and the point-slope formula. For a parallel line, you use the same slope. For a perpendicular line, you use the negative reciprocal slope.
NCV 4 Mathematical Literacy Hands-On Support Slide Show - Module 2 Part 3
This slide show complements the learner guide NCV 4 Mathematical Literacy Hands-On Training by San Viljoen, published by Future Managers Pty Ltd. For more information visit our website www.futuremanagers.net
K map
K map or karnaugh's map is a very important topic when studying boolean algebra.
Here is my powerpoint presentation to explain it in the easiest manner.Also I have added a question for your understanding.For the solution please write me up in the comment box.
Data handling
This document discusses different types of graphs used to represent data. It outlines eight main types of graphs: bar graphs, pie charts, tally charts, area graphs, pictographs, waterfall graphs, line graphs, and polar graphs. Each graph type is briefly described, including details about bar graphs having two axes (X and Y), pie charts showing proportional sectors, and waterfall charts representing cumulative positive or negative values. Pictographs use pictures to represent data, while line graphs connect data points with straight lines. The document provides a high-level overview of common graph types used for data visualization.
Wireframe models
Wireframe models represent 3D objects using geometric primitives like points, lines, and polygons. They connect vertices with edges to form polygonal nets or meshes. There are three common representations: explicit vertex lists that store each vertex coordinate; polygon listings that define polygons through vertex indices; and explicit edge listings that store each unique edge and define polygons through edge indices. Wireframe models are easy to create but cannot represent curved surfaces or differentiate interior/exterior.
Implicit Interpolation Analytical Curves
Here in this presentation we will be getting to know about Implicit Interpolation Analytical Curves related to Manufacturing and Designing, Design criteria, we'll be going through interpolating Curves and Equations, interpolating Matrices and Blending Functions
Lesson 1-1: Basic Geometric Figures
This document defines and explains basic geometric figures including points, lines, line segments, rays, planes, and angles. It provides descriptions of each figure and conventions for naming them properly. Examples are given to illustrate the definitions and naming. The document serves as an introduction to the fundamental concepts and terminology of geometry.
Directions & planes
The document discusses directions and planes in a cubic unit cell. It provides three key points:
1) Directions and planes are used to identify the orientation of atoms, which influences properties like slip, failure modes, conductivity, and more.
2) Miller indices provide a simple notation for representing planes and directions using intercepts with the x, y, and z axes of the unit cell.
3) Specific procedures are outlined for determining the Miller indices that represent a plane or direction using points of intersection with the unit cell axes.
How to Create Bar and Line Graphs
The document provides instructions for creating bar and line graphs, including how to label the axes, choose an appropriate scale and interval, and add a title. It explains that the dependent variable goes on the y-axis and independent variable on the x-axis. Bar graphs are used to compare categorical data, while line graphs show relationships between variables and trends over time. Examples of properly formatted bar and line graphs are also included.
Graph ppt
This document provides information about different types of graphs. It defines what a graph is as a two-dimensional drawing that shows the relationship between two sets of numbers using a line, curve, bars, or other symbols. It then describes several common types of graphs: circle graphs that display data in circular sections; bar graphs that use vertical or horizontal bars of equal width; pictographs that use pictures and symbols with a key; broken line graphs that join data points over time with line segments; continuous line graphs where points on the line also have meaning; and scatter plots that show a set of plotted points.
DIAGRAMMATIC PRESENTATION OF DATA
This document discusses diagrammatic presentations of data, which use geometric techniques like bar diagrams, pie charts, and cartograms to visually present numerical information. The main advantages of these diagrams are that they are attractive, easy to remember and understand, simplify complex data, and help make comparisons. There are one-dimensional, two-dimensional, and three-dimensional diagrams. Examples provided include line graphs, bar graphs, sub-divided bar graphs, rectangular diagrams, and pie charts. Pie charts in particular can be used to show percentages and proportional relationships between parts of a whole.
Qt graphical representation of data
The document discusses various types of graphic representations of data including graphs, diagrams, and charts. It describes graphs as a pictorial presentation of data using lines, bars, and dots. It explains the meaning and significance of graphs, compares tabular and graphic representations, and outlines general rules for constructing graphs. The document also discusses one variable graphs, two variable graphs, time series graphs, and different types of charts including histograms, frequency polygons, box plots, Pareto charts, fishbone diagrams, and more. It covers the merits, demerits, and limitations of using graphs.
Geometric model & curve
This document discusses geometric modeling and curves. It provides information on:
- Geometric modeling is the process of creating mathematical models of physical objects and systems using computer software.
- There are different types of geometric models including wireframe, surface, and solid modeling.
- Curves can be represented mathematically in both implicit and parametric forms, with parametric being most common in modeling as it overcomes limitations of other forms.
- Parametric curves define a curve using a parameter, where varying the parameter provides points on the curve. Common parametric representations include lines, conics, and higher-order curves composed of simpler curve segments.
Alg2 lesson 2.3
1) The slope of a line passing through (-3,5) and (2,1) can be determined using the slope formula: m=(Δy/Δx) which is (1-5)/(-3-2)=-4/5.
2) Lines can be classified by their slope as having a positive, zero, negative, or undefined slope.
3) A line parallel to the graph of 4x-2y=10 that passes through (2,1) has a slope of 2.
Controlled assessment - Data Presentation
This document provides guidance for students presenting data on changes in river channel characteristics from the upper to lower course. It outlines hypotheses about how channel size, efficiency, and gradient will change downstream and lists essential graphs to include, such as cross-sectional area, efficiency, and gradient over 12 sites. Students are instructed to draw cross-sections to scale for their 4 sites and include photos and text to make the cross-sections more sophisticated. Examples of student cross-sections are shown. The document also provides examples of bar, line, and scatter graphs to present trends in cross-sectional area, efficiency, velocity, and gradient downstream.
5 1c Graphing lines from a point and slope
Given a point and slope, this document provides instructions for graphing the line through that point with the given slope. It explains that you should plot the point, determine if the slope is positive, negative, zero, or undefined, then use the slope to move up/down and over from the point to draw the line. It also notes that if the slope is a whole number, it should be converted to a ratio, and provides examples of graphing lines from different points with various slopes.
Introduction to graph
A graph is a visual representation of data using points connected by lines or bars. It can show relationships between different types of data. Common types of graphs include bar graphs, pie charts, histograms, and line graphs. Bar graphs compare categories using vertical or horizontal bars of different heights or lengths. Pie charts show proportions using a circle divided into wedge-shaped slices. Histograms display frequency distributions using rectangular bars of varying heights. Line graphs track changes over time by connecting data points with lines. Rene Descartes introduced the Cartesian coordinate system to precisely locate points on a graph using their x and y coordinates.
What's hot (19)
NCV 4 Mathematical Literacy Hands-On Support Slide Show - Module 2 Part 3
NCV 4 Mathematical Literacy Hands-On Support Slide Show - Module 2 Part 3
Viewers also liked
7 2
This document discusses writing linear equations in point-slope form. It explains that a linear equation describes all points that lie on a line and can be determined by plugging coordinates into the equation. It also notes that the equation of a line can be written if the slope and coordinates of one point are known. Finally, it provides the point-slope form equation of y - y1 = m(x - x1) and assigns examples and problems for students to complete.
M1 l3
This document discusses writing equations of lines. It explains that a linear equation can be written in the form of y=mx+b, where m is the slope and b is the y-intercept. It provides examples of writing the equation of a line when given a slope and point, and when given two points, by finding the slope and using one of the points to solve for b and write the full equation in y=mx+b form.
5.1 writing linear equations day 1
This chapter discusses writing linear equations in slope-intercept form (y=mx+b) by either knowing the slope and y-intercept or by being given two points on the line. It provides examples of writing equations of lines from graphical representations or when given the slope and y-intercept numerically. Students are guided in writing linear equations from different scenarios like being given two points or the cost equation of a recording studio based on hours of studio time.
Module 4 topic 3 notes
The document discusses different forms for writing linear equations based on available information. It explains that the slope-intercept form is y=mx+b, where m is the slope and b is the y-intercept. It also covers point-slope form, which is used when given a point and slope, as y - y1=m(x-x1). Finally, it discusses finding the slope from two points as m=(y2-y1)/(x2-x1) when the slope is unknown.
Graphing lines
This document discusses how to graph linear equations on a Cartesian coordinate system using either a single point and the slope of the line, or two points on the line. It explains that the coordinate system has four quadrants defined by positive and negative x and y axes, and that all points are plotted using an x and y coordinate written as (x,y) relative to the origin point.
8 7 Notes
This document discusses writing linear equations from different representations, including substitution tables, two points, and graphing. It provides examples of writing equations in slope-intercept form given the slope and y-intercept, or from a graph, two points, or a substitution table. The homework assigned is to write linear equations from given representations using problems 4-30 on page 407 of the textbook, focusing on the even-numbered problems.
Presentation pes gp 3. en union för och med solidaritet ver 1.0
PES Fundamental programme översatt till svenska.
2.4 writing equations of lines
1) This document discusses writing linear equations in slope-intercept form (y=mx+b) given different information: the slope (m) and y-intercept (b), a graph, the slope and a point, or two points.
2) It provides examples of writing equations of lines given: the slope and y-intercept, a graph, the slope and a point, two points, or the x- and y-intercepts.
3) The key steps are to identify the slope (m) and y-intercept (b) from the information provided, then substitute those values into the slope-intercept form equation to write the linear equation.
A1 5-1 Writing Equations
Slope-intercept form for a linear equation is written as y = mx + b, where m is the slope, which is calculated by taking the rise over the run between any two points on the line, and b is the y-intercept, which is the y-value when x is 0. The example given shows how to find the slope as rise/run = 4/2 = 2 and the y-intercept using the point (0, -4) to write the equation in slope-intercept form as y = 2x - 4.
Writing linear equations KG Math Middle School
The document provides information about graphing and writing linear equations in slope-intercept form (y=mx+b). It defines slope and y-intercept, and explains how to graph lines by using the slope and y-intercept. It also demonstrates how to write an equation of a line when given the slope and y-intercept, a point and the slope, or two points. Key steps include finding the slope using the formula (m=(y2-y1)/(x2-x1)), setting up and solving equations to find the y-intercept, and plugging the slope and y-intercept into the slope-intercept form to write the equation.
Graph of a linear equation practice problems
Students plot solutions to linear equations 3x + y = -8 and x - 5y = 11 on a coordinate plane to identify that the graphs are straight lines. They also explain that the graph of -x + 2y = 3 is a straight line based on the linear nature of the equation. Finally, students are challenged to come up with a non-linear equation and plot its solutions to show a non-linear graph.
Module 1 solving inequalities notes
This document provides an overview of solving linear inequalities. It introduces inequality notation and properties, discusses multiplying and dividing by negative numbers, and provides examples of solving different types of linear inequalities. It also covers interval notation, graphing solutions to inequalities on number lines, and using interactive tools like Gizmos for additional practice with inequalities.
Graphing linear equations
A lesson on graphing linear equations appropriate for middle and high school Algebra or Pre-Algebra students.
Math 4 6
This document discusses key concepts for graphing linear equations including functions, inputs, outputs, domains, ranges, and different types of equations that produce linear, quadratic, or absolute value graphs. It defines linear equations as having variables that are never squared and provides examples of linear equations. It also describes how quadratic equations with squared x and y variables will produce circular graphs while absolute value equations create V-shaped graphs.
Linear equation
1) The document discusses linear equations in slope-intercept (y=mx+b) and standard (ax+by=c) form. It provides examples of writing equations from graphs and vice versa.
2) Transformations of linear and quadratic equations are introduced, where changing coefficients or adding constants changes the graph by shifting it up/down or left/right.
3) Examples of graphing quadratic equations y=x^2 and transformations y=x^2+c and y=kx^2+c are shown and described.
Writing and Graphing Linear Equations
This document contains 10 practice questions similar to those that may appear on a mastery assignment. It provides the questions, step-by-step solutions and explanations, and final answers in standard form when required. The questions cover topics such as finding the equation of a line given two points, determining if lines are parallel, perpendicular or neither, describing line graphs, finding intercepts of lines, and rewriting equations in standard form.
Graph of a linear equation in two variables
The document discusses plotting solutions to a linear equation on a coordinate plane to graph it. It notes that while there are an infinite number of solutions, plotting a few points can help predict the shape of the graph. It then plots 5 solutions to the equation x + y = 6, with points falling in a straight line. This suggests the graph of any linear equation will be a straight line rather than a curve, since all points satisfying the equation must lie on the same line.
Writing and Graphing slope intercept form
The document discusses graphing and writing equations in slope-intercept form (y=mx+b). It explains that the slope (m) is the coefficient and the y-intercept (b) is the constant. It provides examples of graphing lines by plotting the y-intercept and counting up/right by the slope. It also demonstrates writing equations given the slope and/or a point, including finding missing values like the y-intercept.
Gr10 writing linear equations
The document discusses writing linear equations using slope-intercept form, y = mx + b, where m is the slope and b is the y-intercept. It provides examples of finding the equation of a line given the slope and y-intercept, or using two points on the line. Key steps include calculating the slope as rise over run, using points to find the y-intercept and substitute into the slope-intercept form to write the equation of the line.
Viewers also liked (20)
Presentation pes gp 3. en union för och med solidaritet ver 1.0
Presentation pes gp 3. en union för och med solidaritet ver 1.0
Similar to 5.1 writing linear equations in slope intercept form
5.5 point slope form of a linear equation
In this presentation, you will find the basic instructions to write a linear equation using the point-slope form. This is an alternative method to the widely used slope-intercept form of a linear equation.
2.3 and 2.4 Lines
This document discusses linear functions and different forms of writing linear equations. It introduces linear functions and their representation as linear equations. It describes intercepts as the points where a line crosses the x-axis or y-axis. The slope-intercept form of a line is given as y = mx + b, where m is the slope and b is the y-intercept. It provides examples of writing equations in slope-intercept form and finding the slope and y-intercept. It also covers the point-slope form and how to write the equation of a line given a point and slope or two points. Finally, it discusses standard form for linear equations.
2.3
This document discusses linear functions and slope-intercept form. It defines slope and describes how to calculate the slope between two points. It explains that a linear function is one whose graph is a straight line and can be represented by a linear equation. It defines y-intercepts and x-intercepts as the points where a line crosses the y-axis and x-axis. It shows how to write a linear equation in slope-intercept form using the slope and y-intercept. Examples are given for finding the slope and y-intercept of a line and writing the line's equation in slope-intercept form. It also demonstrates how to graph a line by using its equation in slope-intercept form.
2.5 Equations of Lines
This document discusses equations of lines, including linear functions and their standard, point-slope, and slope-intercept forms. It defines parallel and perpendicular lines based on their slopes. It provides examples of writing the equation of a line from its graph or from a point and slope. Key steps include calculating the slope, selecting a point, and writing the equation in the appropriate form.
4.6 quick graphs using slope intercept form
The following presentation helps teachers and students to work with the slope and y-intercept as tools for graphing. It also shows the relationship between parallel lines and the slopes of the lines.
5 8 Parallel Perpendicular Lines
This document provides background information and examples on parallel and perpendicular lines. It discusses how to identify the slope of a line from its equation in slope-intercept or standard form. It notes that parallel lines have the same slope, while perpendicular lines have slopes that are opposite reciprocals whose product is -1. Examples are provided to find the slopes of parallel and perpendicular lines and to write equations of lines given a point and slope.
2.4
This document discusses linear equations and their various forms. It covers finding the equation of a line given a point and slope using point-slope form, or given two points using the formula for slope and point-slope form. It also discusses writing equations in standard and slope-intercept form, finding intercepts to graph lines, and writing equations of lines parallel or perpendicular to given lines through a specified point. Examples are provided for each concept.
Calculus
This lecture discusses inequalities, absolute values, and graphs of solutions to inequalities on a coordinate plane. Key points covered include:
- Inequalities relate values that are different using symbols like < and >. Operations on inequalities follow rules like adding/subtracting a positive number or multiplying/dividing by a negative number requires changing the inequality symbol.
- Absolute value expressions use | | to represent the distance from zero. Operations inside | | follow different rules than normal order of operations.
- Graphing solutions to inequalities involves open/closed circles and drawing lines left/right to represent <, >, ≤, or ≥. Examples are worked through to demonstrate graphing linear and quadratic inequalities.
1st trimester exam coverage
This document provides a summary of topics covered in the 1st trimester of Grade 11 Mathematics, including:
1) Classifying polygons using properties like side lengths, slopes, and angles
2) Distinguishing between functions and relations based on their domains and ranges
3) Writing equations to represent loci like lines, circles, and parabolas
4) Calculating directed distance to determine if a point lies on, above, or below a line
5) Finding the intersection of lines algebraically or by checking if a point satisfies both line equations
6) Recognizing circle equations in standard and general form and writing circle equations from graphs
7) Describing parabolas as loci of points equid
Lesson 3-7 Equations of Lines in the Coordinate Plane 189.docx
Lesson 3-7 Equations of Lines in the Coordinate Plane 189
3-7
Objective To graph and write linear equations
Ski resorts often use steepness to rate the difficulty
of their hills. The steeper the hill, the higher the
difficulty rating. Below are sketches of three new hills
at a particular resort. Use each rating level only once.
Which hill gets which rating? Explain.
Difficulty Ratings
Easiest
Intermediate
Difficult
3300 ft 3000 ft 3500 ft
1190 ft 1180 ft 1150 ft
A B C
Th e Solve It involves using vertical and horizontal distances to determine steepness.
Th e steepest hill has the greatest slope. In this lesson you will explore the concept of
slope and how it relates to both the graph and the equation of a line.
Essential Understanding You can graph a line and write its equation when you
know certain facts about the line, such as its slope and a point on the line.
Equations of Lines in the
Coordinate Plane
Think back!
What did you
learn in algebra
that relates to
steepness?
Key Concept Slope
Defi nition
Th e slope m of a line is the
ratio of the vertical change
(rise) to the horizontal change
(run) between any two points.
Symbols
A line contains the
points (x1, y1) and
(x2, y2) .
m 5
rise
run 5
y2 2 y1
x2 2 x1
Diagram
(x2, y2)
(x1, y1)
O
x
y run
rise
Lesson
Vocabulary
• slope
• slope-intercept
form
• point-slope form
L
V
L
V
• s
LL
VVV
• s
hsm11gmse_NA_0307.indd 189 2/24/09 6:49:09 AM
http://media.pearsoncmg.com/aw/aw_mml_shared_1/copyright.html
Problem 1
Got It?
190 Chapter 3 Parallel and Perpendicular Lines
Finding Slopes of Lines
A What is the slope of line b?
m 5
2 2 (22)
21 2 4
5 4
25
5 245
B What is the slope of line d?
m 5
0 2 (22)
4 2 4
5 20 Undefi ned
1. Use the graph in Problem 1.
a. What is the slope of line a?
b. What is the slope of line c?
As you saw in Problem 1 and Got It 1 the slope of a line can be positive, negative,
zero, or undefi ned. Th e sign of the slope tells you whether the line rises or falls
to the right. A slope of zero tells you that the line is horizontal. An undefi ned slope
tells you that the line is vertical.
You can graph a line when you know its equation. Th e equation of a line has diff erent
forms. Two forms are shown below. Recall that the y-intercept of a line is the
y-coordinate of the point where the line crosses the y-axis.
O
y
c
b
d a
x
2
2 86
4
6
( 1, 2)
(4, 2)
(4, 0)
(5, 7)(1, 7)
(2, 3)
Positive slope
O
x
y
Negative slope
O
x
y
Zero slope
O
x
y
Undefined slope
O
x
y
Key Concept Forms of Linear Equations
Defi nition
Th e slope-intercept form of an equation of
a nonvertical line is y 5 mx 1 b, where m
is the slope and b is the y-intercept.
Symbols
Th e point-slope form of an equation of a
nonvertical line is y 2 y1 5 m(x 2 x1),
where m is the slope and (x1, y1) is a point
on the line.
y mx b
slope y-intercept
y y1 m(x x1)
slope x-coordinatey-coordinate
A
...
Slope and Equations of Lines
This document discusses slopes and equations of lines. It defines slope as the rate of change of a straight line and provides the slope formula. Positive slopes mean the graph lines go up from left to right, while negative slopes mean lines go down. There are three common forms for writing linear equations: slope-intercept form where the slope is the coefficient of x; standard form where A, B, and C don't represent slope or y-intercept; and point-slope form used when a point and slope on the line are known. Special cases for horizontal and vertical lines are also covered. Videos demonstrate calculating slope and writing equations in slope-intercept and point-slope form.
4.1 quadratic functions and transformations
This document discusses quadratic functions and transformations. It defines key terms like parabola, vertex, and axis of symmetry. It explains how the a value in the vertex form y=a(x-h)^2+k determines if a parabola is vertically stretched or compressed. It also states that if a is negative, the graph is reflected over the x-axis. The minimum or maximum value of a quadratic is always the y-coordinate of the vertex. The document provides examples of graphing and writing quadratic functions using vertex form.
Chapter 5 Slopes of Parallel and Perpendicular Lines
This document provides a lesson on identifying and writing equations for parallel and perpendicular lines. It includes examples of identifying parallel lines based on their having the same slope. Perpendicular lines are defined as having slopes whose product is -1. The document also demonstrates how to write equations for lines parallel or perpendicular to a given line based on their point and slope. Examples are provided to illustrate finding slopes from graphs and using them to determine if lines are parallel or perpendicular.
Geometry unit 3.8
This document provides examples and explanations about parallel and perpendicular lines. It defines parallel lines as lines in the same plane that do not intersect. Perpendicular lines intersect to form a 90 degree angle. Several examples show how to identify parallel and perpendicular lines based on their slopes. The document also demonstrates applications to geometry, such as showing when a figure like a parallelogram or right triangle is formed based on the relationships between line slopes.
Curves
This document discusses different ways to mathematically represent curves, including polynomial representations and parametric forms. It focuses on cubic polynomials and parametric representations, explaining that parametric form solves problems with explicit and implicit forms by allowing representation of curves with infinite slopes or multiple y-values for a given x-value. Parametric form also makes it easier to combine curve segments continuously. The document then discusses spline curves, which use piecewise cubic polynomial functions to fit smooth curves through points, and cubic splines specifically, providing the equations used to define cubic splines.
5.5 parallel and perpendicular lines (equations) day 1
The document discusses writing equations of parallel and perpendicular lines, including identifying whether lines are parallel or perpendicular based on their slopes. It provides examples of writing equations of parallel and perpendicular lines given a point and the slope or line of another line. Guidance problems are also included to practice these skills.
Geometry unit 3.8
The document discusses parallel and perpendicular lines. It provides examples of identifying parallel and perpendicular lines based on their slopes. It also discusses writing equations of lines parallel and perpendicular to given lines, and applications involving parallel and perpendicular lines in geometry problems involving shapes like parallelograms, rectangles, and right triangles.
Magtibay buk bind#2
The document discusses Hamiltonian graphs, which are graphs that contain a Hamiltonian circuit or path. A Hamiltonian circuit visits each vertex in the graph exactly once and forms a cycle. The document provides an example of a graph that is Hamiltonian but not Eulerian, and vice versa. It notes that while it is clear only connected graphs can be Hamiltonian, there is no simple criterion to determine if a graph is Hamiltonian like there is for Eulerian graphs. It presents Dirac's sufficient condition for a graph to be Hamiltonian.
Intermediate Algebra Question #1 30 pointsGiven the points .docx
Intermediate Algebra
Question #1: 30 points
Given the points A(-5,2), B(3,-4), and C(5,3).
1. Plot the 3 points on a piece of graph paper. Do this by hand. If you use a graphing calculator, copy the graph by hand onto a sheet of graph paper. Electronic plots are not accepted. Remember, you need to know what you are doing so that if you punch in a wrong number, you will know that something is wrong!
2. Draw the line AB on your graph paper.
3. What is the slope of the line AB?
4. What is the y-intercept of the line AB?
5. What is the equation of the line AB in slope-intercept form?
6. What is the slope of the line which passes through point C and is parallel to line AB?
7. What is the y-intercept of the line which passes through point C and is parallel to line AB?
8. What is the equation of the line in slope-intercept form which passes through point C and is parallel to line AB?
9. Draw the line in part 8 on your graph paper.
10. Does this line look parallel to line AB? (yes or no)
11. Does the y-intercept of the graph match the value you calculated in part 7? (yes or no)
12. What is the slope of the line which passes through point C and is perpendicular to line AB?
13. What is the y-intercept of the line which passes through point C and is perpendicular to line AB?
14. What is the equation of the line which passes through point C and is perpendicular to line AB?
15. Draw the line in part 14.
16. Does this line look perpendicular to line AB? (yes or no)
17. Does the y-intercept of the graph match the value you calculated in part 13? (yes or no)
Question #2: 10 points
Let the equation of a line in general form (Ax + By = C) be : 3x + 5y = 15.
1. Re-write the equation so that it is in slope-intercept form (p.102 of the book).
2. Re-write the equation so that it is in point-slope form (p.107 of the book). Clearly show how you got the ordered pair (x1,y1) to put in your equation.
Question #3: 15 points
Let 5x + 15 > 15. Let -2x +6 >= 12.
1. Solve the first inequality for x.
2. Write your answer in interval notation.
3. Plot your first answer on a graph.
4. Solve the second inequality for x.
5. Write your answer in interval notation.
6. Plot your second answer on a graph.
7. Write your combined answer in interval notation for the OR solution for x (p124 of book).
8. Write your combined answer in interval notation for the AND solution for x (p125 of book).
Question #4: 20 points
Altimeter data from NASA satellites have been measuring sea level relative to the center of the earth since 1992. In 1993, the average global sea level height was -12 mm on an arbitrary scale. In 2014, the average global sea level height was +55 mm on the same scale. Let x equal the number of years after 1993.
1. Write two ordered pairs to represent the information given above.
2. Find the slope of the line which passes through these two points.
3. Write the equation of the line in point-slope form.
4. Write the equation of the line in slope-intercept form.
5. Draw .
Similar to 5.1 writing linear equations in slope intercept form (20)
Lesson 3-7 Equations of Lines in the Coordinate Plane 189.docx
Lesson 3-7 Equations of Lines in the Coordinate Plane 189.docx
Chapter 5 Slopes of Parallel and Perpendicular Lines
Chapter 5 Slopes of Parallel and Perpendicular Lines
5.5 parallel and perpendicular lines (equations) day 1
5.5 parallel and perpendicular lines (equations) day 1
Intermediate Algebra Question #1 30 pointsGiven the points .docx
Intermediate Algebra Question #1 30 pointsGiven the points .docx
More from Anibal Aguilar Barahona
1.2 Classification of Propositions.pptx
This document defines propositions and their classification in symbolic logic. A proposition is a statement that is either true or false, but not both. Propositions can be simple, which have the most basic sentence structure, or compound, which are the union of two or more simple propositions joined by connectors like "and" or "or". The document provides examples of simple and compound propositions and explains how to identify whether a statement is a proposition or not based on if it can be proven true or false.
1.1 Basic Definitions.pptx
Brief presentation on the basic definitions used in Symbolic Logic. This vocabulary uses the first concepts applied at the beginning of a Symbolic Logic course.
10.8 factoring using the distributive property
The process of factoring a polynomial may have several steps before reaching the final answer. In this presentation, we will factor expressions with greatest common factors, special products, quadratic trinomials, or polynomials by grouping.
Graphing Quadratic Inequalities, Verifying Solutions.
The following presentation shows a brief method to verify if given points are solutions or not of quadratic inequalities.
Also, we have the process to graph a quadratic inequality with its corresponding solution set.
The idea is to have a clear method to graph a quadratic inequality using the equivalent quadratic equation, as an alternative method.
Applications of the Discriminant
With this presentation, we want to show the advantage of using the discriminant in quadratic equations to determine the nature of the solutions of the equation.
3.1 Integers and Absolute Value
To model integers on a number line and find absolute value. The set of integers includes negative numbers like -3, -2, -1, positive numbers like 1, 2, 3, and zero. Absolute value of a number is the distance between that number and zero on the number line, and is always positive. Exercises include plotting integers on a number line, writing inequalities between them, evaluating absolute values, and identifying if numbers are opposites.
3.3 Solving Multi-Step Equations
This document discusses solving multi-step equations using two or more transformations. It provides 4 cases of multi-step equations as examples: 1) Combining like terms, 2) Using the distributive property, 3) Distributing a negative number, and 4) Multiplying by a reciprocal. For each case, it shows the step-by-step work of solving a sample equation as an example. At the end, it assigns homework problems from the textbook for additional practice.
Segunda ley de newton y masa variable
La segunda ley de Newton establece que la fuerza neta sobre un cuerpo es igual a su masa por su aceleración. Cuando la masa varía con el tiempo, como en el caso de una cadena que se desenrolla, se debe aplicar la segunda ley de Newton para derivar una ecuación diferencial que describa el movimiento. El documento presenta un ejemplo de una cadena que se jala verticalmente y deriva la ecuación diferencial correspondiente a su movimiento.
More from Anibal Aguilar Barahona (8)
Graphing Quadratic Inequalities, Verifying Solutions.
Graphing Quadratic Inequalities, Verifying Solutions.
Recently uploaded
How to Fix the Import Error in the Odoo 17
An import error occurs when a program fails to import a module or library, disrupting its execution. In languages like Python, this issue arises when the specified module cannot be found or accessed, hindering the program's functionality. Resolving import errors is crucial for maintaining smooth software operation and uninterrupted development processes.
DRUGS AND ITS classification slide share
Any substance (other than food) that is used to prevent, diagnose, treat, or relieve symptoms of a
disease or abnormal condition
A Strategic Approach: GenAI in Education
Artificial Intelligence (AI) technologies such as Generative AI, Image Generators and Large Language Models have had a dramatic impact on teaching, learning and assessment over the past 18 months. The most immediate threat AI posed was to Academic Integrity with Higher Education Institutes (HEIs) focusing their efforts on combating the use of GenAI in assessment. Guidelines were developed for staff and students, policies put in place too. Innovative educators have forged paths in the use of Generative AI for teaching, learning and assessments leading to pockets of transformation springing up across HEIs, often with little or no top-down guidance, support or direction.
This Gasta posits a strategic approach to integrating AI into HEIs to prepare staff, students and the curriculum for an evolving world and workplace. We will highlight the advantages of working with these technologies beyond the realm of teaching, learning and assessment by considering prompt engineering skills, industry impact, curriculum changes, and the need for staff upskilling. In contrast, not engaging strategically with Generative AI poses risks, including falling behind peers, missed opportunities and failing to ensure our graduates remain employable. The rapid evolution of AI technologies necessitates a proactive and strategic approach if we are to remain relevant.
Pollock and Snow "DEIA in the Scholarly Landscape, Session One: Setting Expec...
Pollock and Snow "DEIA in the Scholarly Landscape, Session One: Setting Expec...National Information Standards Organization (NISO)
This presentation was provided by Steph Pollock of The American Psychological Association’s Journals Program, and Damita Snow, of The American Society of Civil Engineers (ASCE), for the initial session of NISO's 2024 Training Series "DEIA in the Scholarly Landscape." Session One: 'Setting Expectations: a DEIA Primer,' was held June 6, 2024.Top five deadliest dog breeds in America
Thinking of getting a dog? Be aware that breeds like Pit Bulls, Rottweilers, and German Shepherds can be loyal and dangerous. Proper training and socialization are crucial to preventing aggressive behaviors. Ensure safety by understanding their needs and always supervising interactions. Stay safe, and enjoy your furry friends!
How to Add Chatter in the odoo 17 ERP Module
In Odoo, the chatter is like a chat tool that helps you work together on records. You can leave notes and track things, making it easier to talk with your team and partners. Inside chatter, all communication history, activity, and changes will be displayed.
How to Manage Your Lost Opportunities in Odoo 17 CRM
Odoo 17 CRM allows us to track why we lose sales opportunities with "Lost Reasons." This helps analyze our sales process and identify areas for improvement. Here's how to configure lost reasons in Odoo 17 CRM
Main Java[All of the Base Concepts}.docx
This is part 1 of my Java Learning Journey. This Contains Custom methods, classes, constructors, packages, multithreading , try- catch block, finally block and more.
Hindi varnamala | hindi alphabet PPT.pdf
हिंदी वर्णमाला पीपीटी, hindi alphabet PPT presentation, hindi varnamala PPT, Hindi Varnamala pdf, हिंदी स्वर, हिंदी व्यंजन, sikhiye hindi varnmala, dr. mulla adam ali, hindi language and literature, hindi alphabet with drawing, hindi alphabet pdf, hindi varnamala for childrens, hindi language, hindi varnamala practice for kids, https://www.drmullaadamali.com
Assessment and Planning in Educational technology.pptx
In an education system, it is understood that assessment is only for the students, but on the other hand, the Assessment of teachers is also an important aspect of the education system that ensures teachers are providing high-quality instruction to students. The assessment process can be used to provide feedback and support for professional development, to inform decisions about teacher retention or promotion, or to evaluate teacher effectiveness for accountability purposes.
The History of Stoke Newington Street Names
Presented at the Stoke Newington Literary Festival on 9th June 2024
www.StokeNewingtonHistory.com
Types of Herbal Cosmetics its standardization.
Physiology and chemistry of skin and pigmentation, hairs, scalp, lips and nail, Cleansing cream, Lotions, Face powders, Face packs, Lipsticks, Bath products, soaps and baby product,
Preparation and standardization of the following : Tonic, Bleaches, Dentifrices and Mouth washes & Tooth Pastes, Cosmetics for Nails.
How to Build a Module in Odoo 17 Using the Scaffold Method
Odoo provides an option for creating a module by using a single line command. By using this command the user can make a whole structure of a module. It is very easy for a beginner to make a module. There is no need to make each file manually. This slide will show how to create a module using the scaffold method.
Recently uploaded (20)
Pollock and Snow "DEIA in the Scholarly Landscape, Session One: Setting Expec...
Pollock and Snow "DEIA in the Scholarly Landscape, Session One: Setting Expec...
Pride Month Slides 2024 David Douglas School District
Pride Month Slides 2024 David Douglas School District
How to Manage Your Lost Opportunities in Odoo 17 CRM
How to Manage Your Lost Opportunities in Odoo 17 CRM
Liberal Approach to the Study of Indian Politics.pdf
Liberal Approach to the Study of Indian Politics.pdf
Assessment and Planning in Educational technology.pptx
Assessment and Planning in Educational technology.pptx
How to Build a Module in Odoo 17 Using the Scaffold Method
How to Build a Module in Odoo 17 Using the Scaffold Method
5.1 writing linear equations in slope intercept form
- 1. CHAPTER 5: WRITING LINEAR EQUATIONS 5.1 WRITING LINEAR EQUATIONS IN SLOPE-INTERCEPT FORM BY: ANIBAL AGUILAR BARAHONA
- 2. 5.1 WRITING LINEAR EQUATIONS IN SLOPE-INTERCEPT FORM During this lesson, you will learn how to write an equation of a line using as information, the slope (m) and the y-intercept (b). To do this, you need to remember the slope-intercept form of a linear equation: 𝒚 = 𝒎𝒙 + 𝒃 You also need to remember that there are different ways to represent the slope of a line: 𝒎 = ∆𝒚 ∆𝒙 = 𝒄𝒉𝒂𝒏𝒈𝒆 𝒊𝒏 𝒚 𝒄𝒉𝒂𝒏𝒈𝒆 𝒊𝒏 𝒙 = 𝒚 𝟐 − 𝒚 𝟏 𝒙 𝟐 − 𝒙 𝟏 The y-intercept is the point in the y-axis were the graph of the line is crossing.
- 3. 5.1 WRITING LINEAR EQUATIONS IN SLOPE-INTERCEPT FORM Below, you will see the most typical examples in writing equations of a line using the slope and y-intercept. In some cases, you only need to replace the given values in the slope-intercept form of the linear equation. a. Write an equation of the line whose slope is – 2 and whose y-intercept is 5. b. Write an equatons of the line whose slope is − 2 5 and whose y-intercept is – 10 .
- 4. 5.1 WRITING LINEAR EQUATIONS IN SLOPE-INTERCEPT FORM Information can be presented in different ways in the process of writing an equation of a line. Some examples can be seen below: c. Write an equation of a line passing through 0, −4 that has a change in y of 5 and a change in x of 3. d. Write an equation of a line passing through 0, 12 that has ∆𝑥 = 4 𝑎𝑛𝑑 ∆𝑦 = −8.
- 5. HOMEWORK: PG. 276 EXERCISES 3 to 8, and 12 to 19
- 6. 5.1 WRITING LINEAR EQUATIONS IN SLOPE-INTERCEPT FORM Another way to write equations of a line is by reading information from a graph. In this particular situation, you must follow these steps: • Identify the y-intercept in the graph. • Identify the slope of the line, by finding ∆𝑥 𝑎𝑛𝑑 ∆𝑦, to determine the slope. This can be done by identifying “the triangle” in the line. Examples: Write an equation of the line shown in the graph. 1.
- 7. 5.1 WRITING LINEAR EQUATIONS IN SLOPE-INTERCEPT FORM 2. 3.
- 8. 5.1 WRITING LINEAR EQUATIONS IN SLOPE-INTERCEPT FORM 4.
- 9. HOMEWORK: PG. 276 EXERCISES 20 to 25