Download to read offline
![Int. J. Sci. Res. in Multidisciplinary Studies Vol. 5(9), Sept 2019
© 2019, IJSRMS All Rights Reserved 32
IV. CONCLUSIONS
Using very limited data makes this model very useful for an
ungauged catchment aiming at event prediction. Equivalent
discharge is the maximum discharge that takes place in a
Catchment which can be used to design hydraulic structures.
To derive flood runoff or flood hydrographs, unit
hydrographs were derived by central water commission
method. This information is useful to derive flood
hydrograph along the stream. This drainage network analysis
and application of the UH can provide a significant
contribution towards flood management program. Thus, the
present model could be applied to simulate flood
hydrographs for the catchments that have not been studied
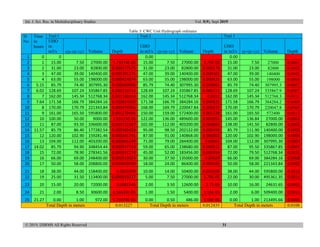
yet. The Peak discharge of unit hydrograph obtained is
171.58m3
/s. The final cumulative discharge is 1669.05 m3
/s.
REFERENCES
[1]. CWC (1986). Flood estimation report for Kaveri basin subzone
3(i). Directorate of Hydrology (small Catchments), Central Water
Commission, New Delhi
[2]. Mohammed Badiuddin Parvez, M Inayathulla “Generation Of
Intensity Duration Frequency Curves For Different Return Period
Using Short Duration Rainfall For Manvi Taluk Raichur District
Karnataka”, International Research Journal of Engineering and
Management Studies (IRJEMS), Volume: 03 Issue: 04 | April -
2019.
[3]. Mohammed Badiuddin Parvez, M Inayathulla “Prioritization Of
Subwatersheds of Cauvery Region Based on Morphometric
Analysis Using GIS”, International Journal for Research in
Engineering Application & Management (IJREAM), Volume: 05
Issue: 01, April -2019. 4.
[4]. Mohammed Badiuddin Parvez, M Inayathulla, "Rainfall Analysis
for Modelling of IDF Curves for Bangalore Rural, Karnataka",
International Journal of Scientific Research in Multidisciplinary
Studies , Vol.5, Issue.8, pp.114-132, 2019.
[5]. Mohammed Badiuddin Parvez, M Inayathulla, "Development of S
Curve for Mini-Watershed of Raichur City Karnataka",
International Journal of Scientific Research in Multidisciplinary
Studies , Vol.5, Issue.8, pp.1-11, 2019
[6]. Clark, C.O. (1945). “Storage and the Unit hydrograph”.
Transactions of the American Society of Civil Engineers
110:1491-46.
Authors Profile
Mohammed Badiuddin Parvez Is a life
member of Indian Water Resources
Society, ASCE Born in Gangavathi,
Obtained his BE in Civil Engineering in
the year 2009-2013 from UVCE,
Banagalore and M.E with specialization
on Water Resources Engineering
during 2013-2015 from UVCE, Bangalore University and
Pursuing Ph.D from Bangalore University. And has 3 years
of teaching experience. Till date, has presented and
published several technical papers in many National and
International seminars, Journals and conferences.
Dr M Inayathulla Is a life member of
Environmental and Water Resources
Engineering (EWRI), ASCE, WWI,
ASTEE, ASFPM. Born in Karnataka,
Obtained his BE in Civil Engineering in
the year 1987-1991 from UBDT,
Davanagere and M.E with specialization
on Water Resources Engineering during
1992-1994 from UVCE, Bangalore University and got
Doctorate from Bangalore University in the year 1990-1995.
Presently working as Professor at UVCE, Bangalore
University, India. And has more than 25 years of teaching
experience. Till date, has presented and published several
technical papers in many National and International
seminars and conferences.](https://image.slidesharecdn.com/5-ijsrms-026171-191029161419/85/5-ijsrms-02617-1-5-320.jpg)

This research paper presents the derivation of dimensionless unit hydrograph and S-curve for the Manvi Taluk mini-watershed in Karnataka, highlighting the methodologies utilized for ungauged catchments. The study area spans 466.02 km² with elevation variation from 341 m to 569 m, resulting in a peak unit hydrograph discharge of 171.58 m³/s and a final cumulative discharge of 1669.05 m³/s. The findings aim to enhance flood management programs by providing essential data for areas lacking prior hydrological studies.