The document discusses unit hydrographs, which are used to model the response of a watershed's streamflow to rainfall. It covers topics such as:
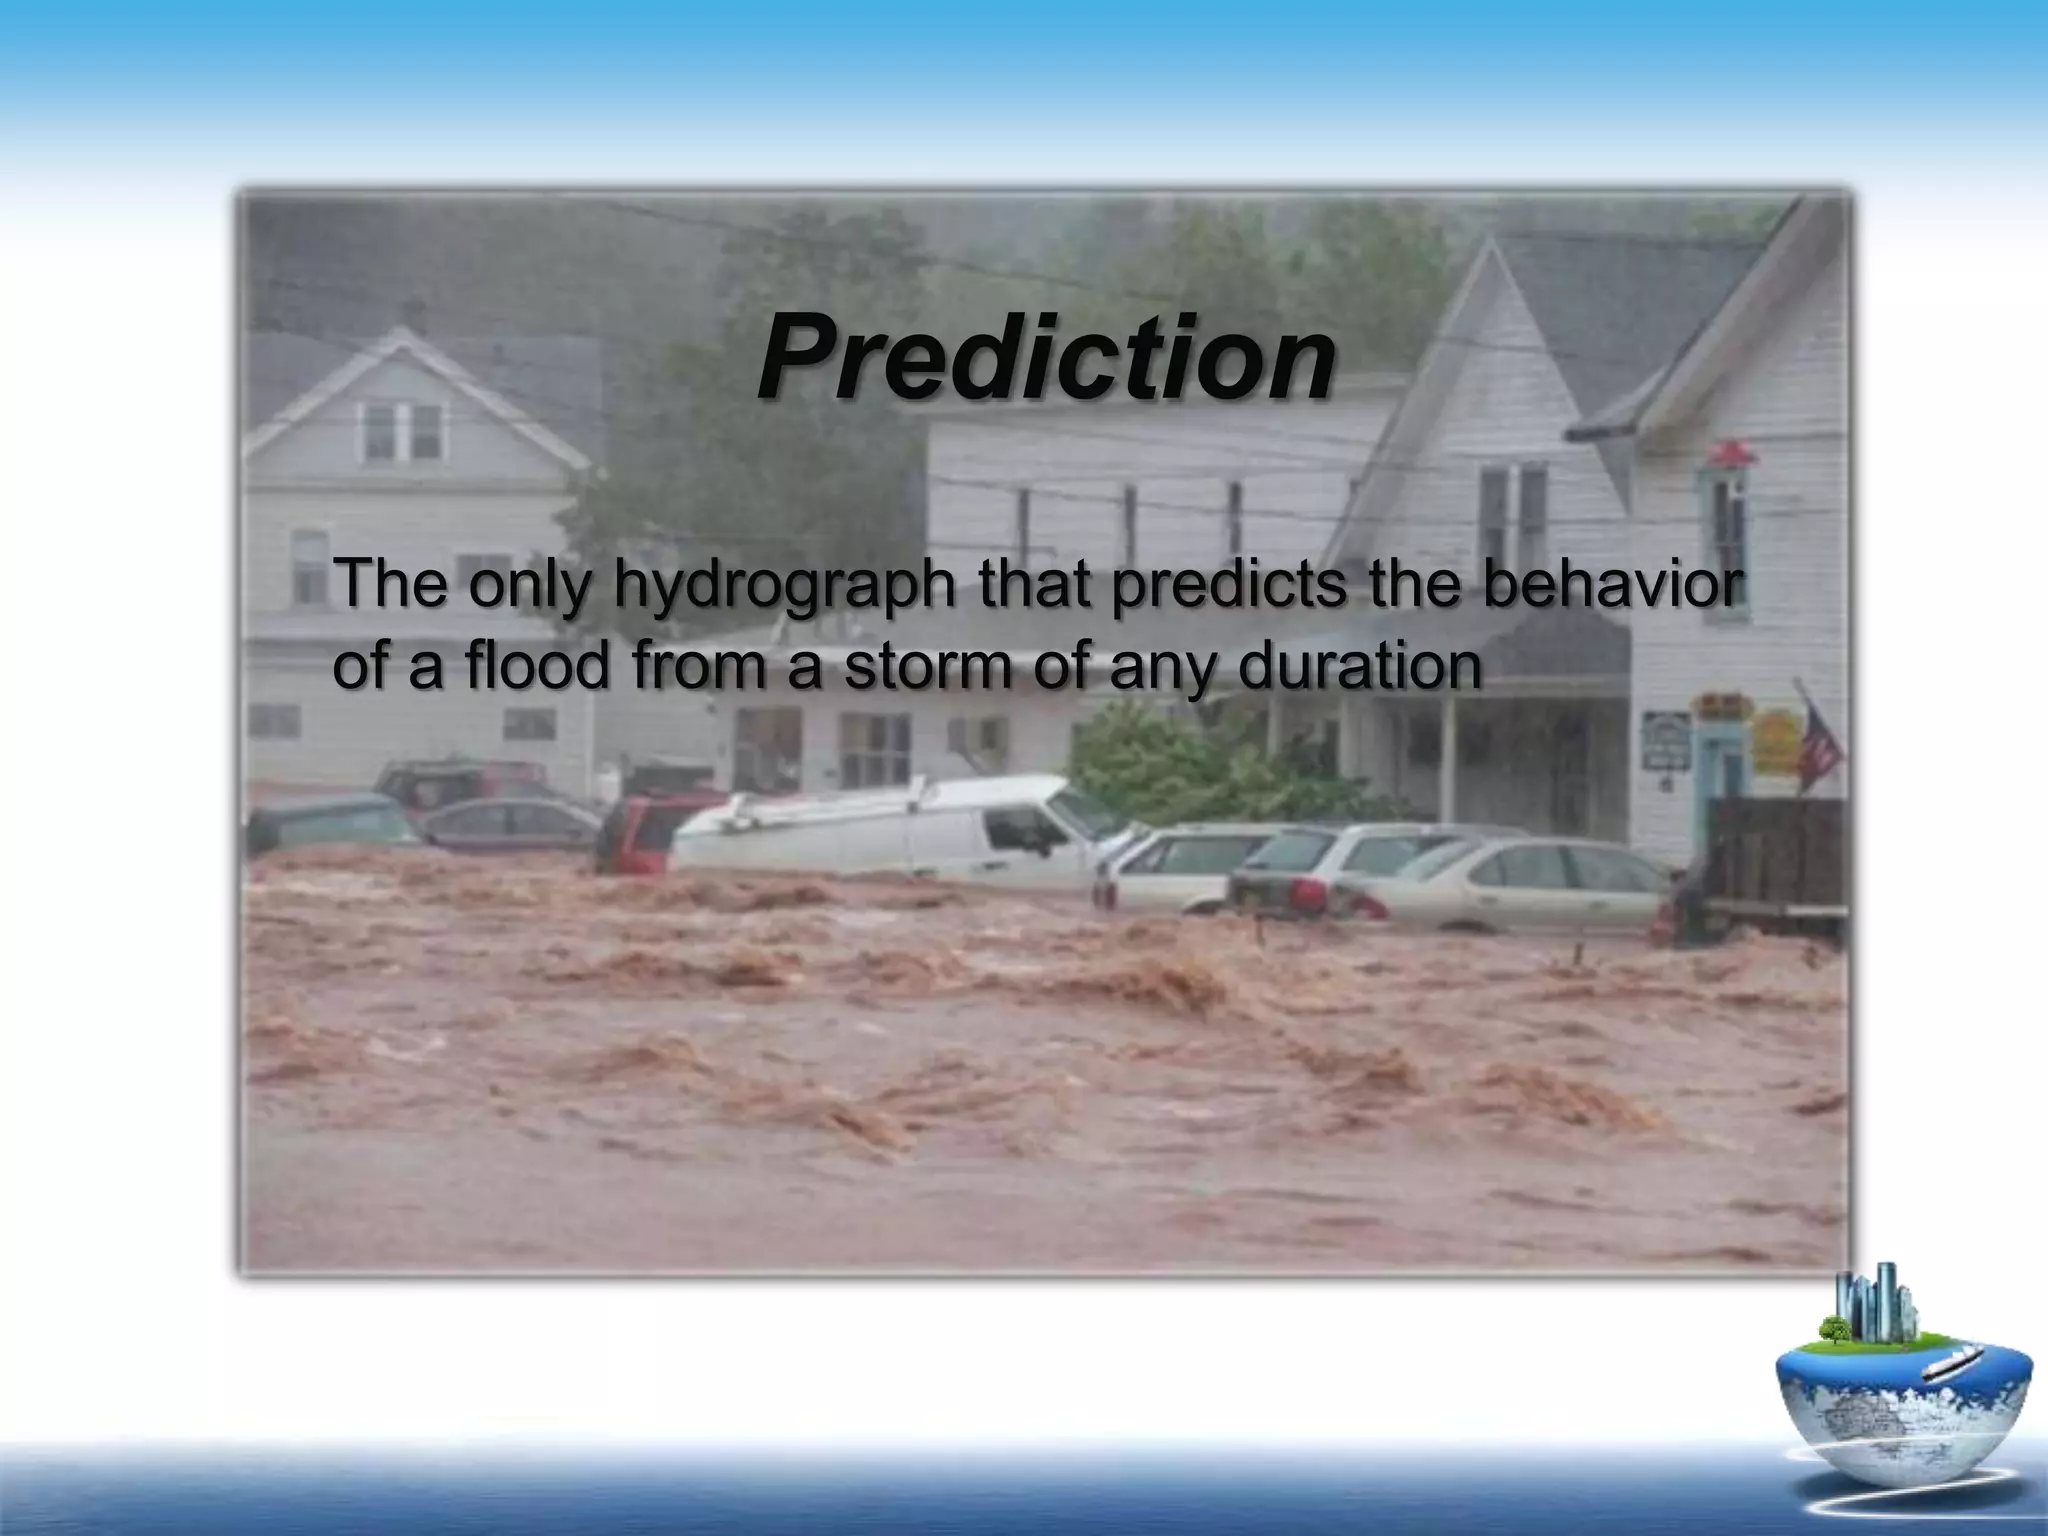
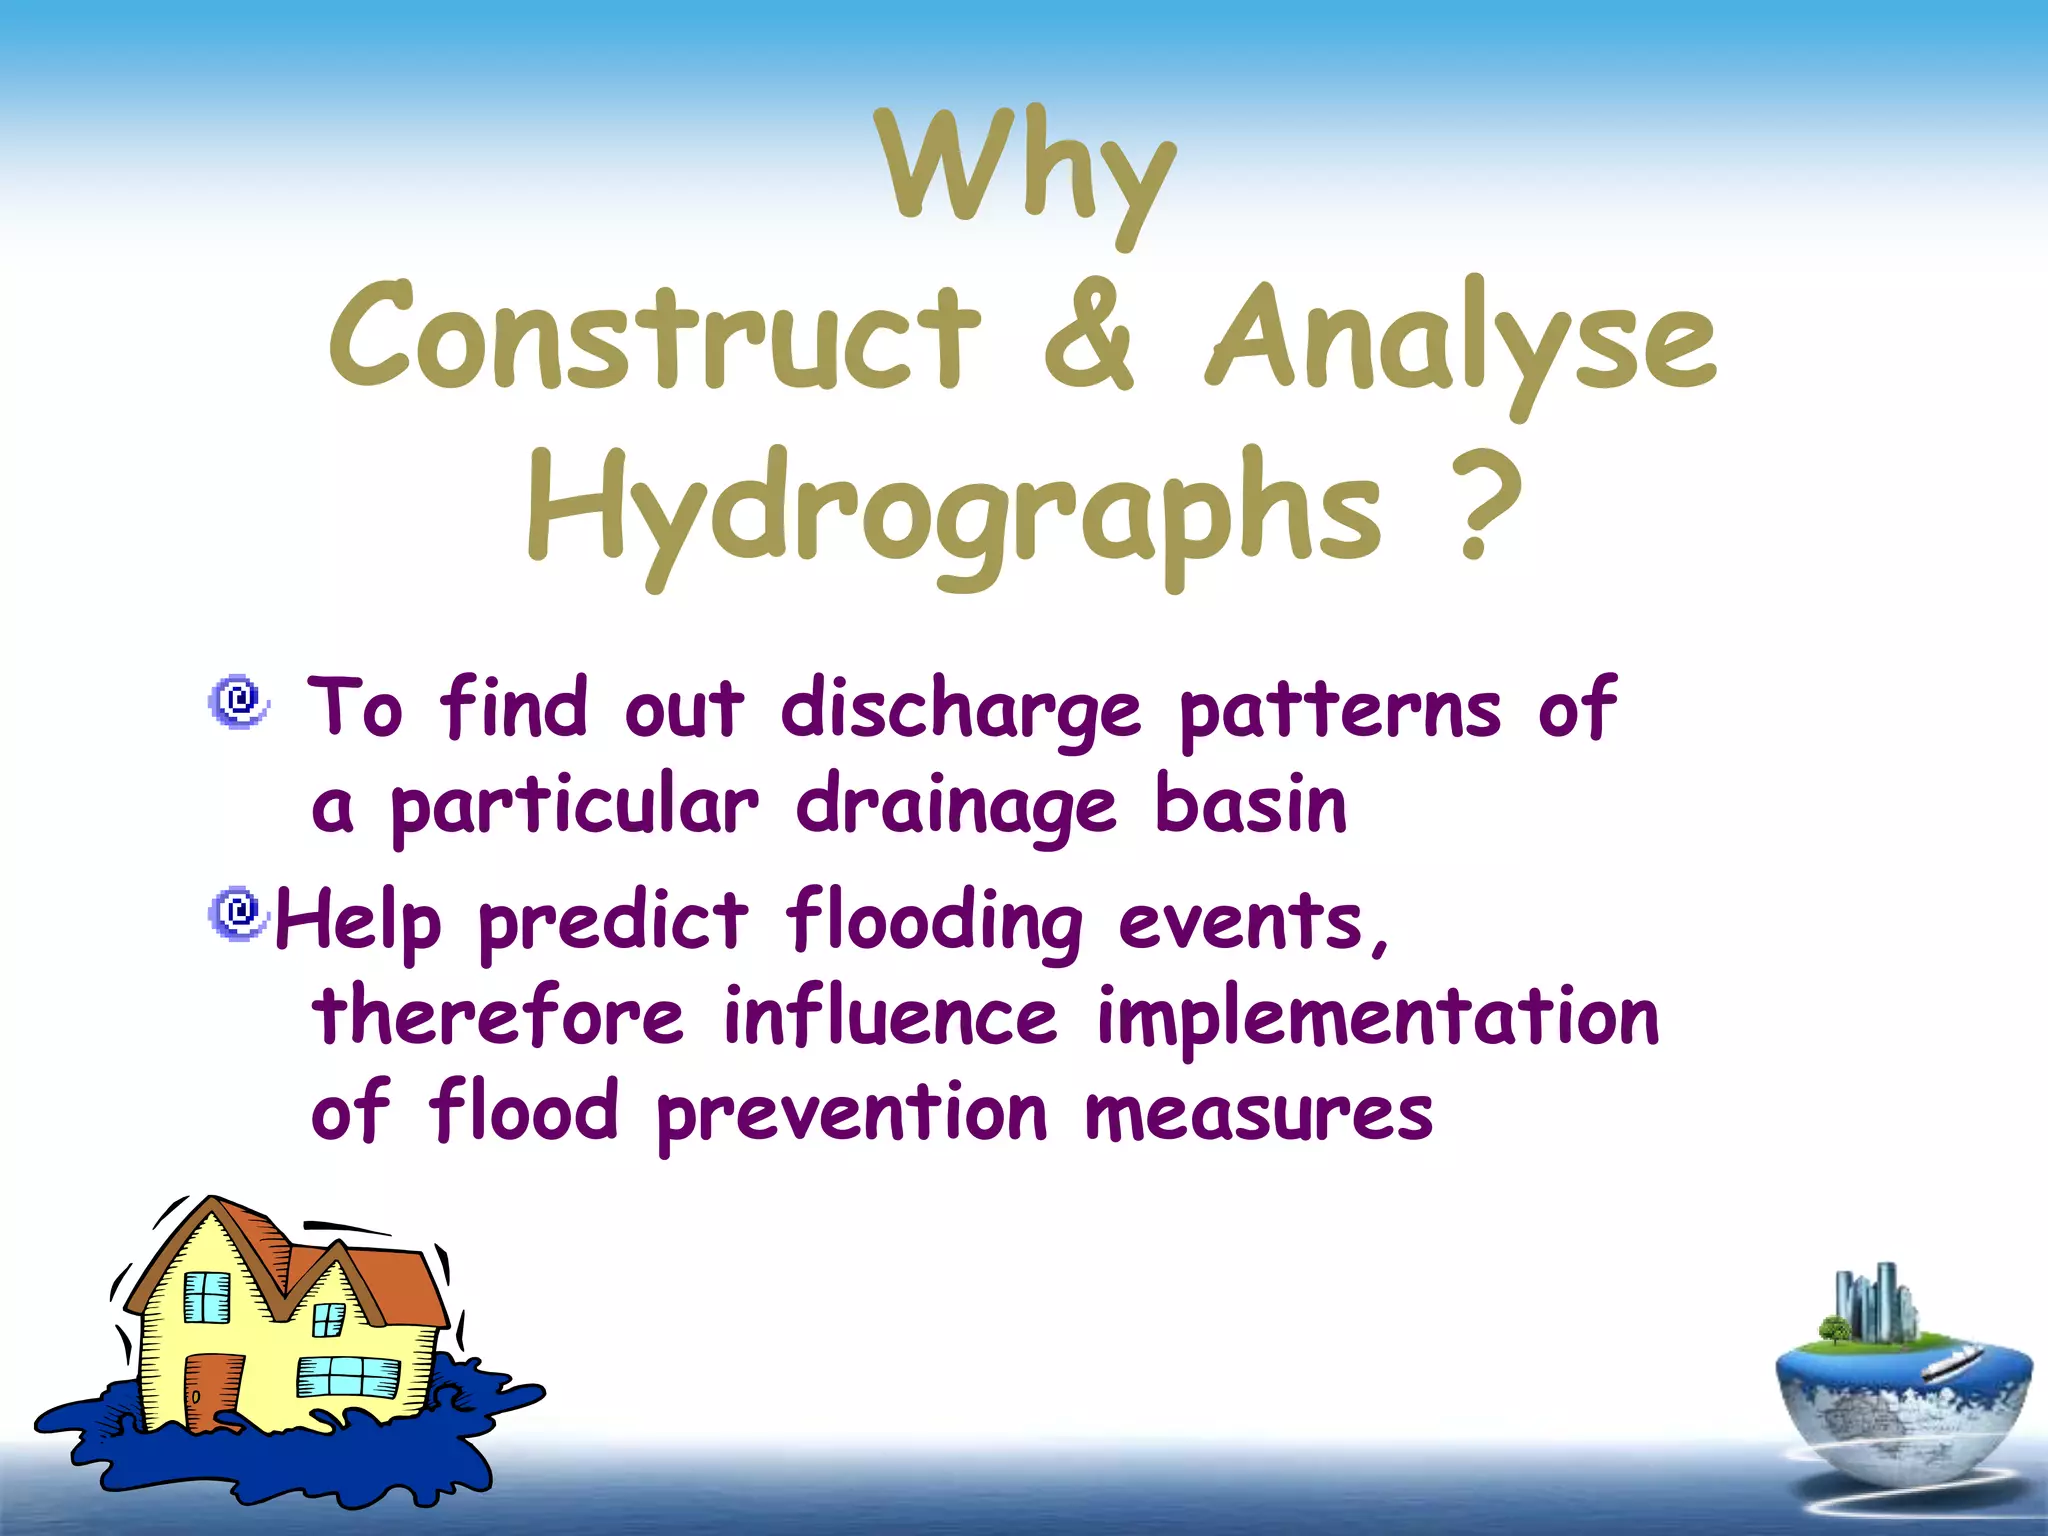
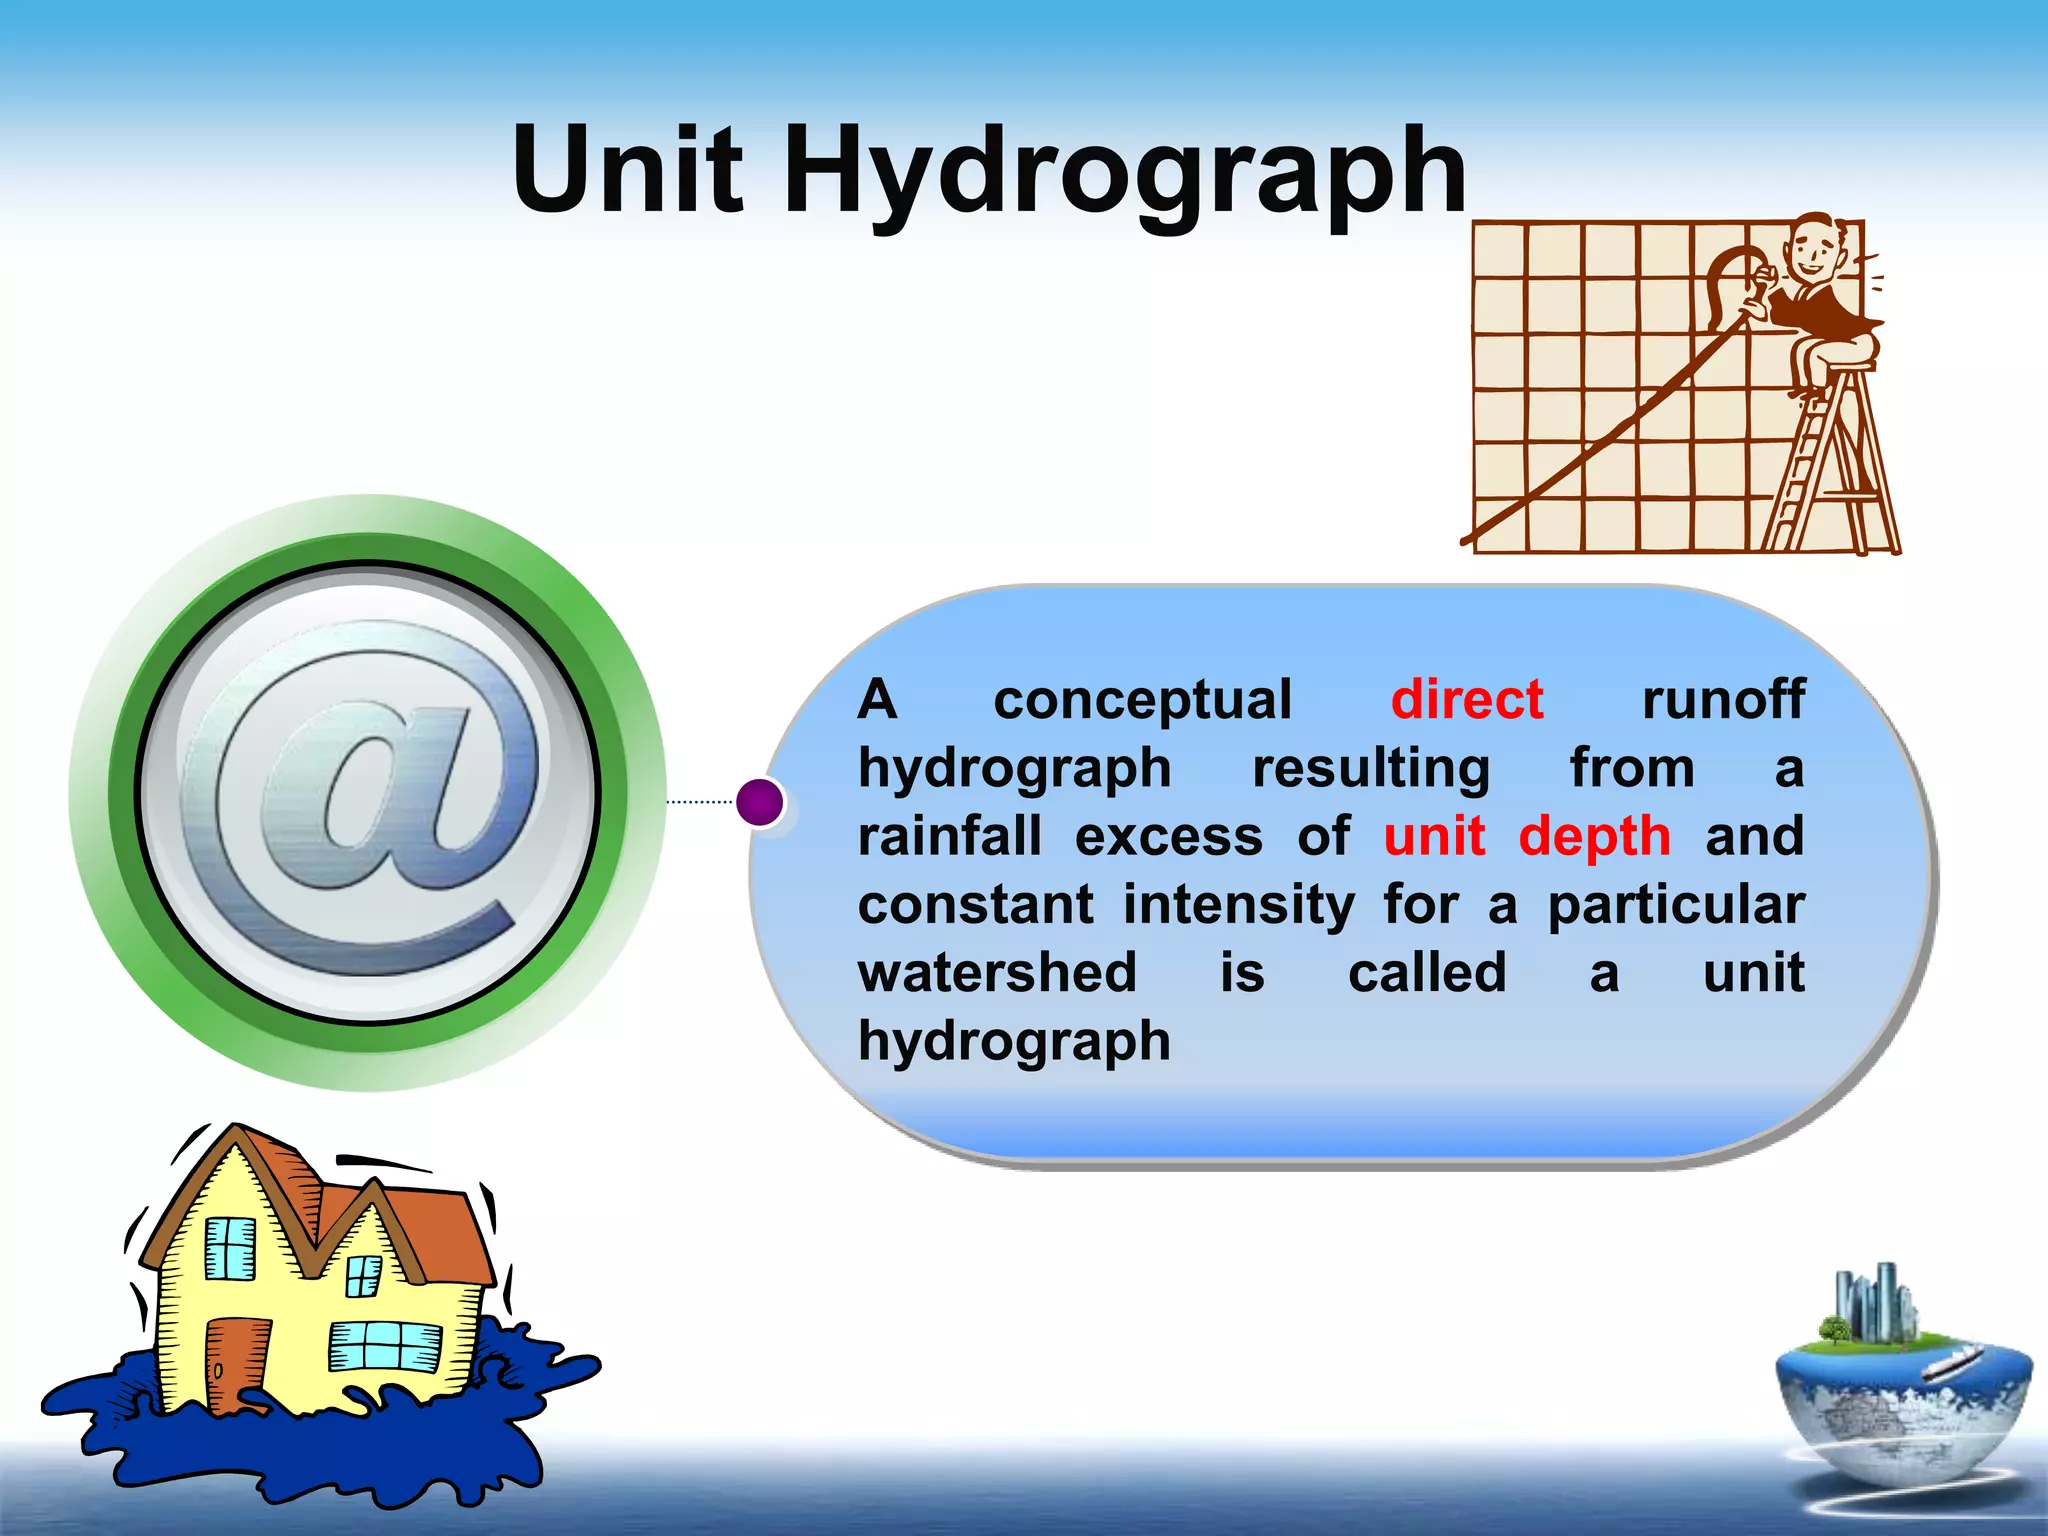
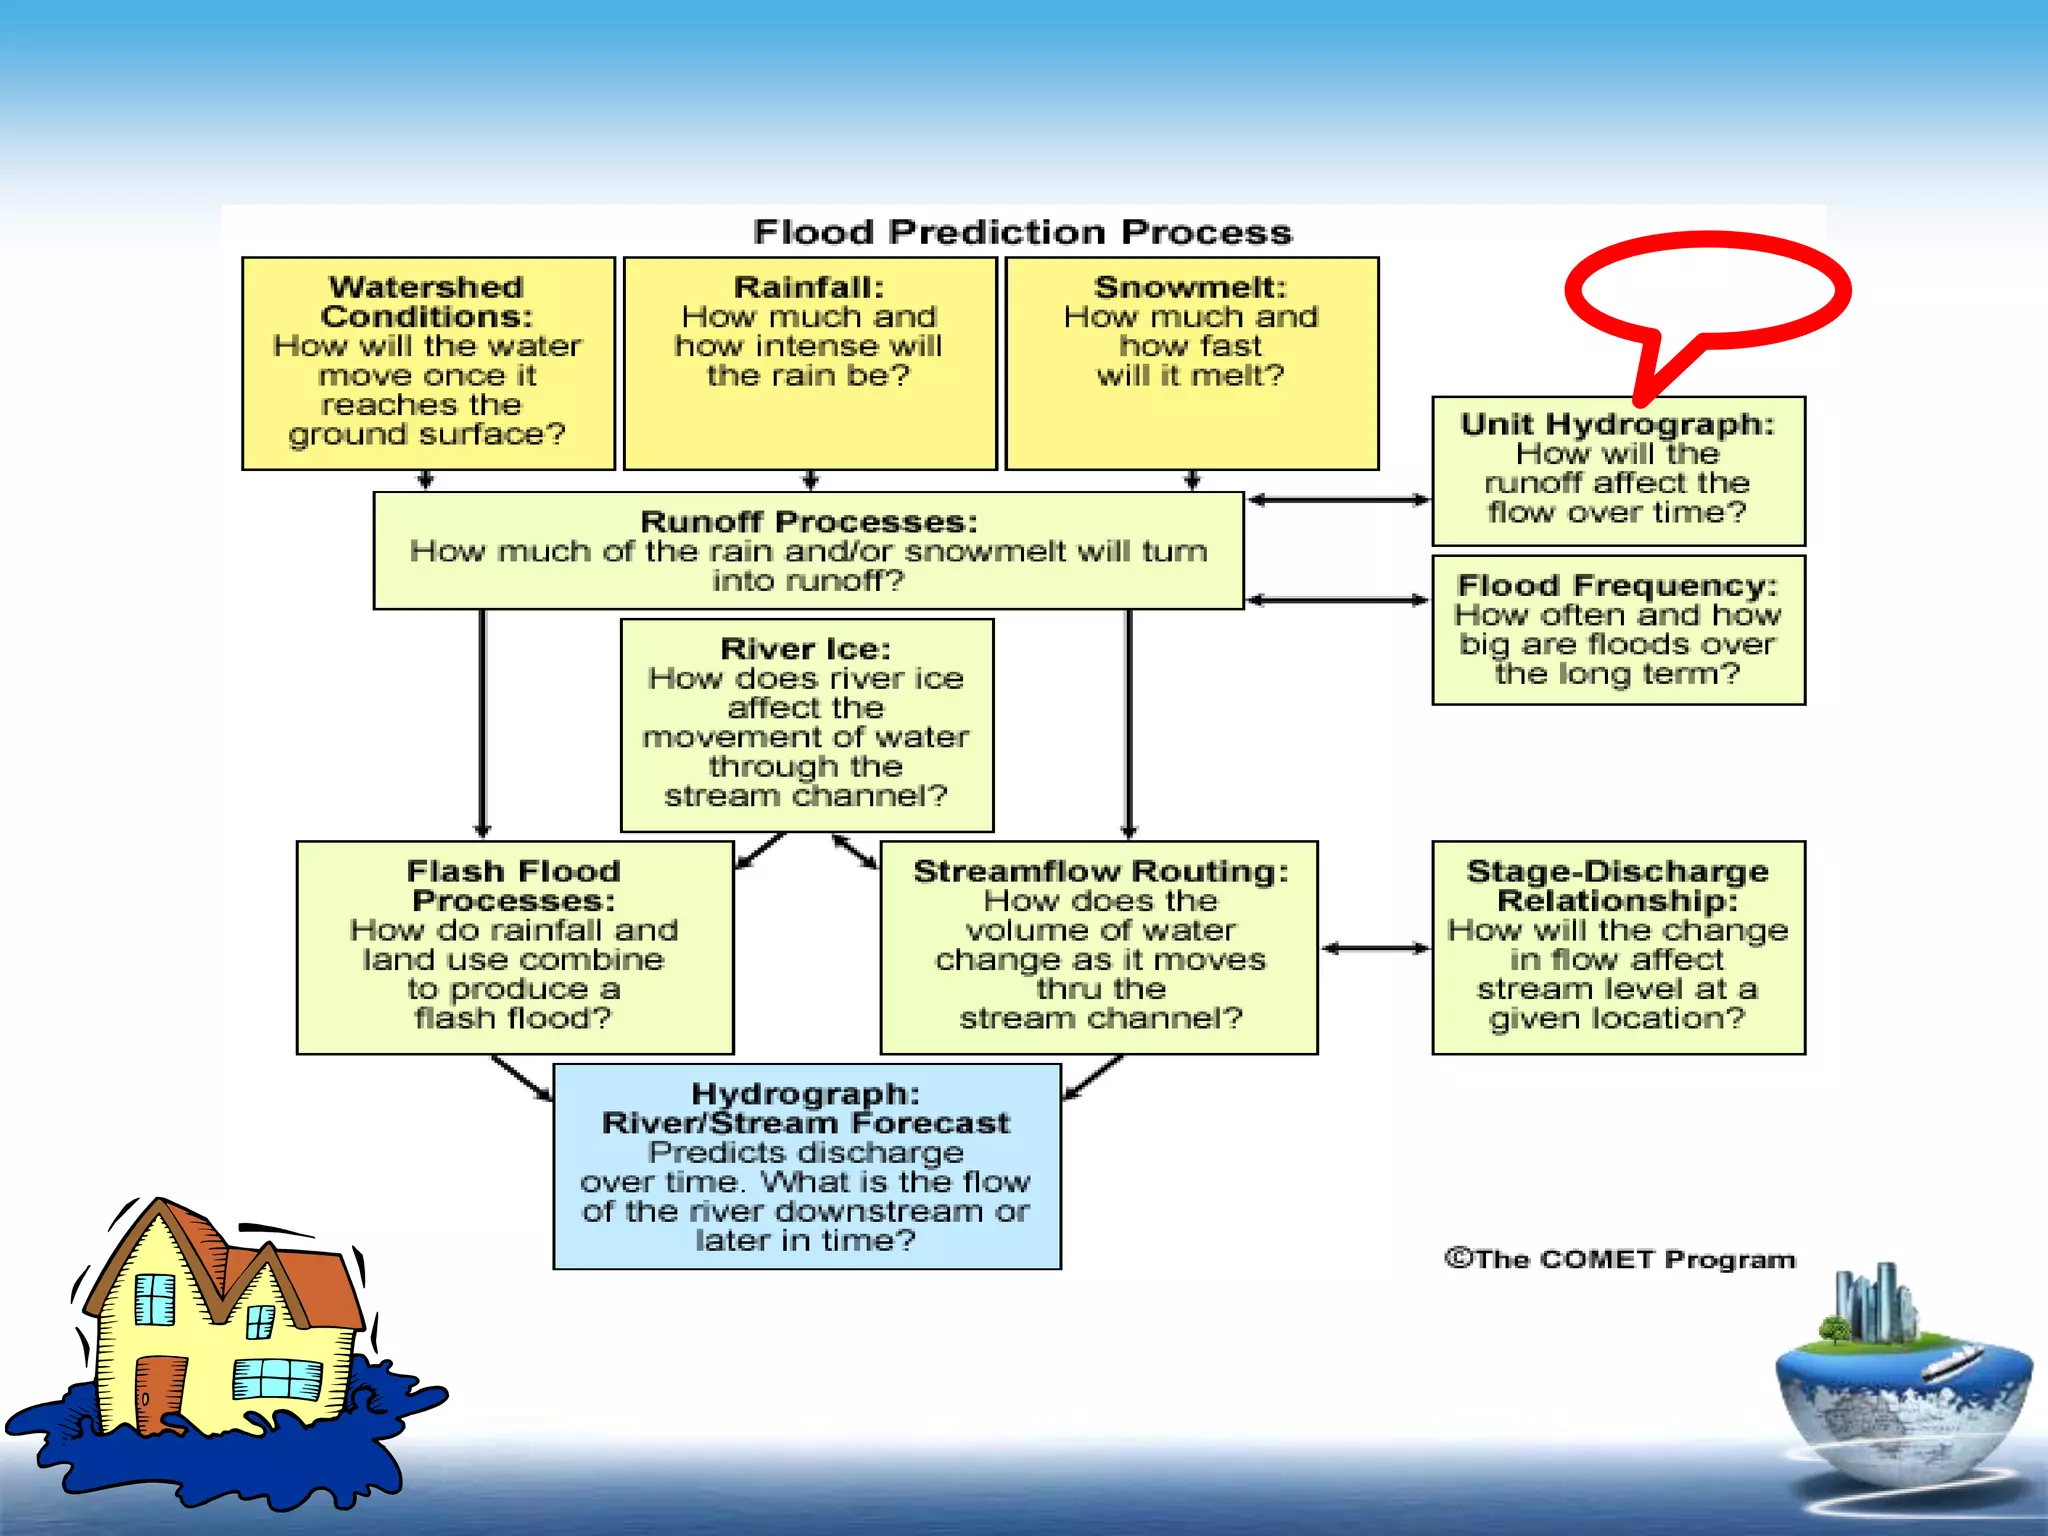
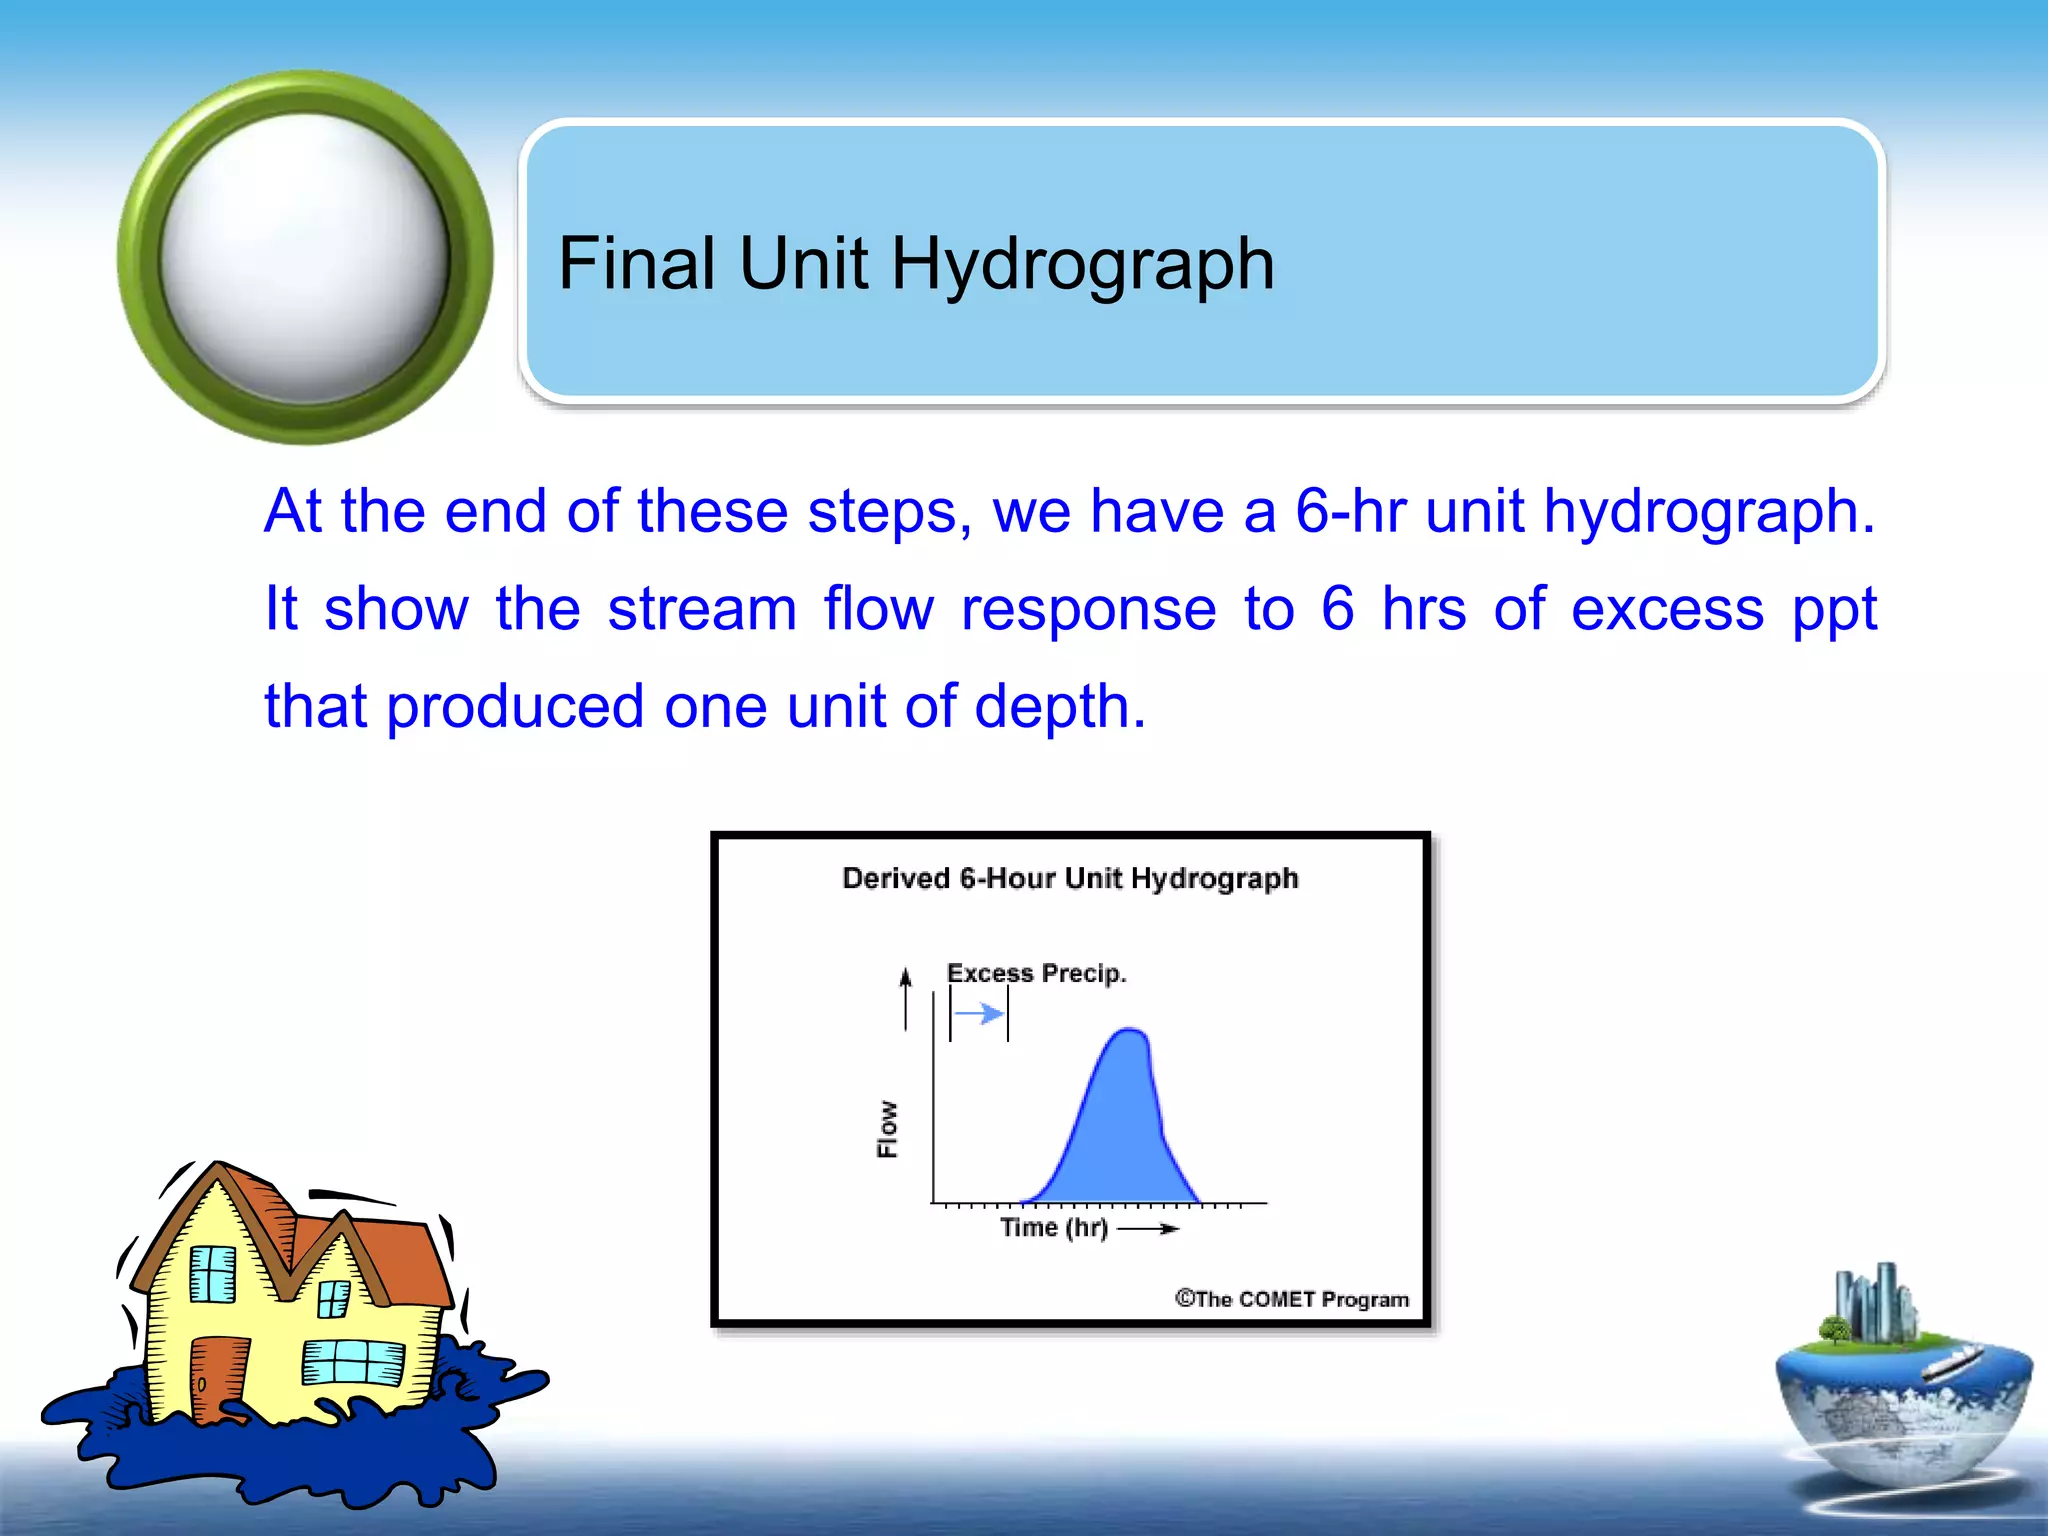
- Defining a unit hydrograph and explaining its use in predicting streamflow from rainfall amounts.
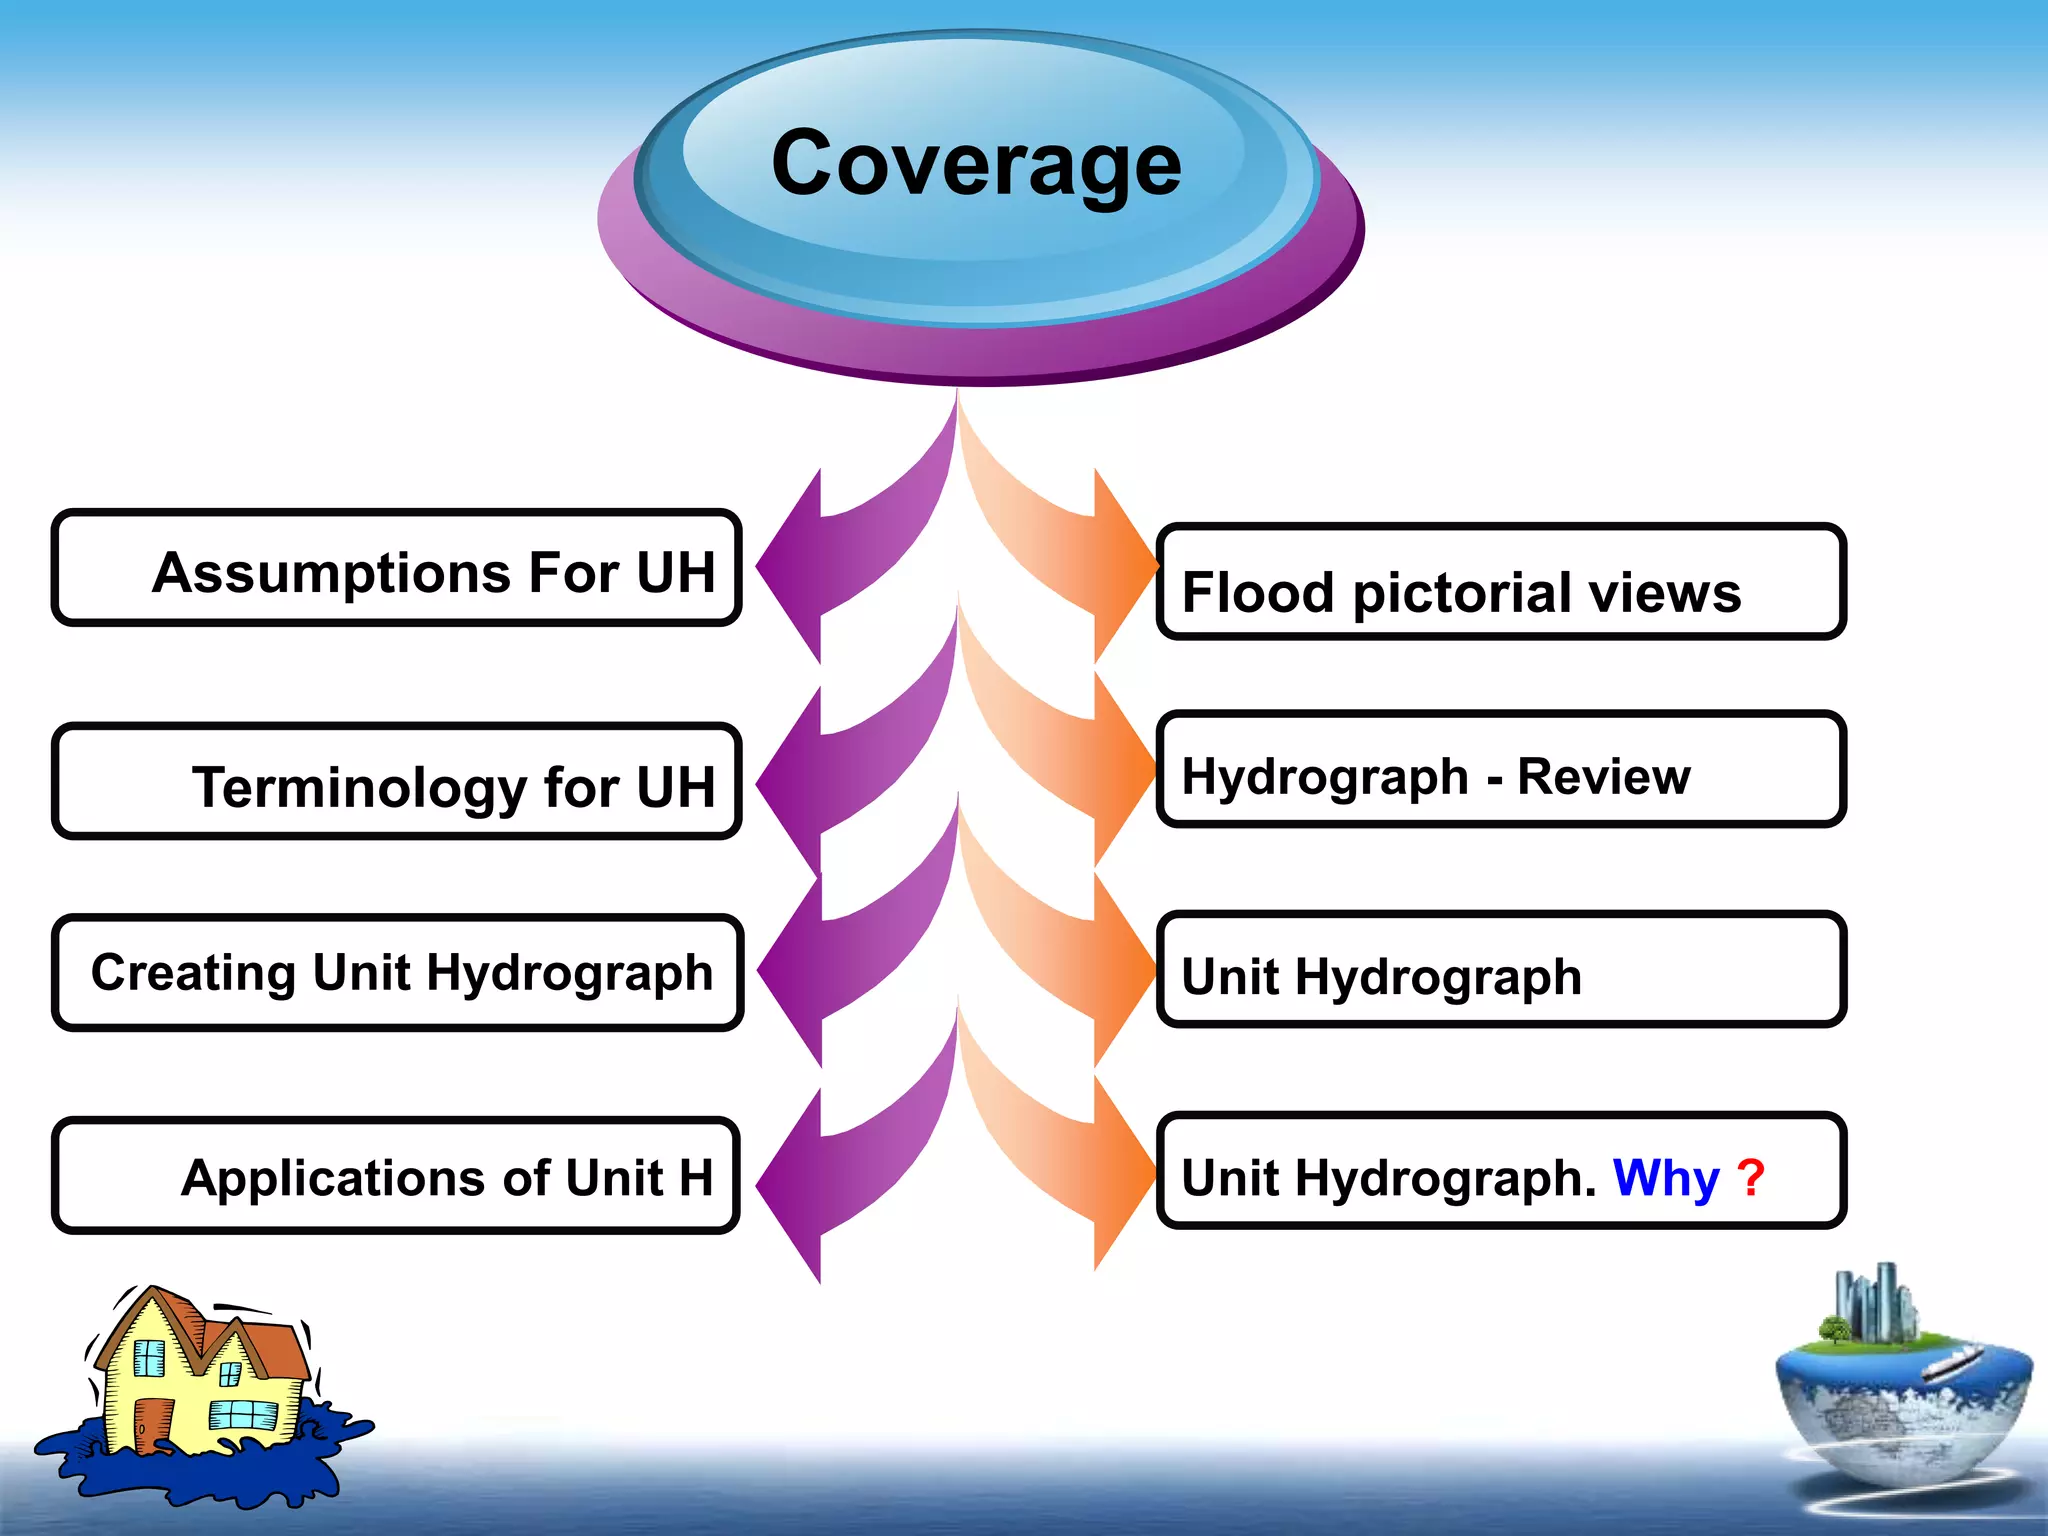
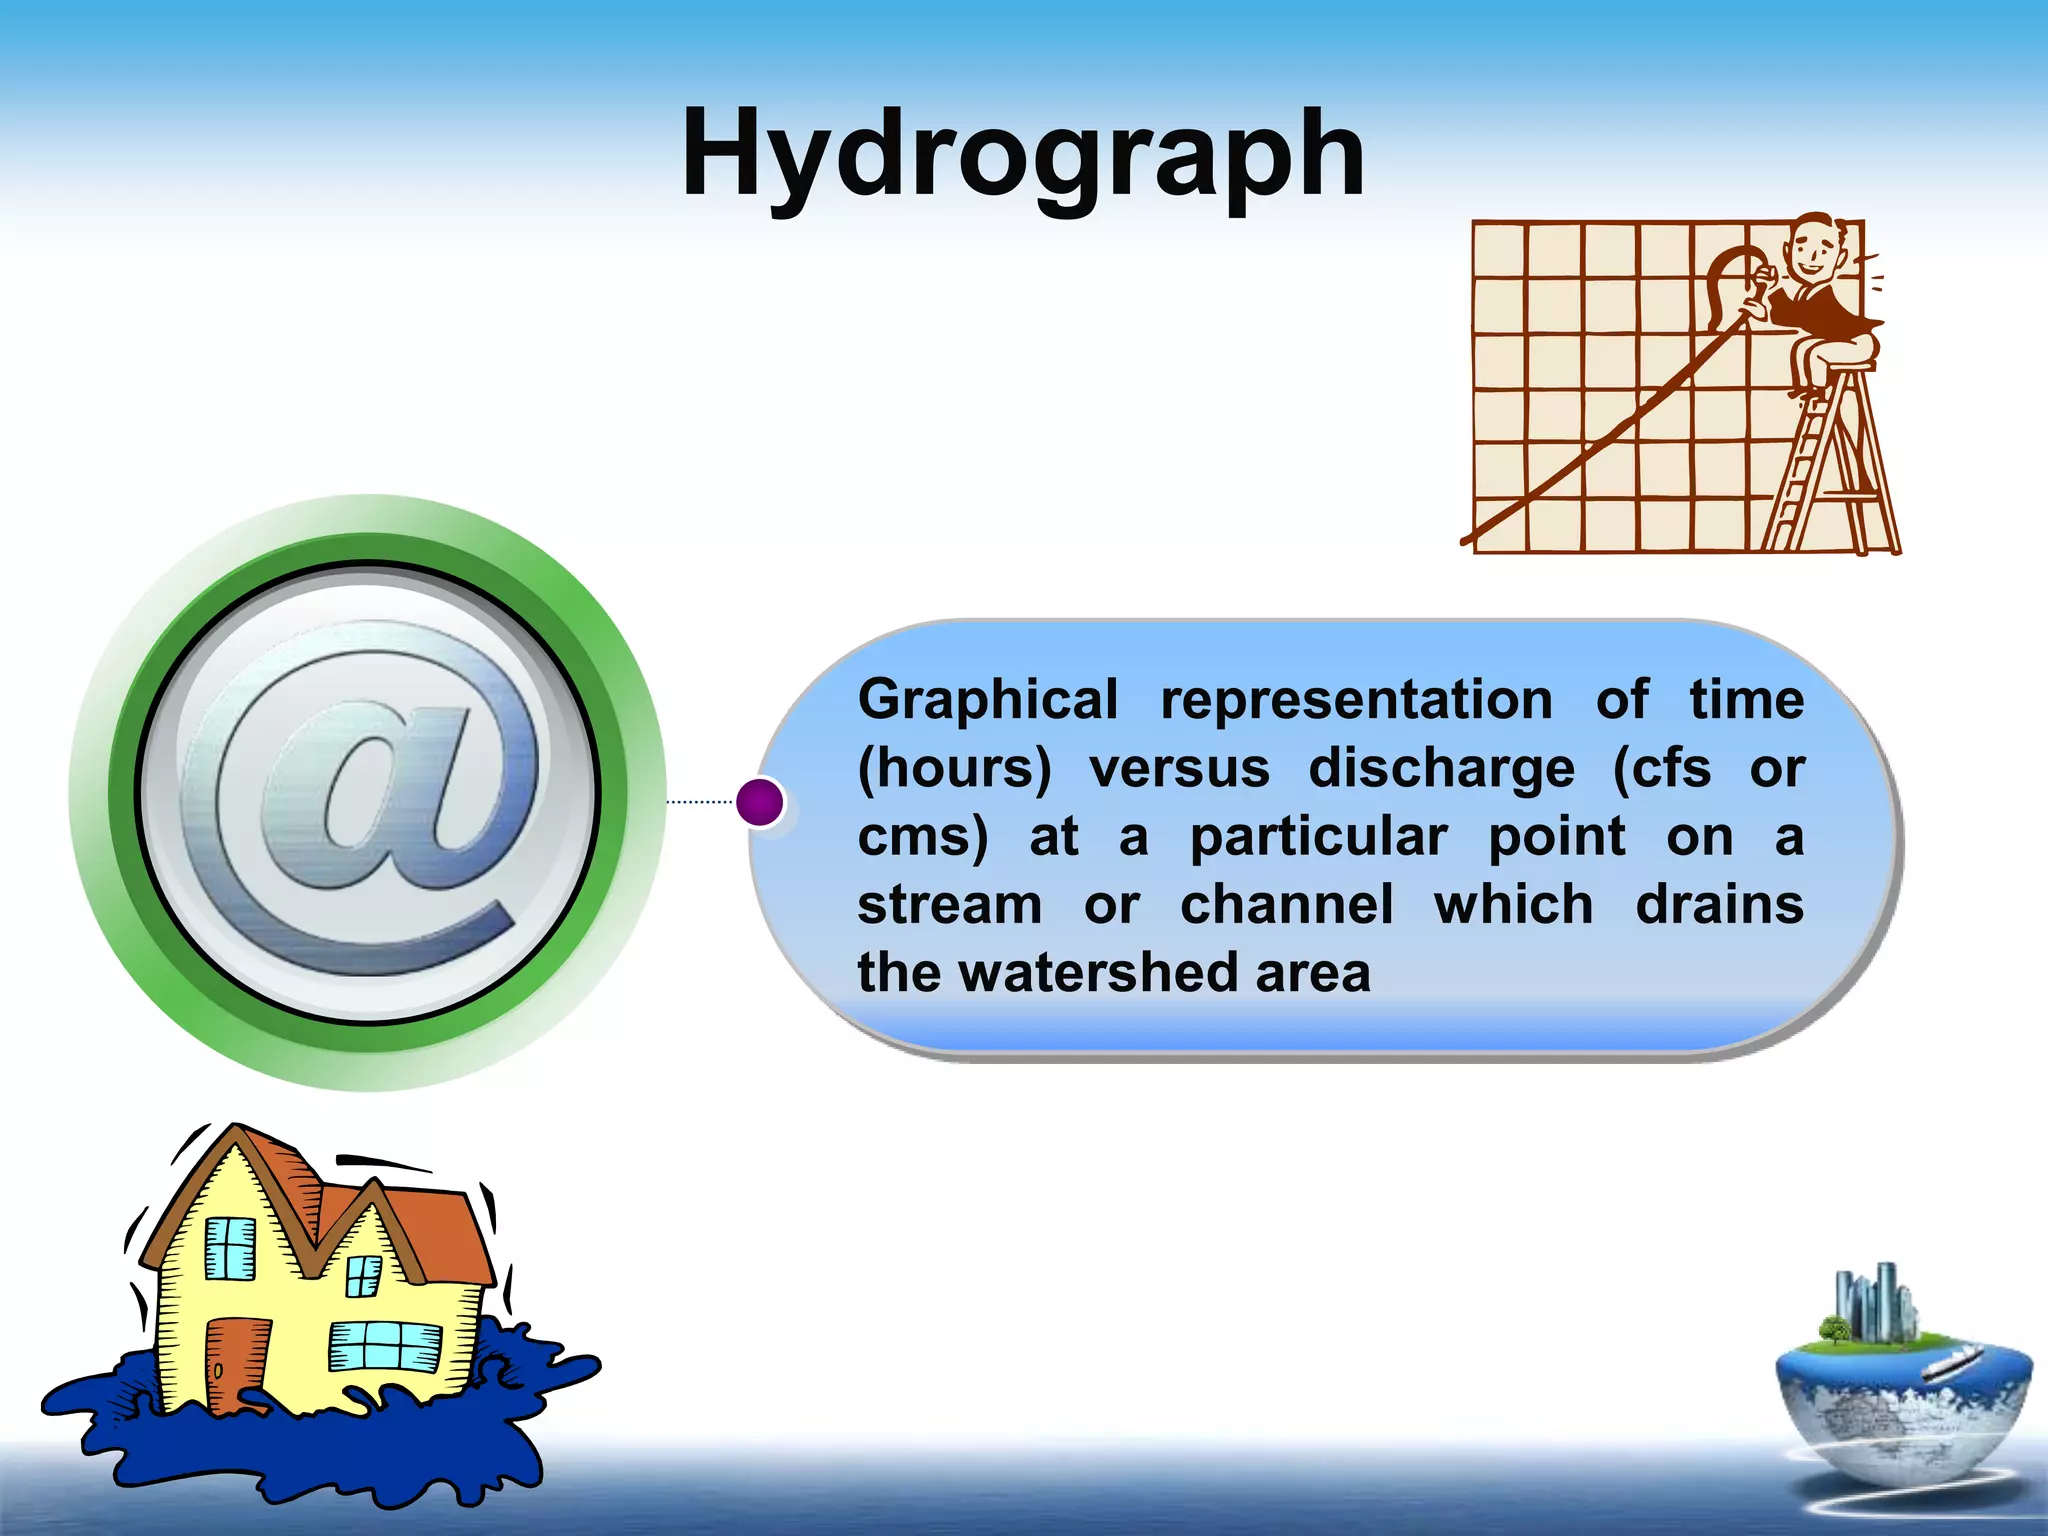
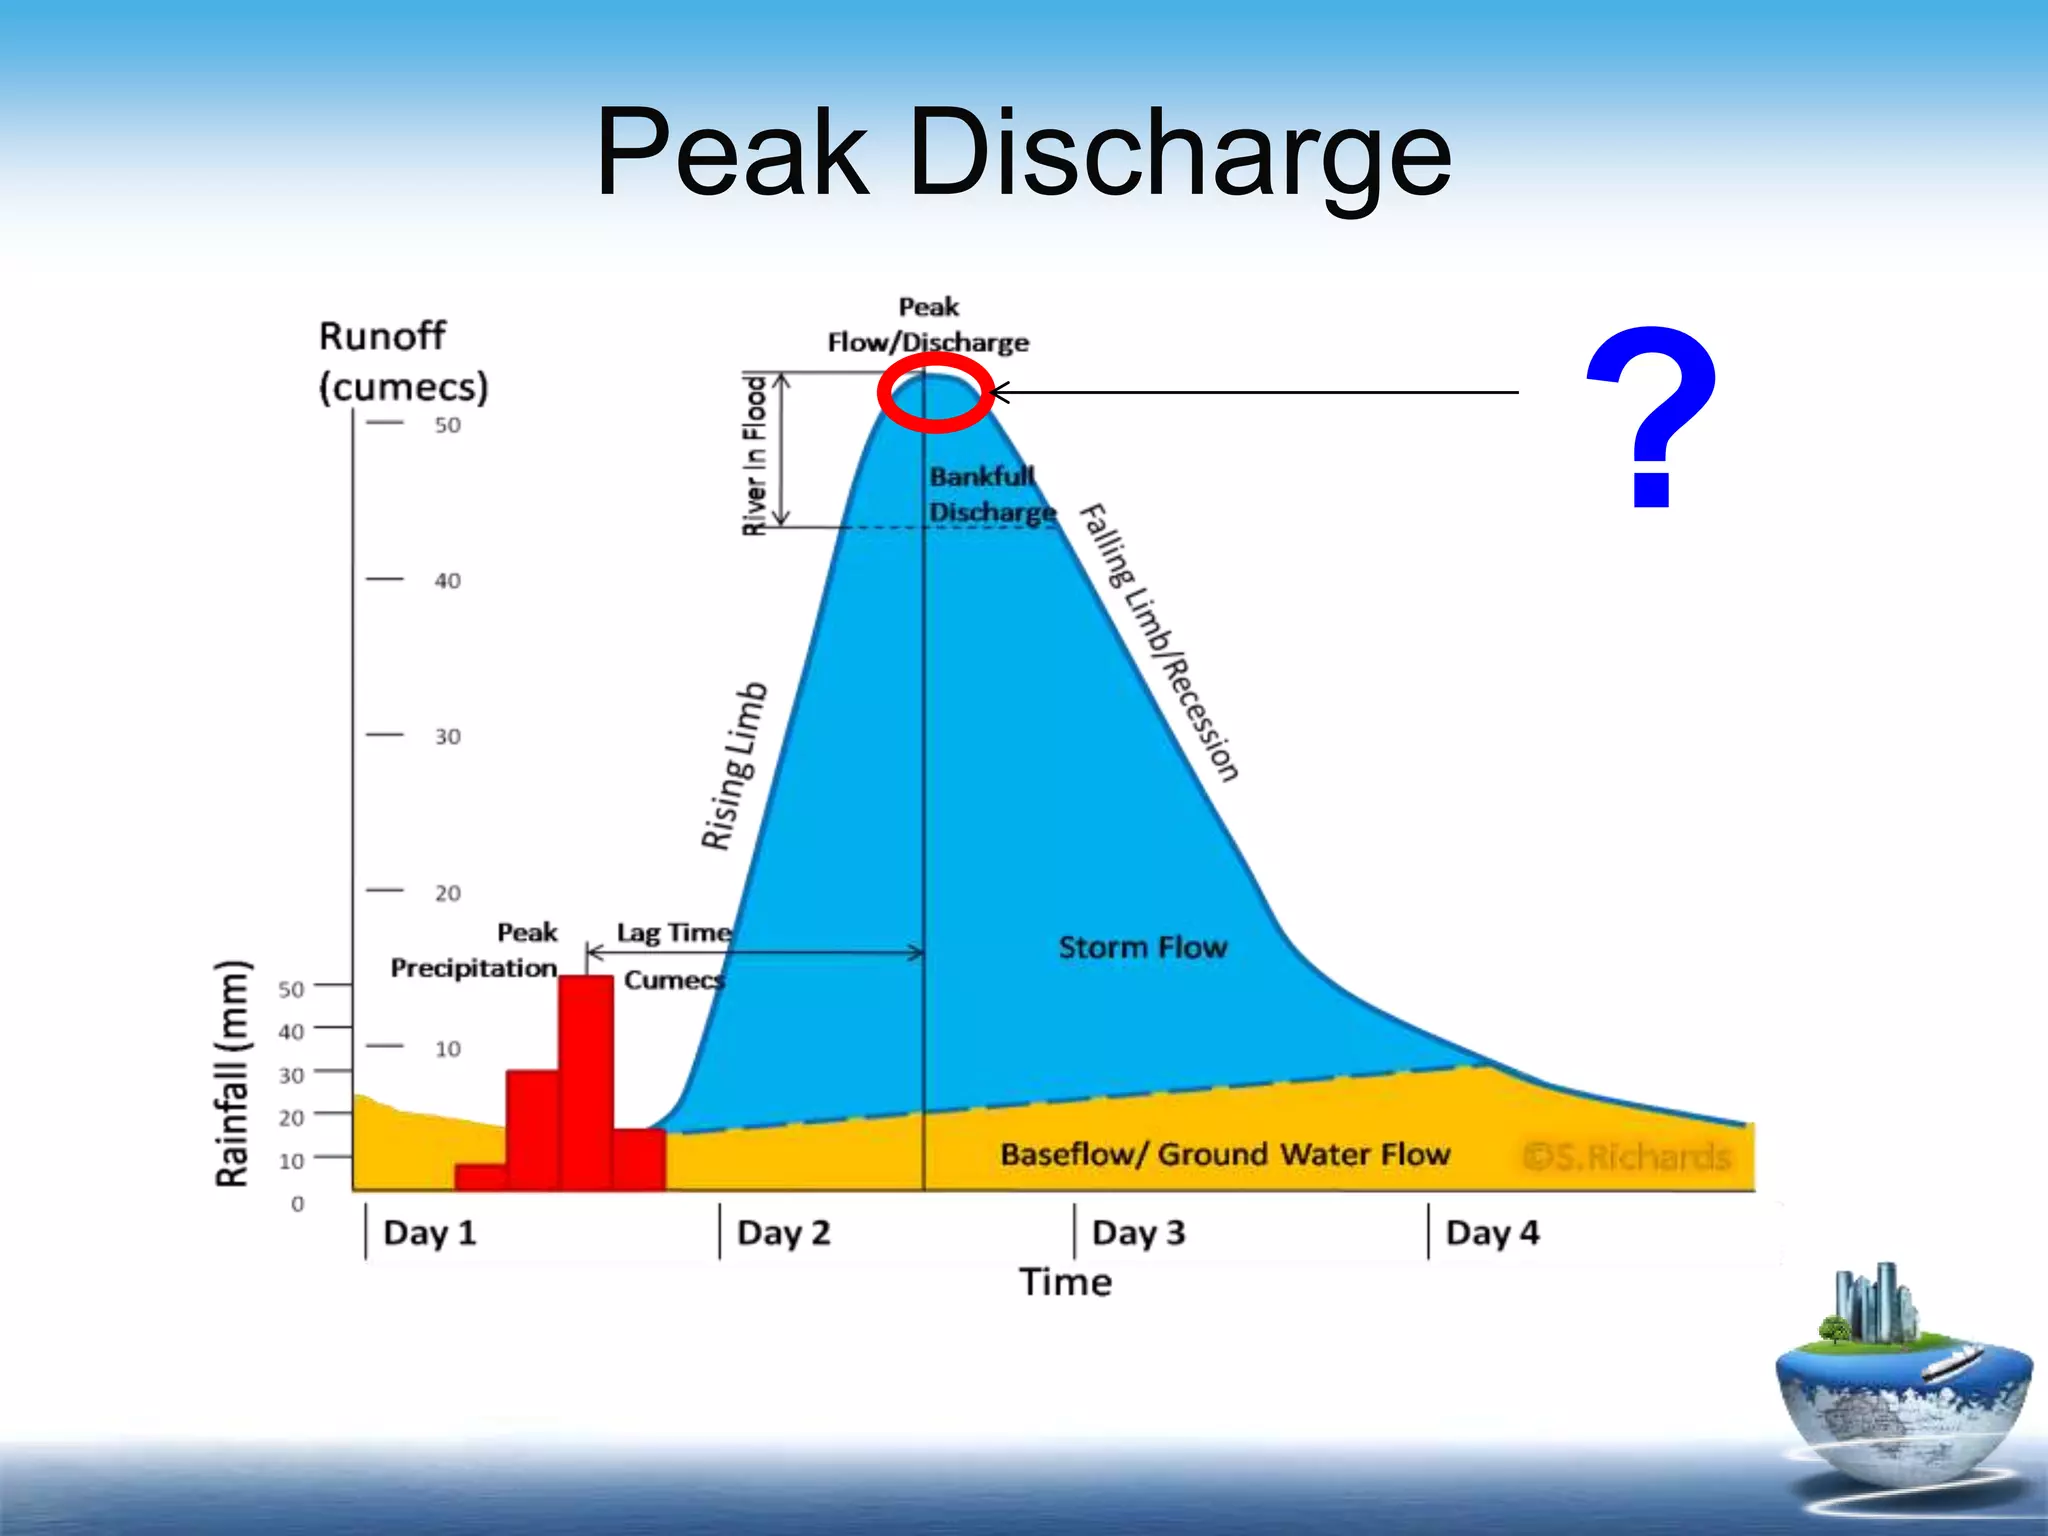
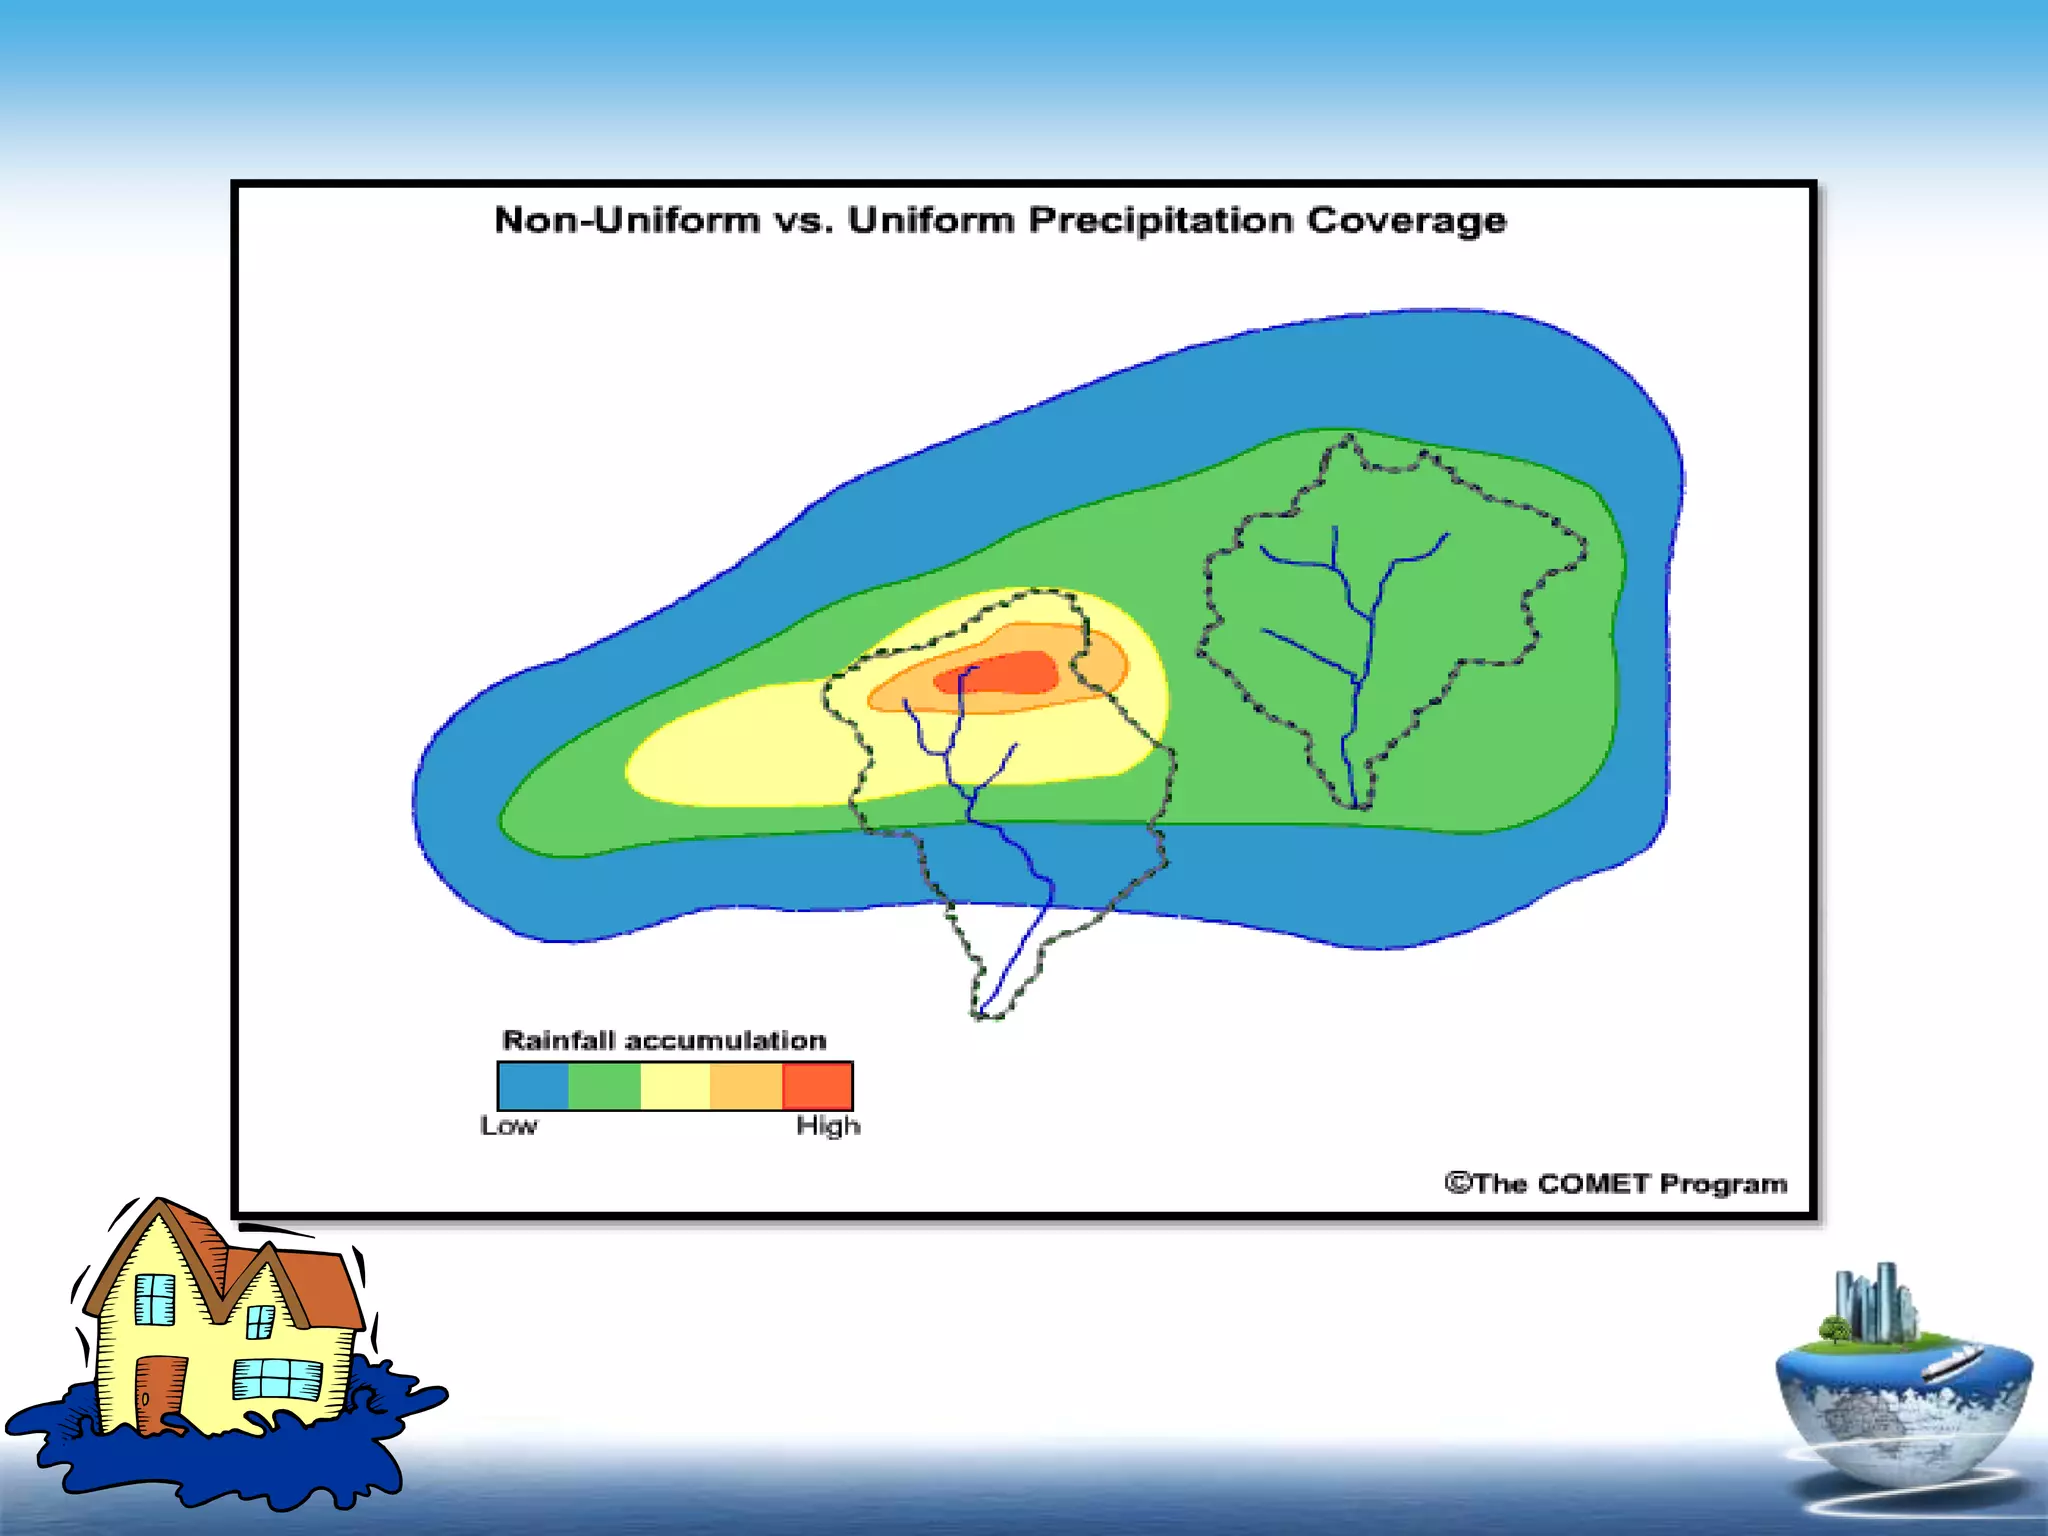
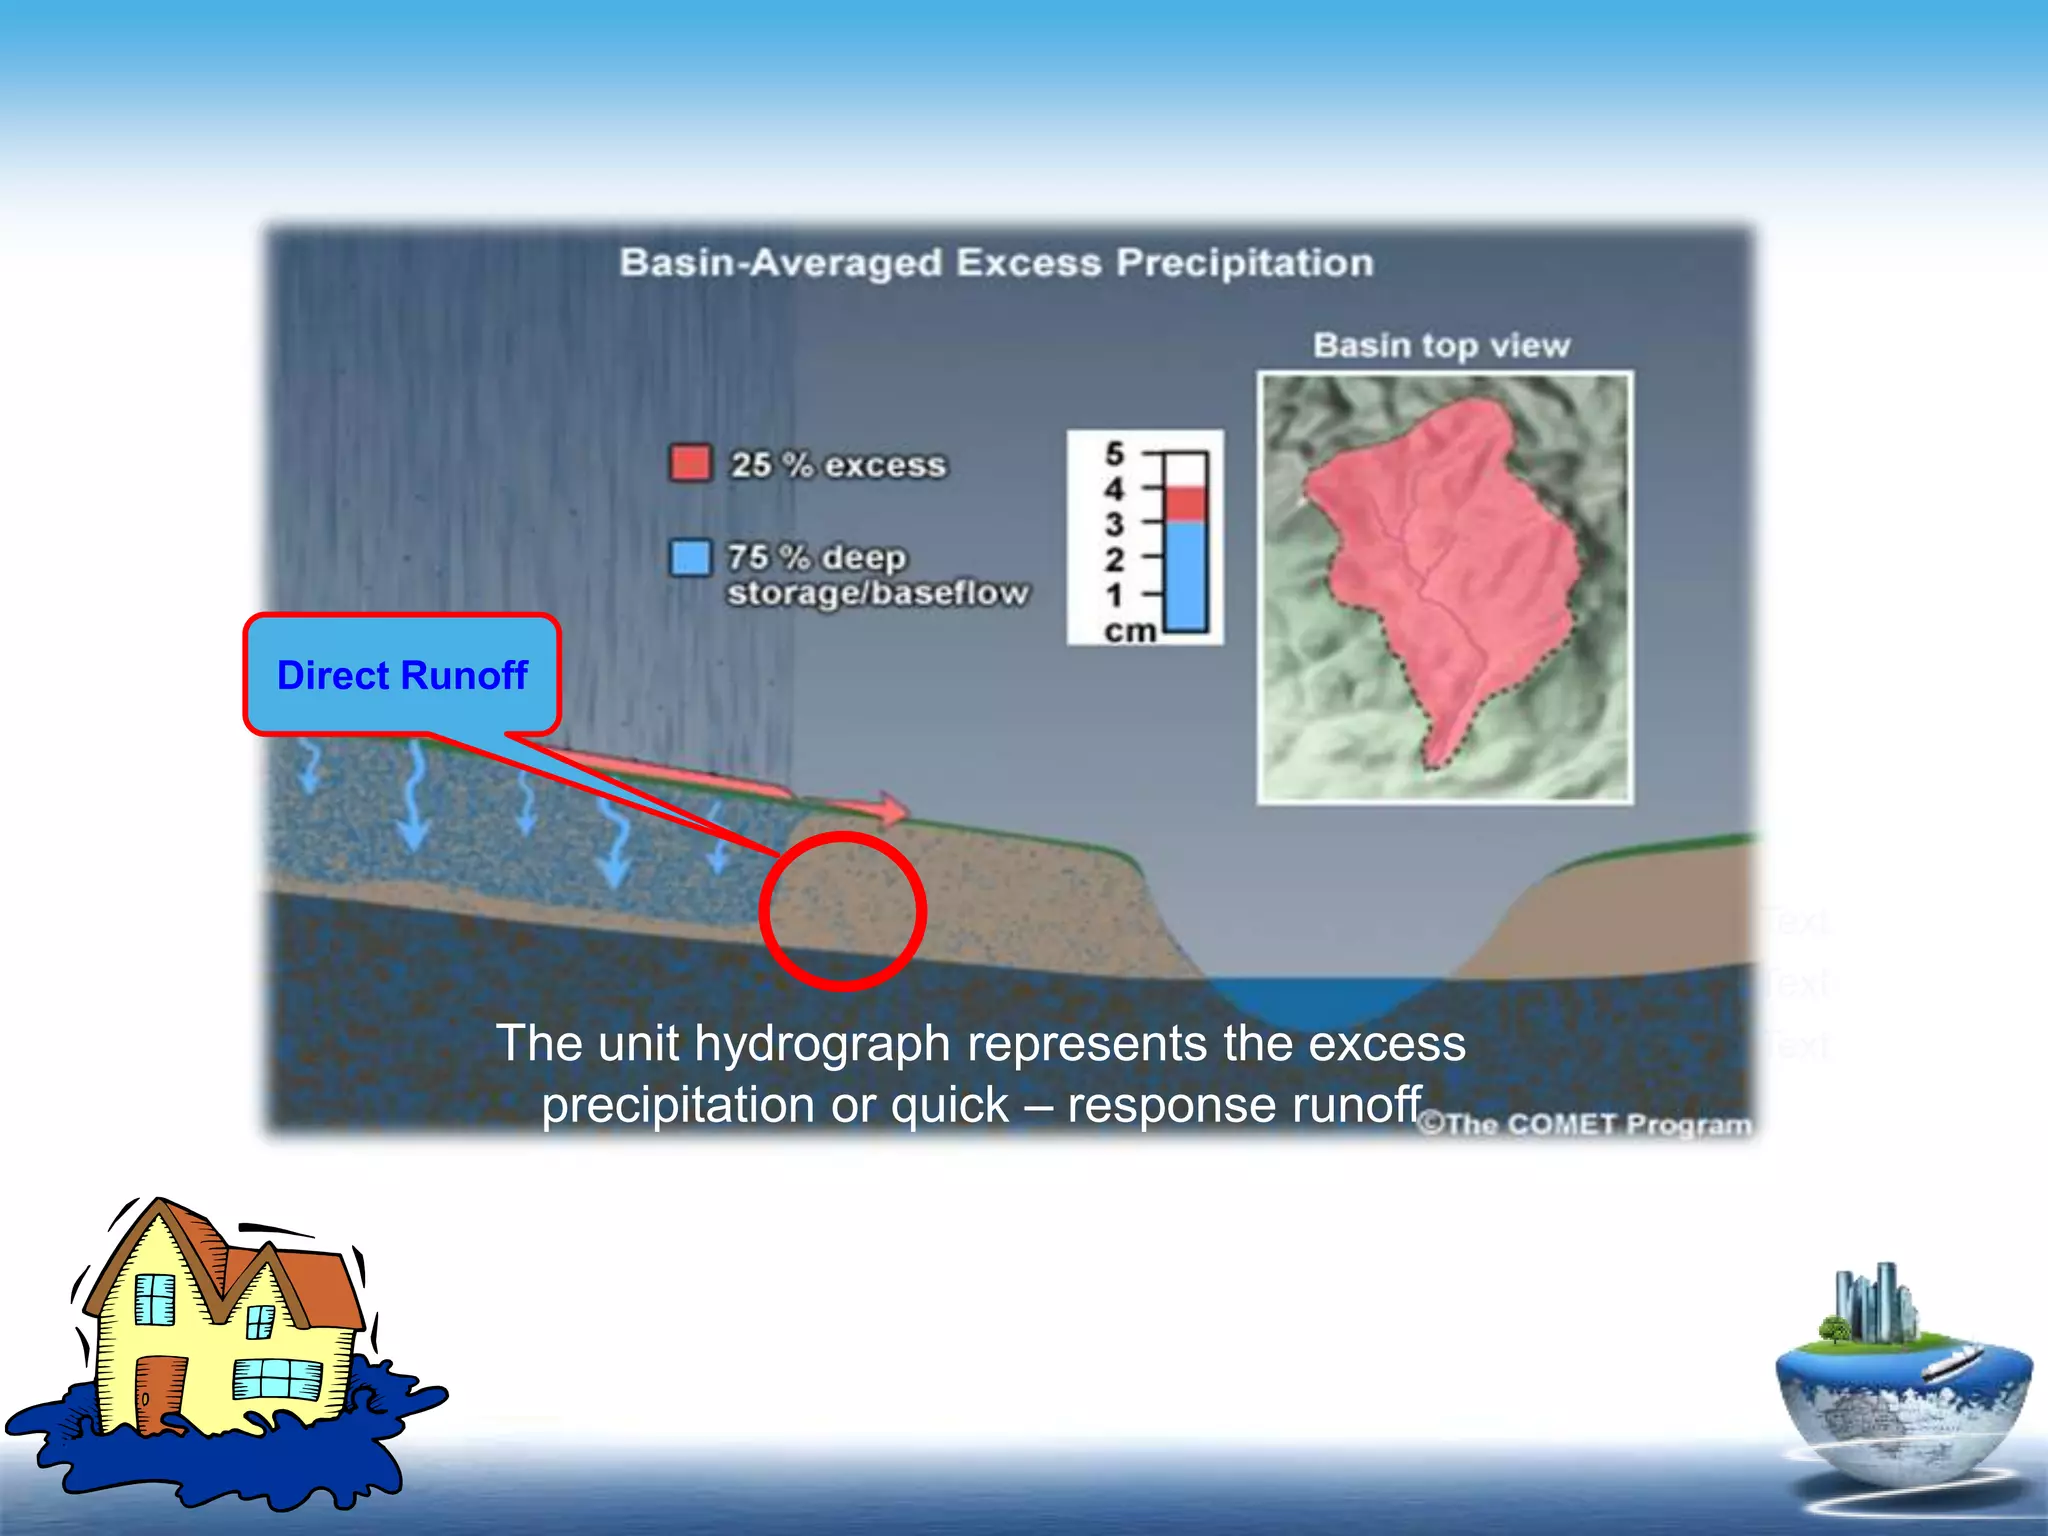
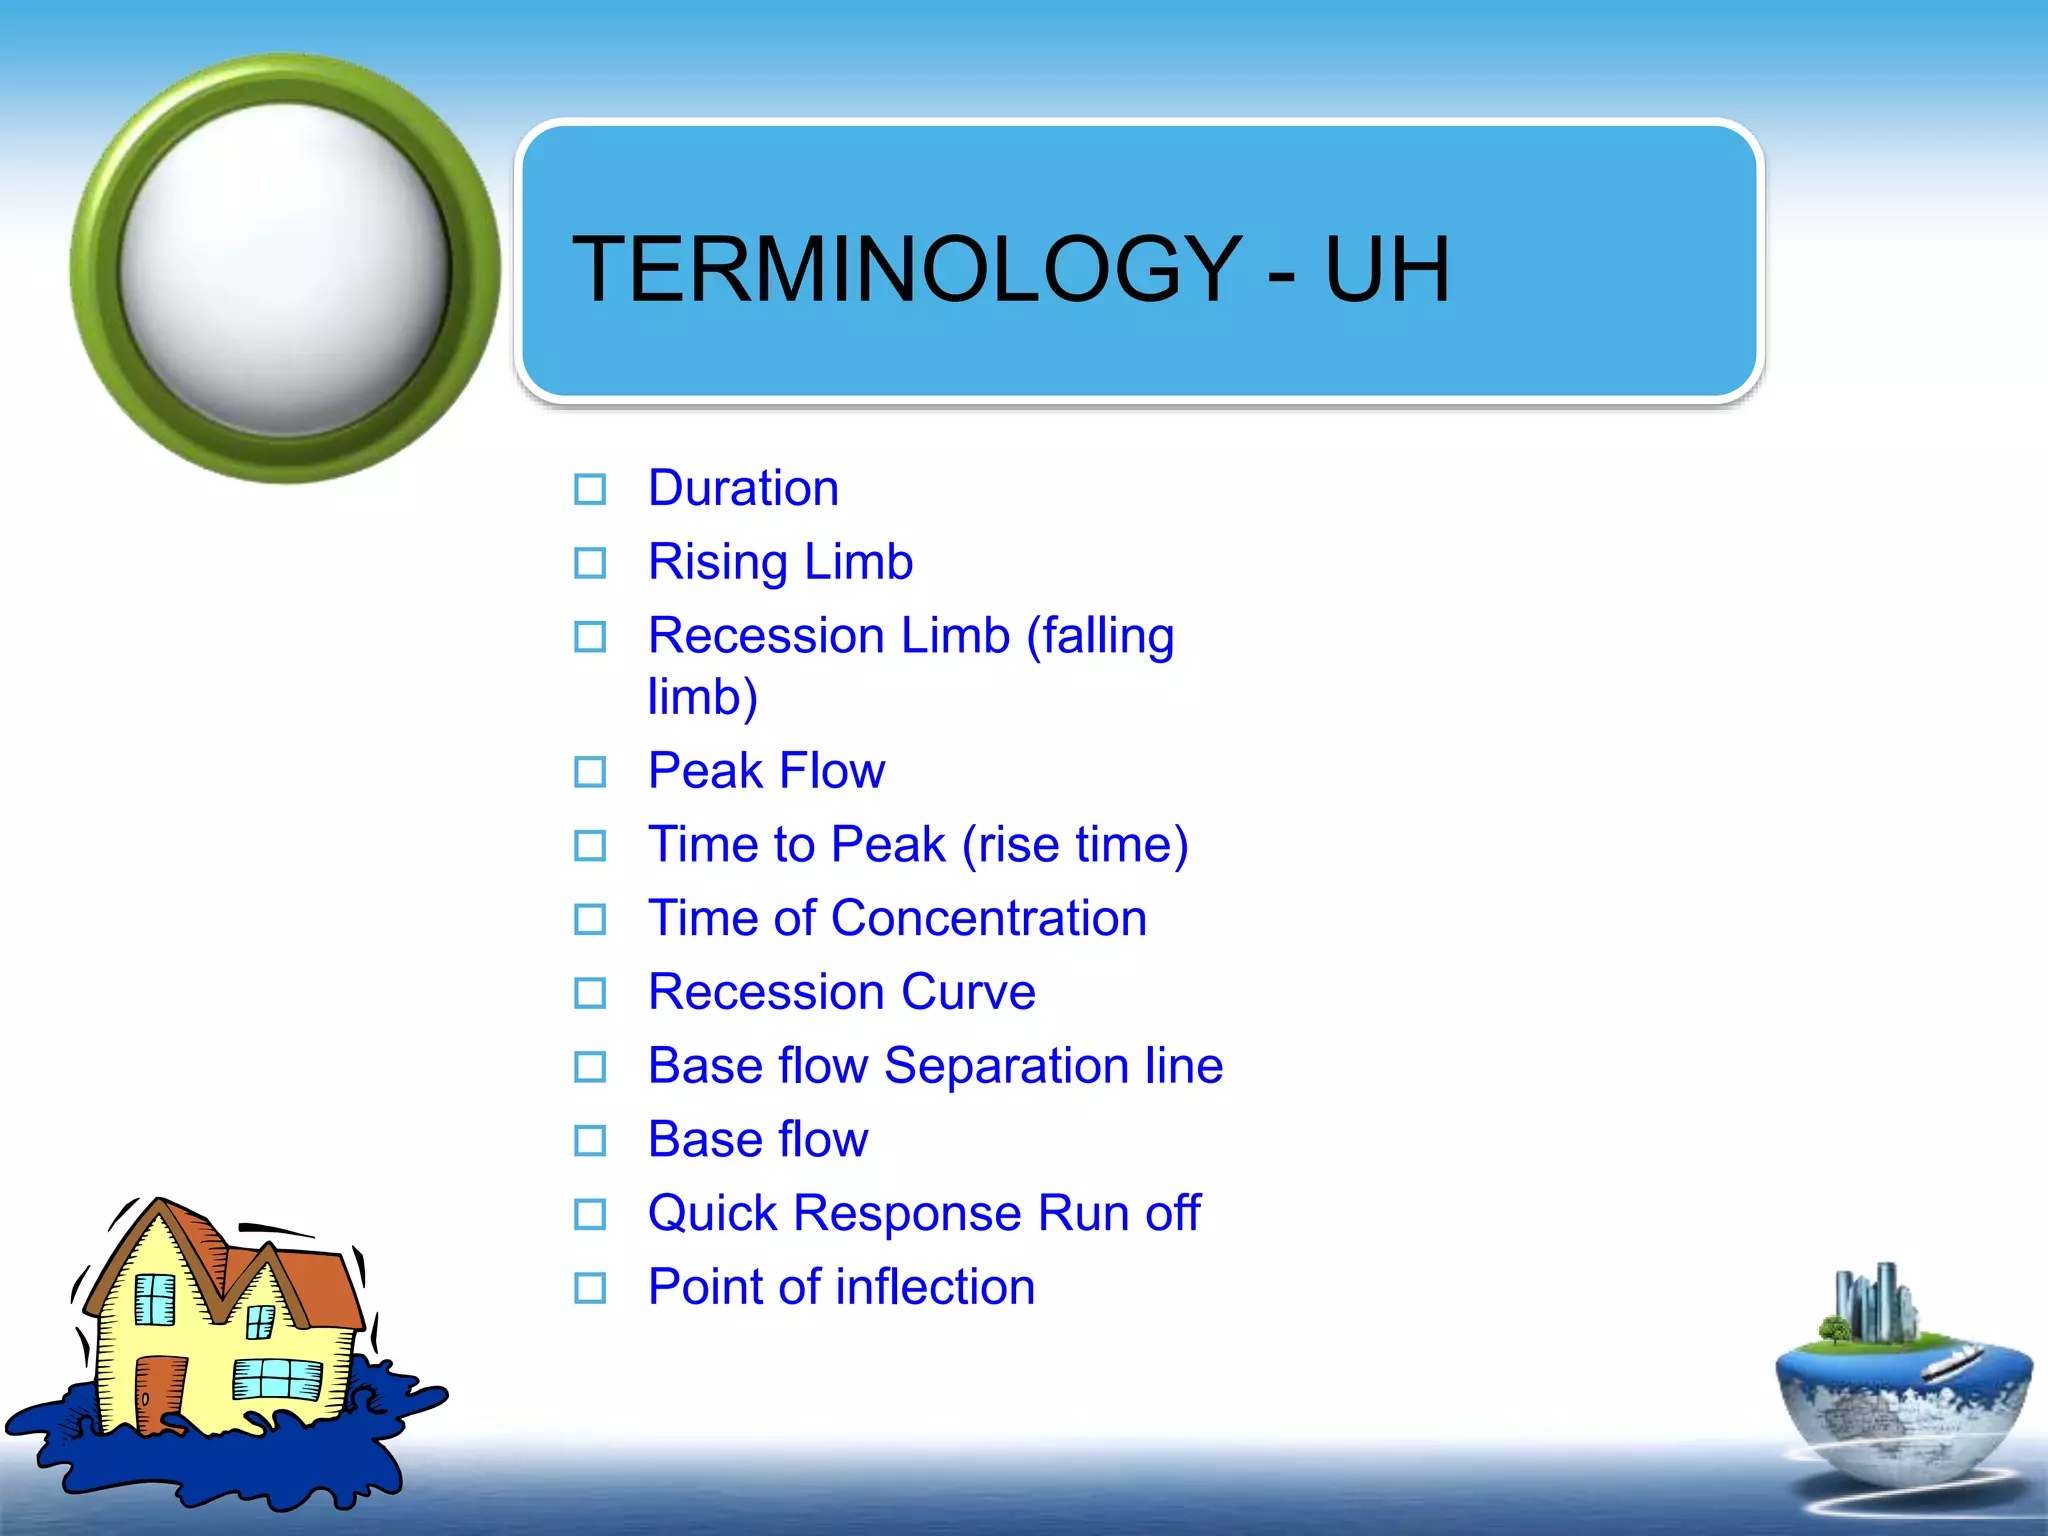
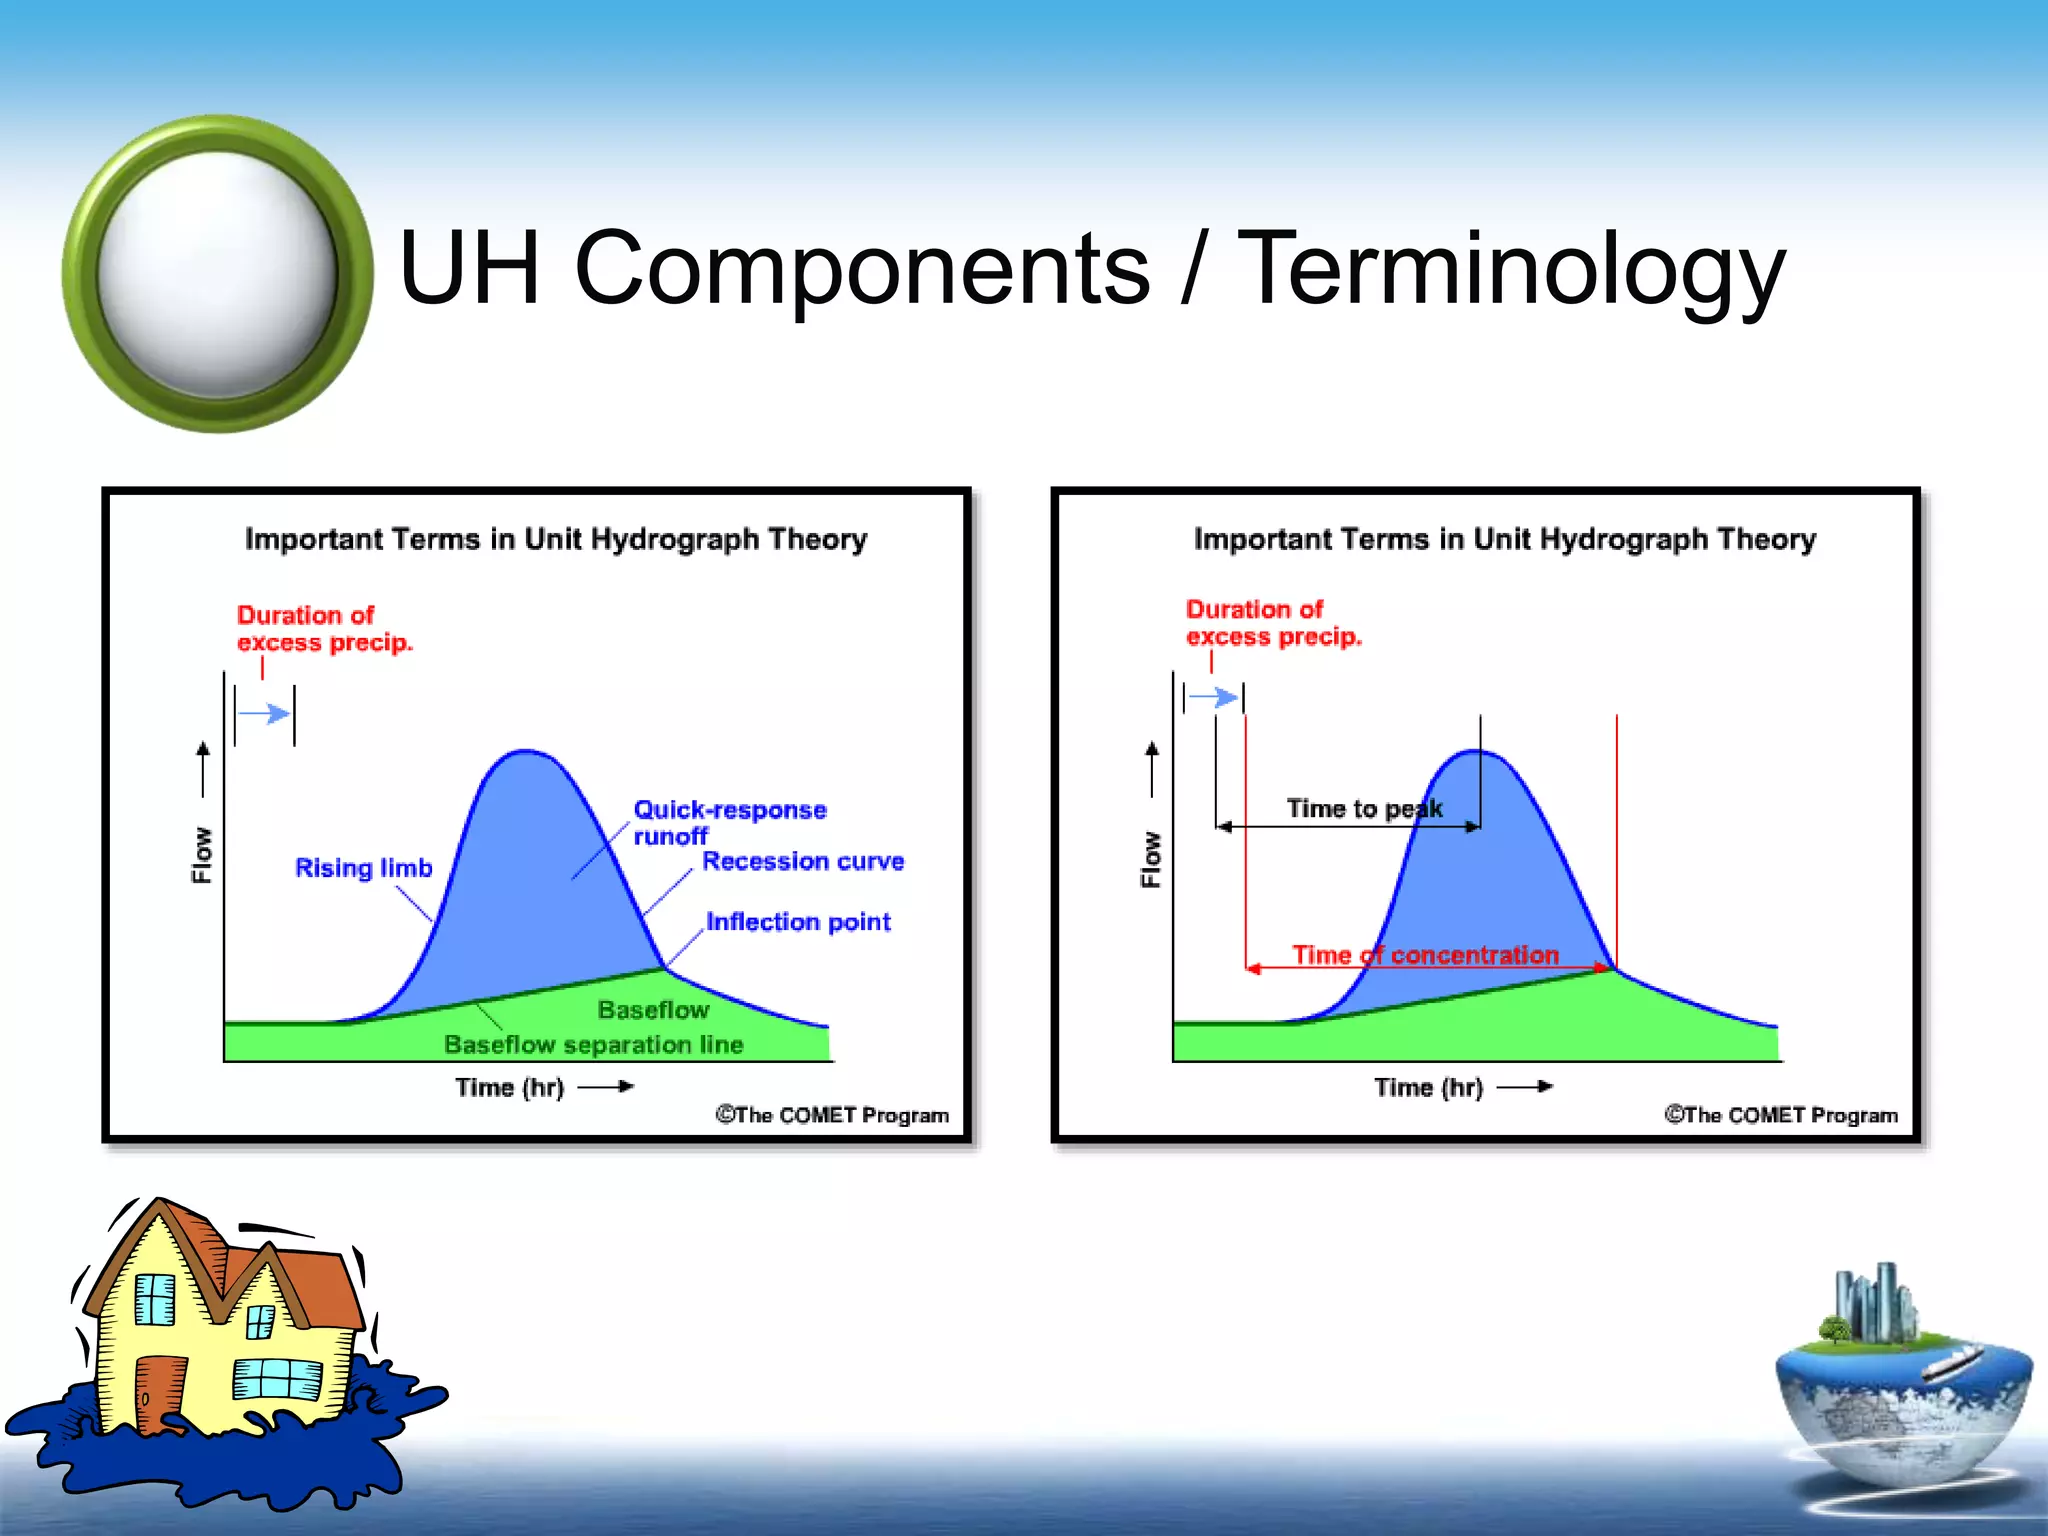
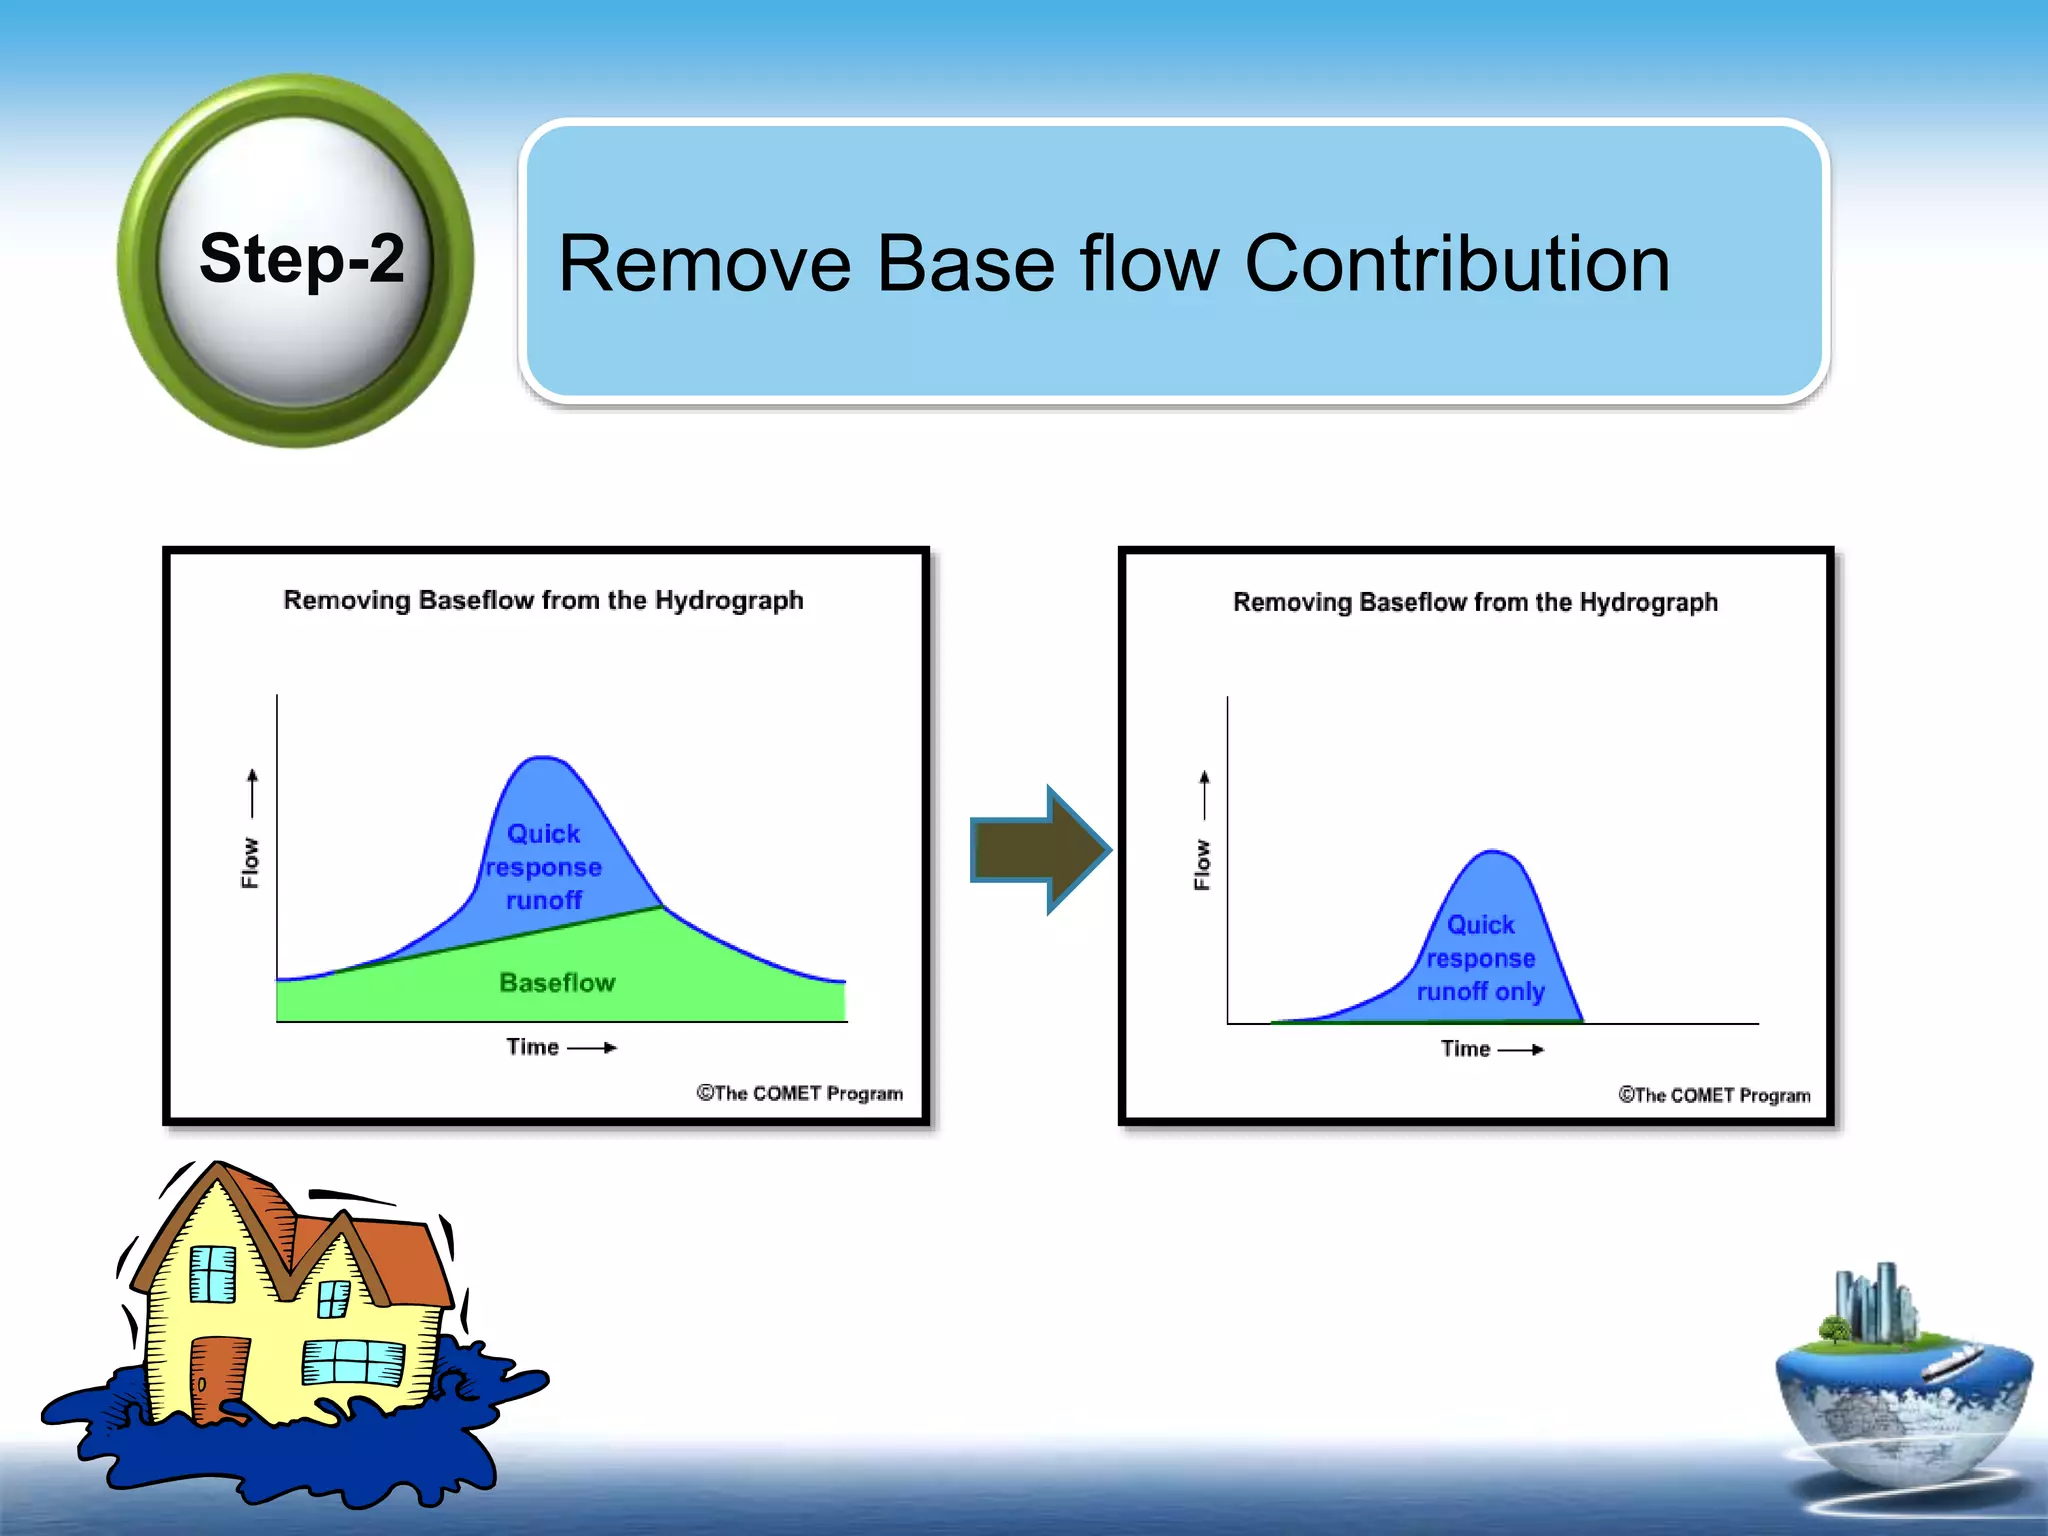
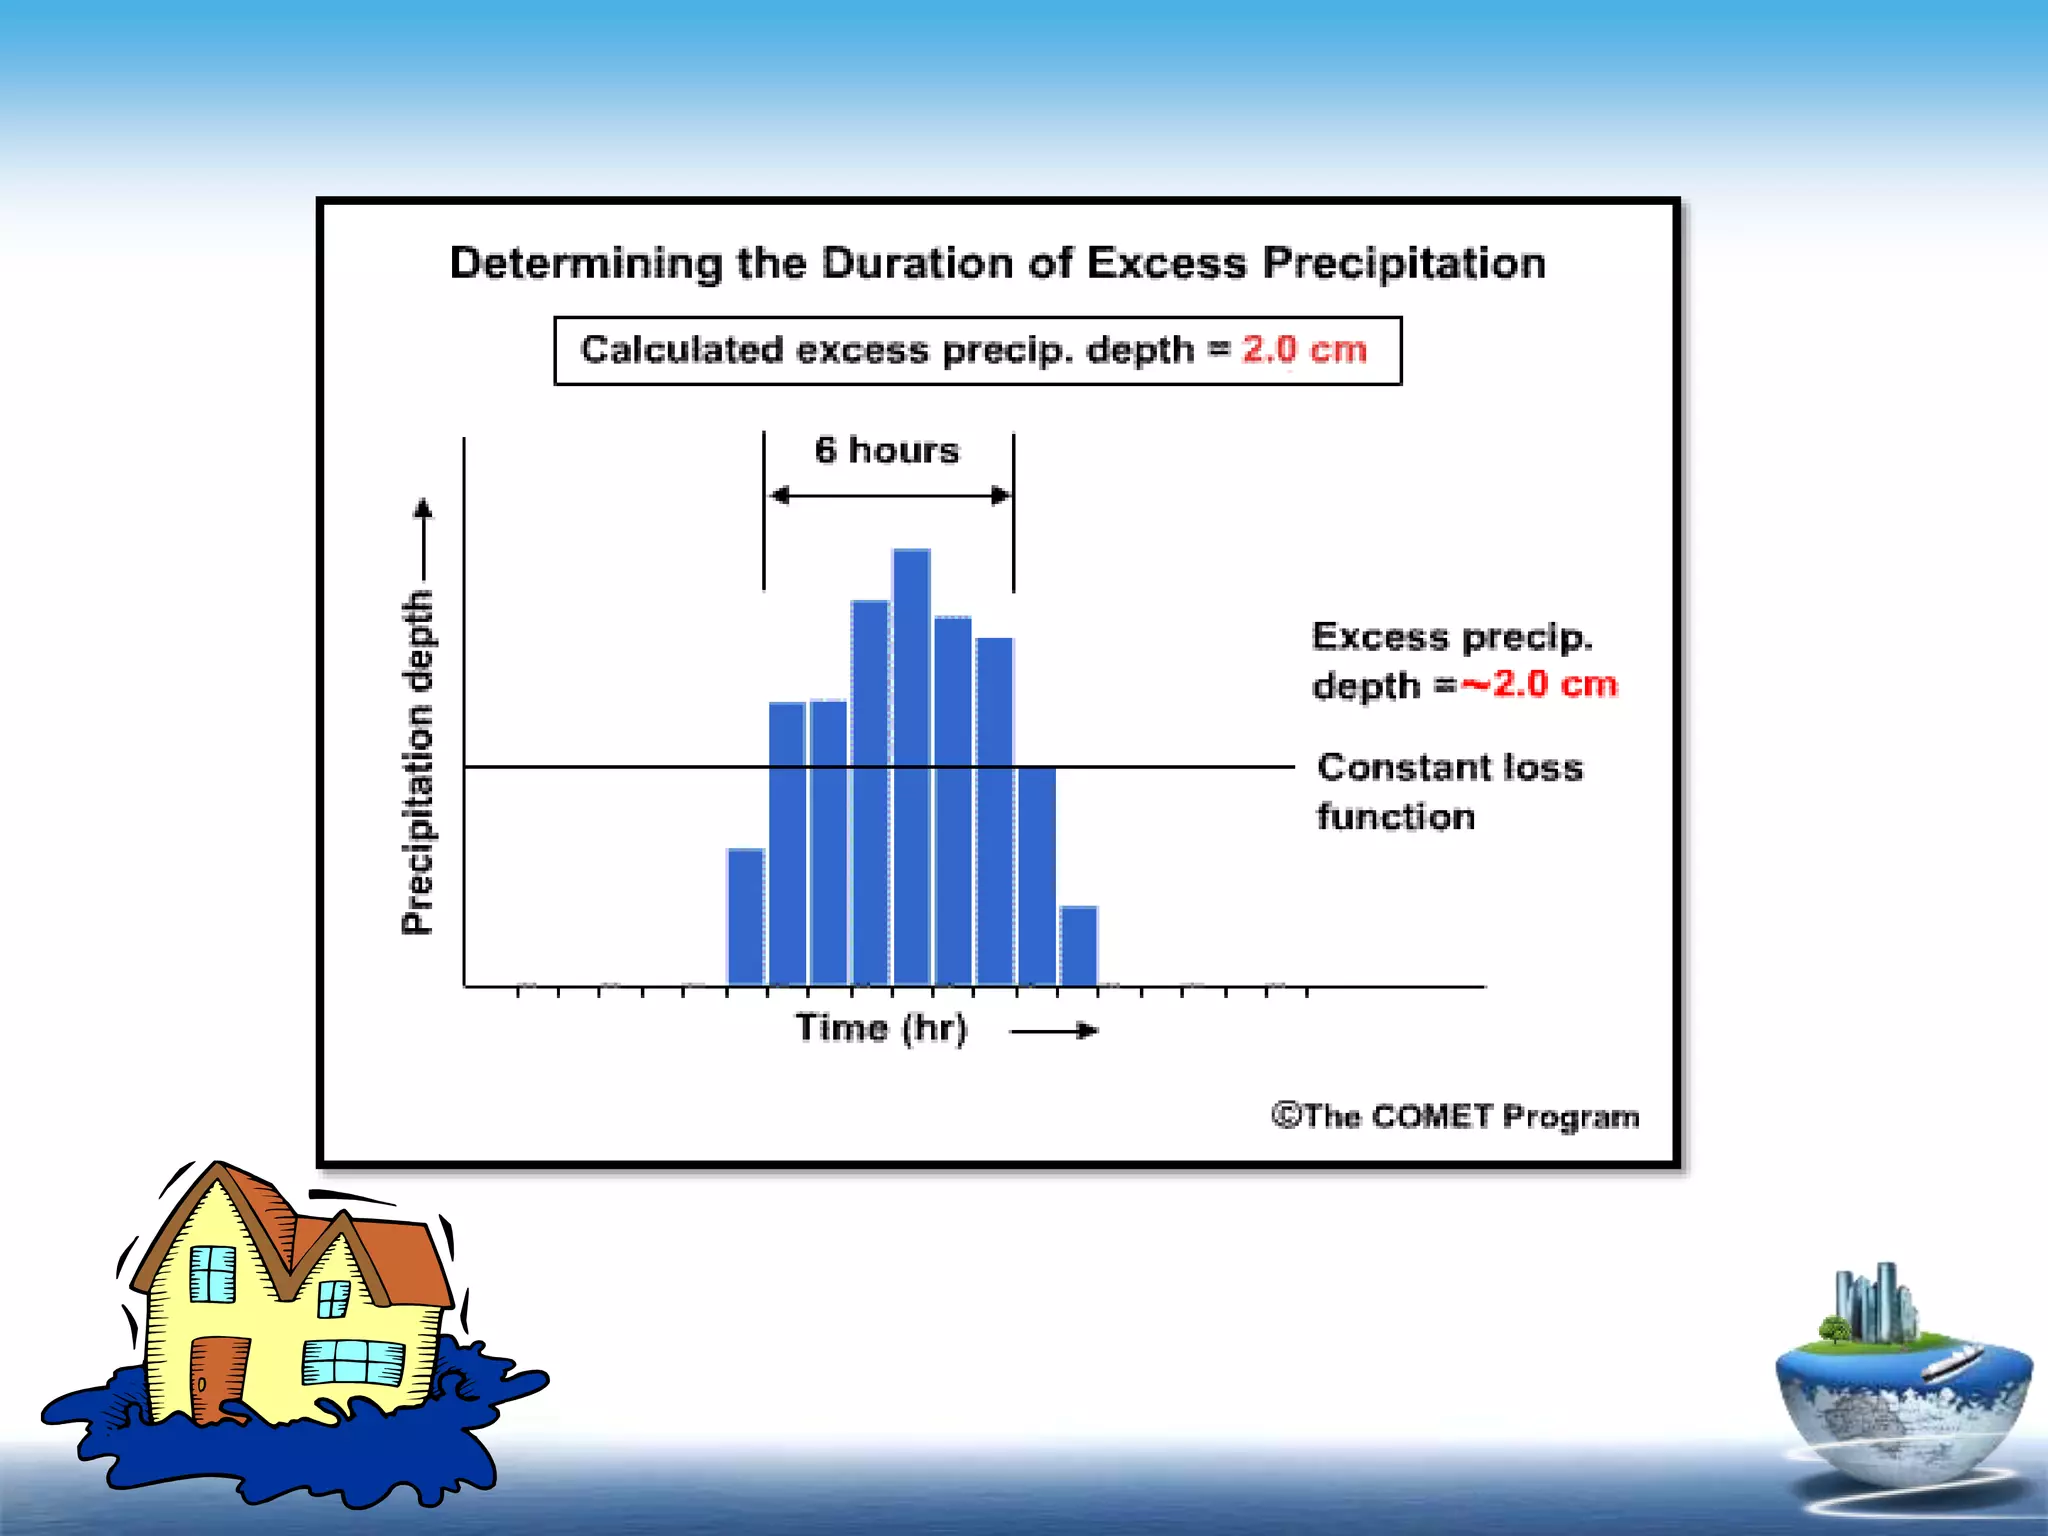
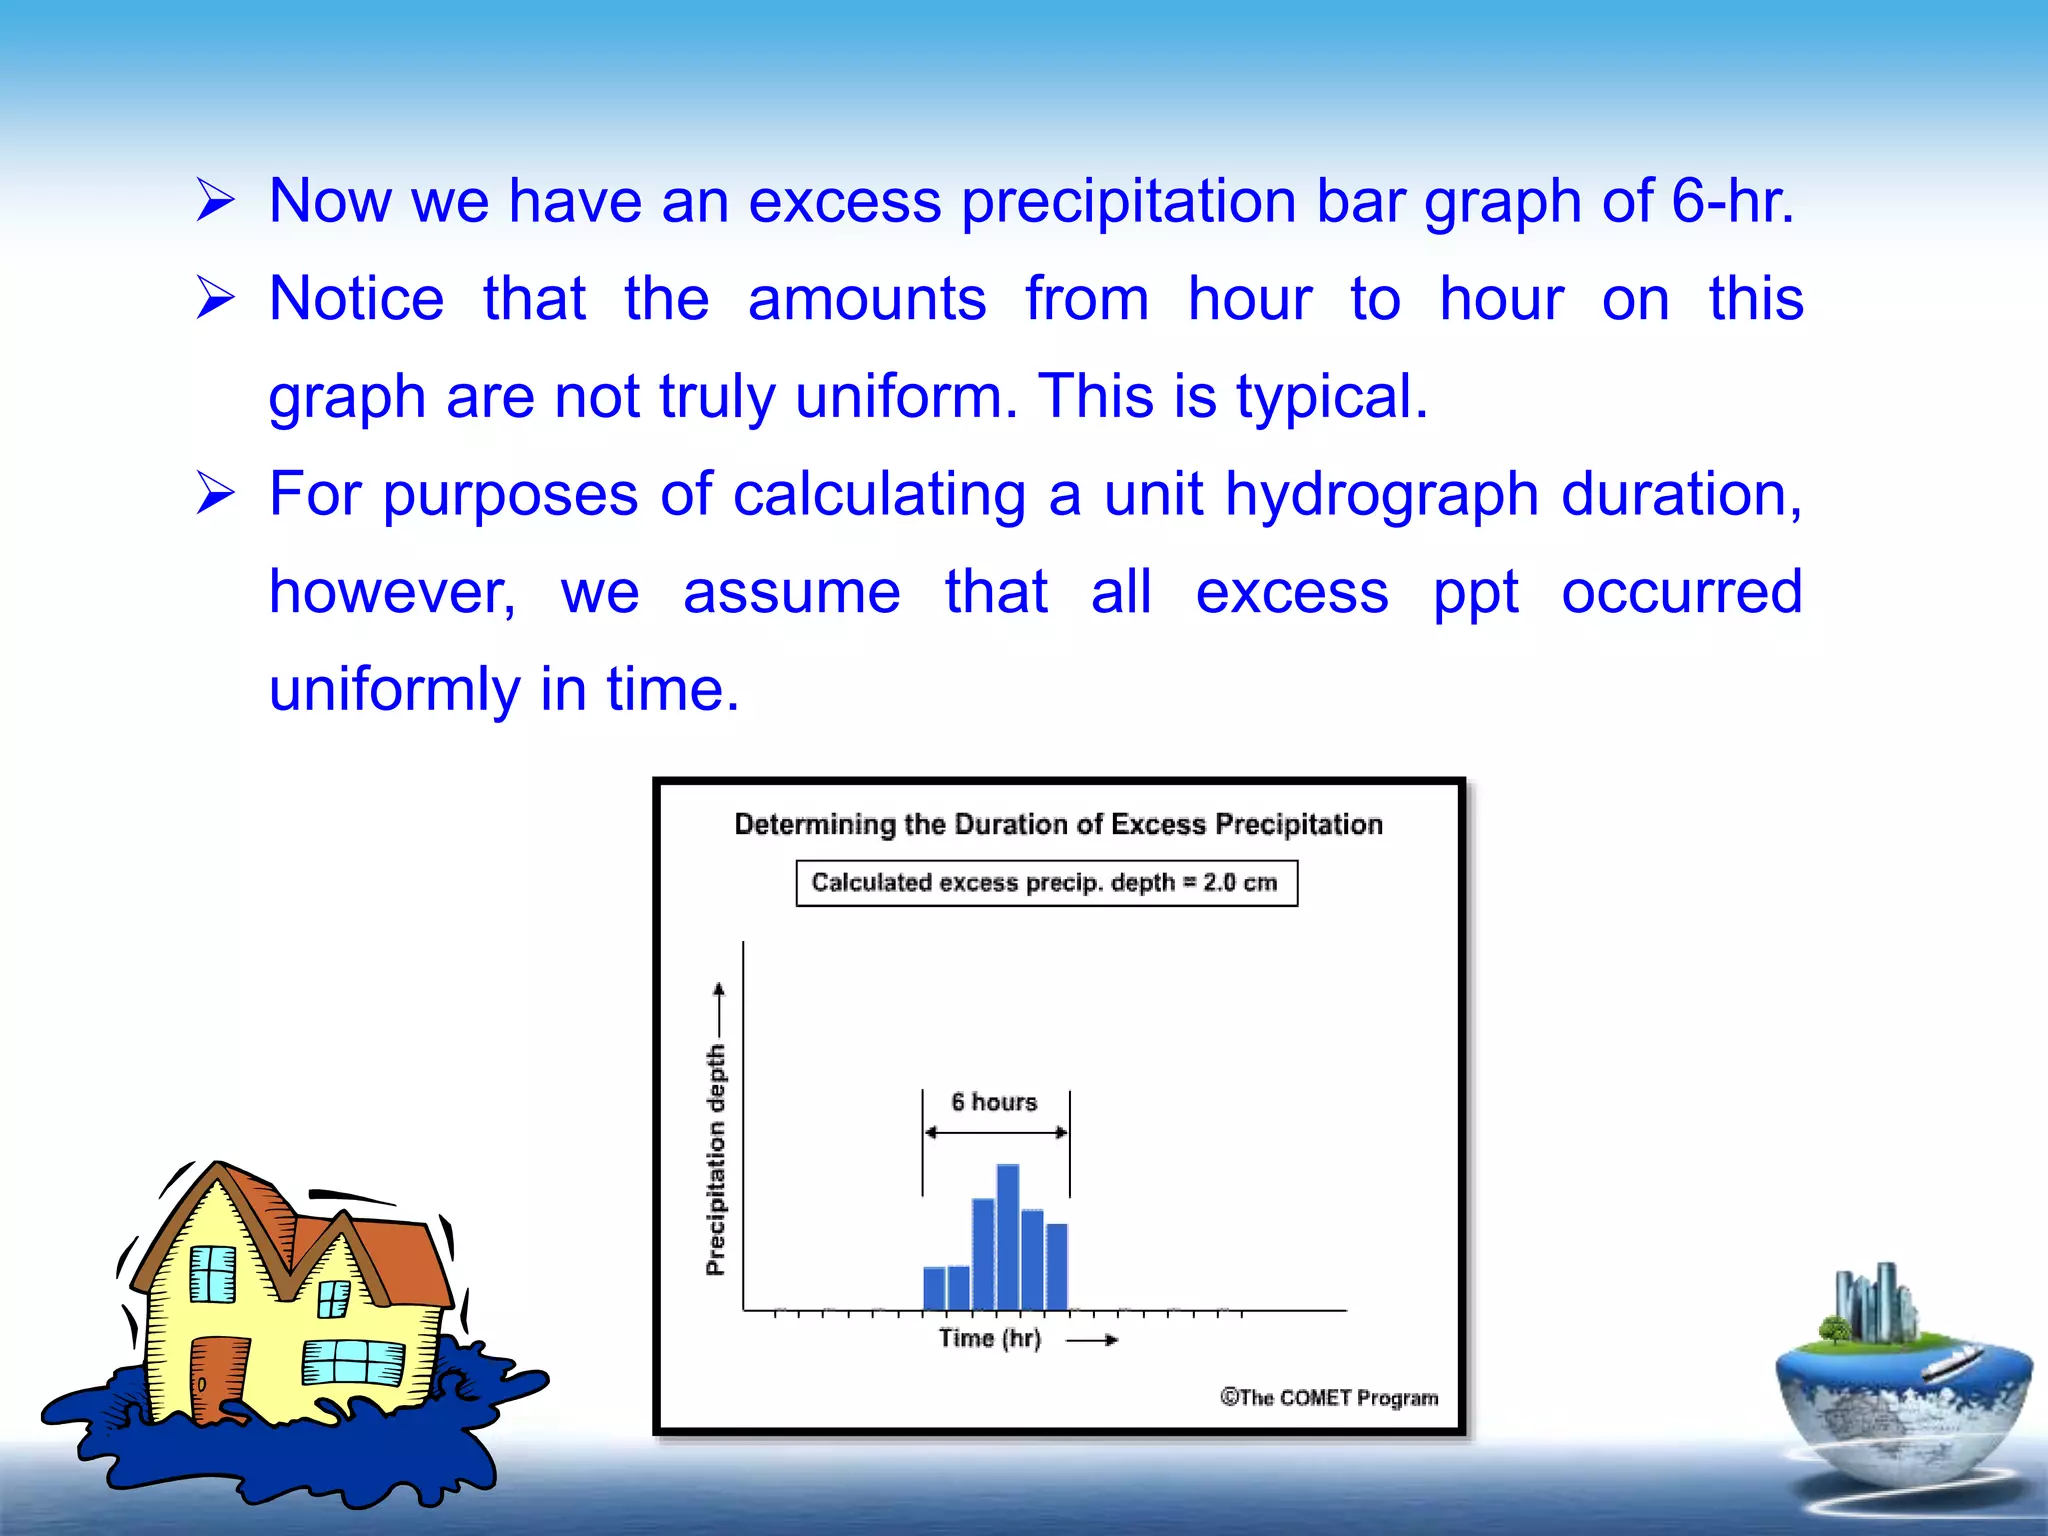
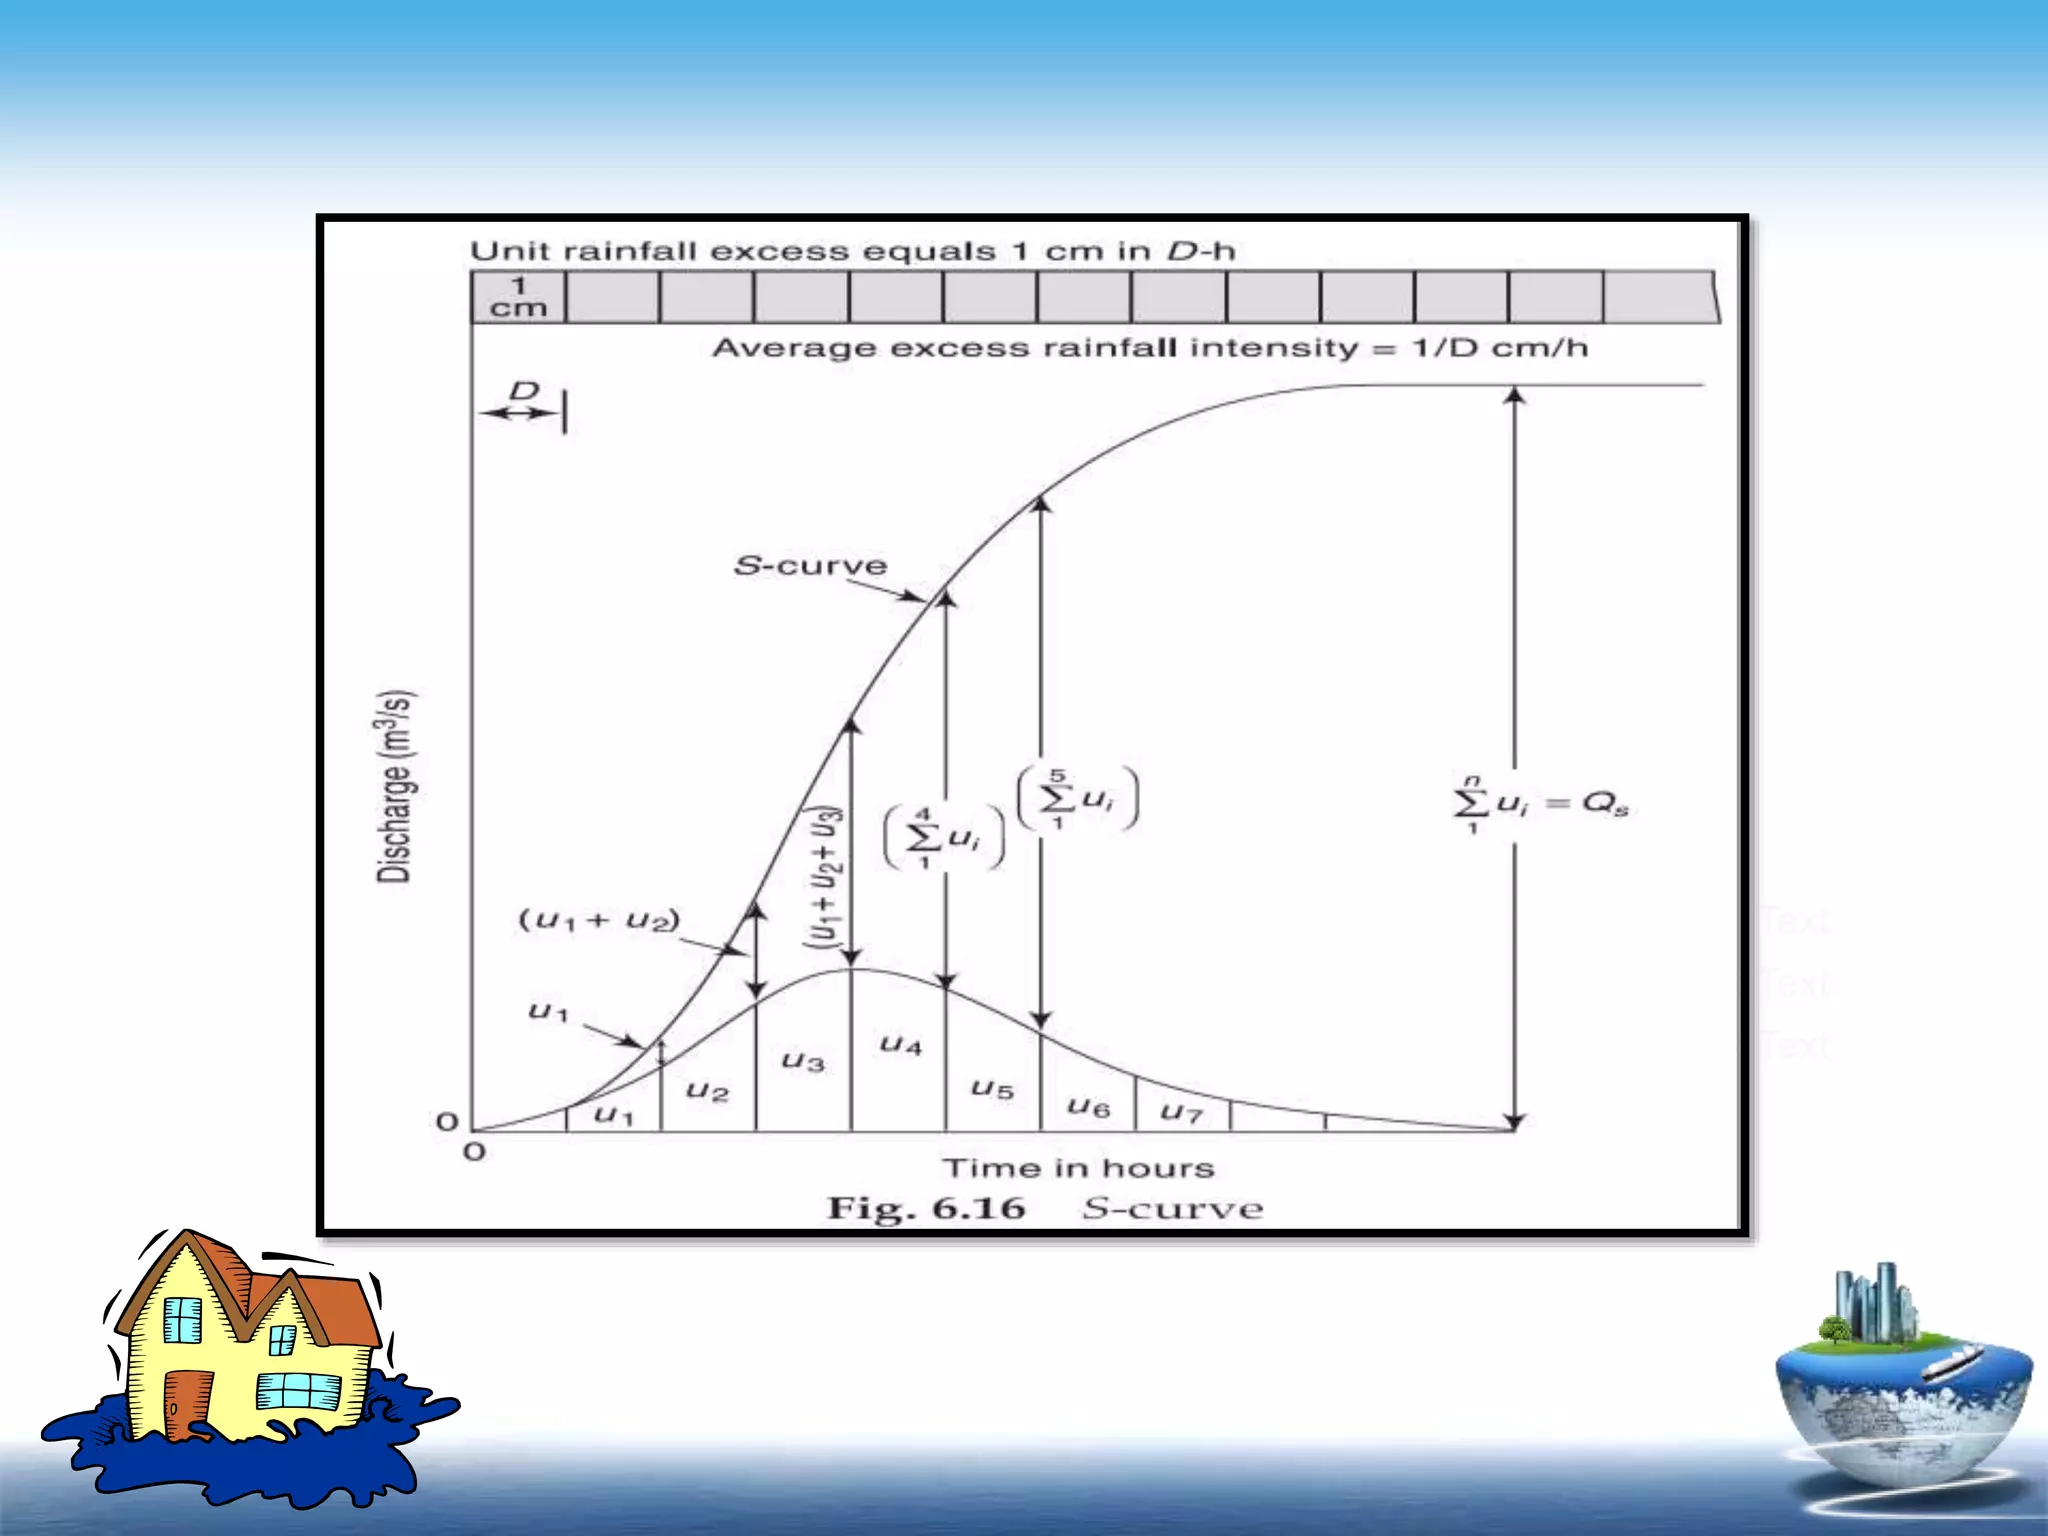
- Describing the assumptions and terminology used in unit hydrograph models, such as uniform rainfall distribution and the components of a hydrograph.
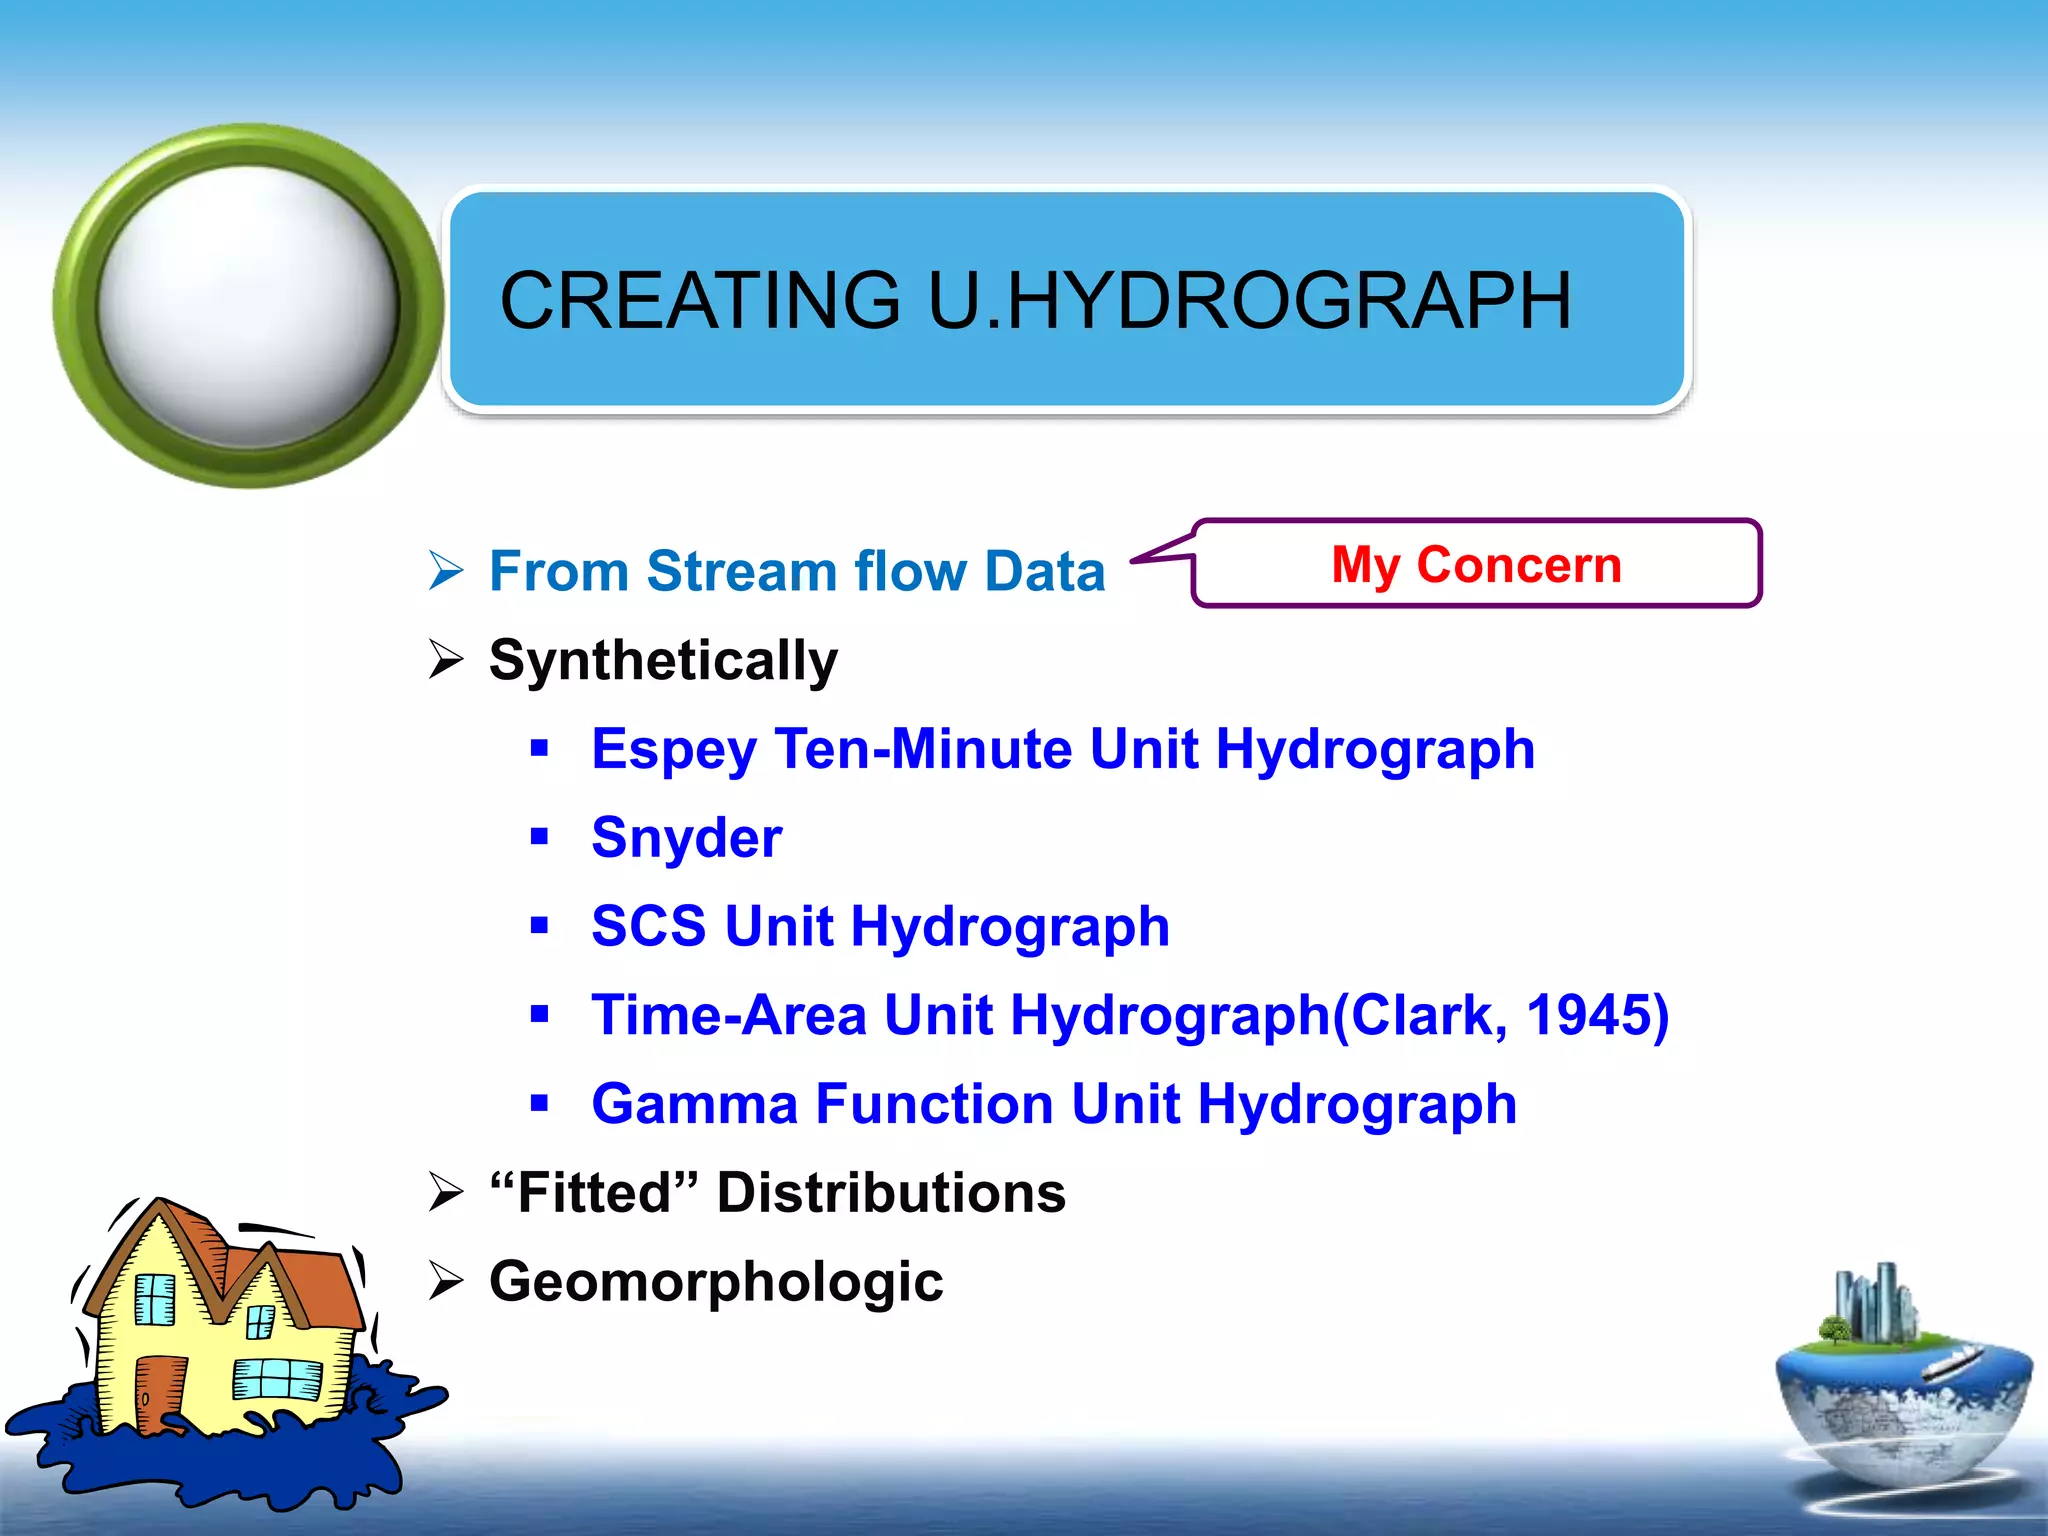
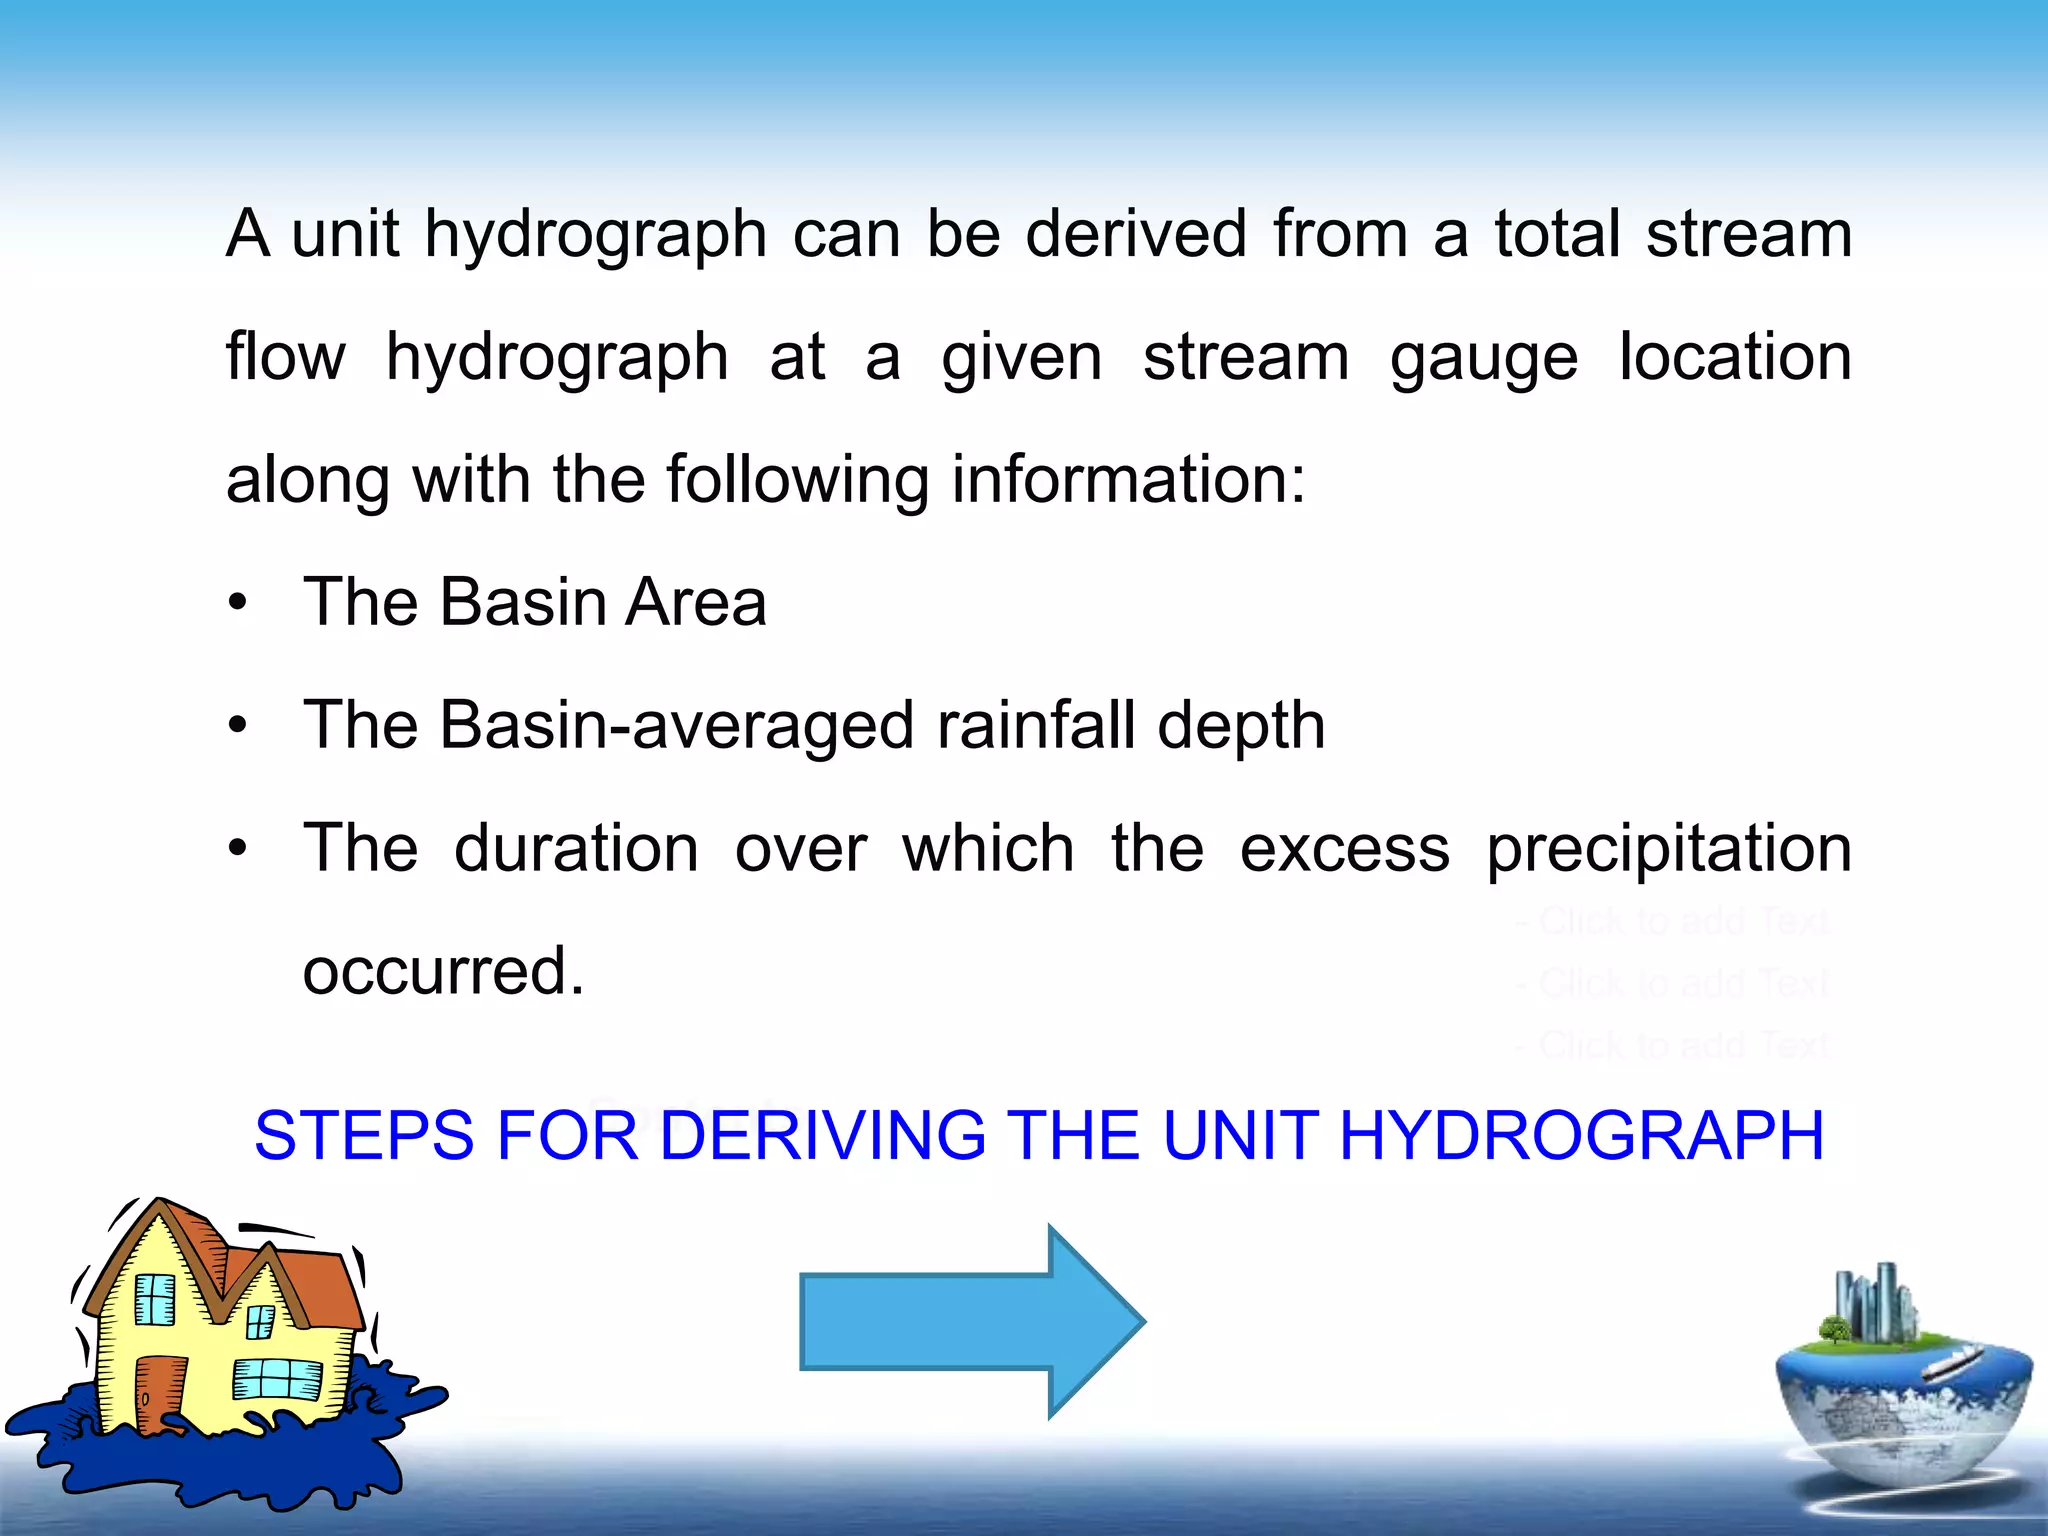
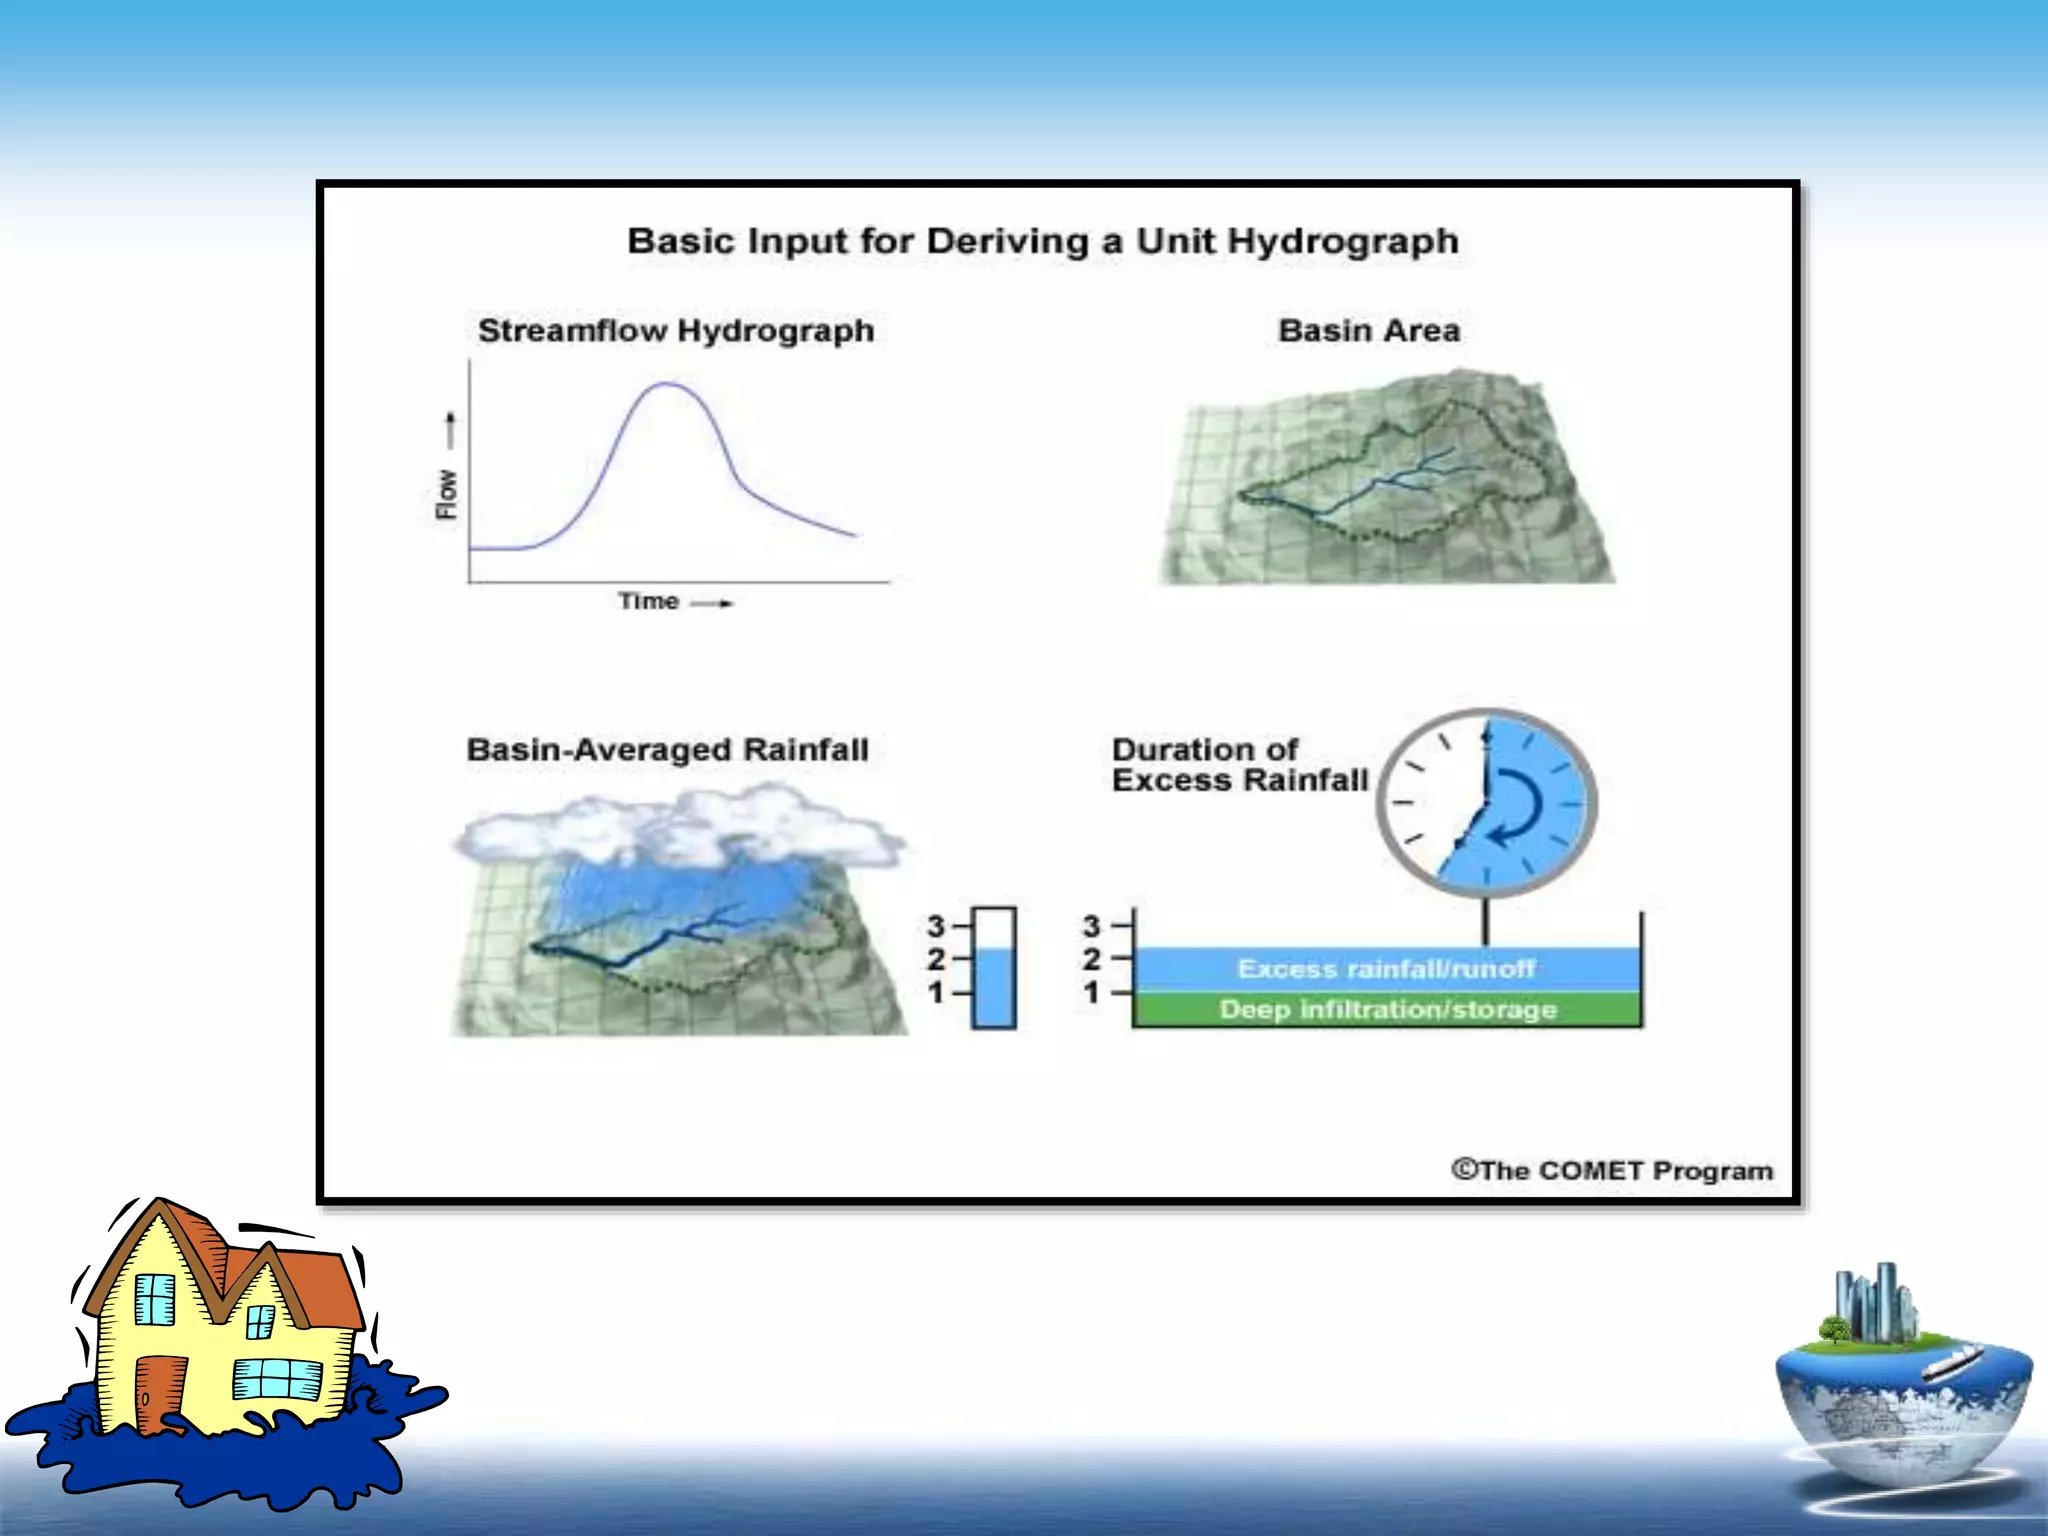
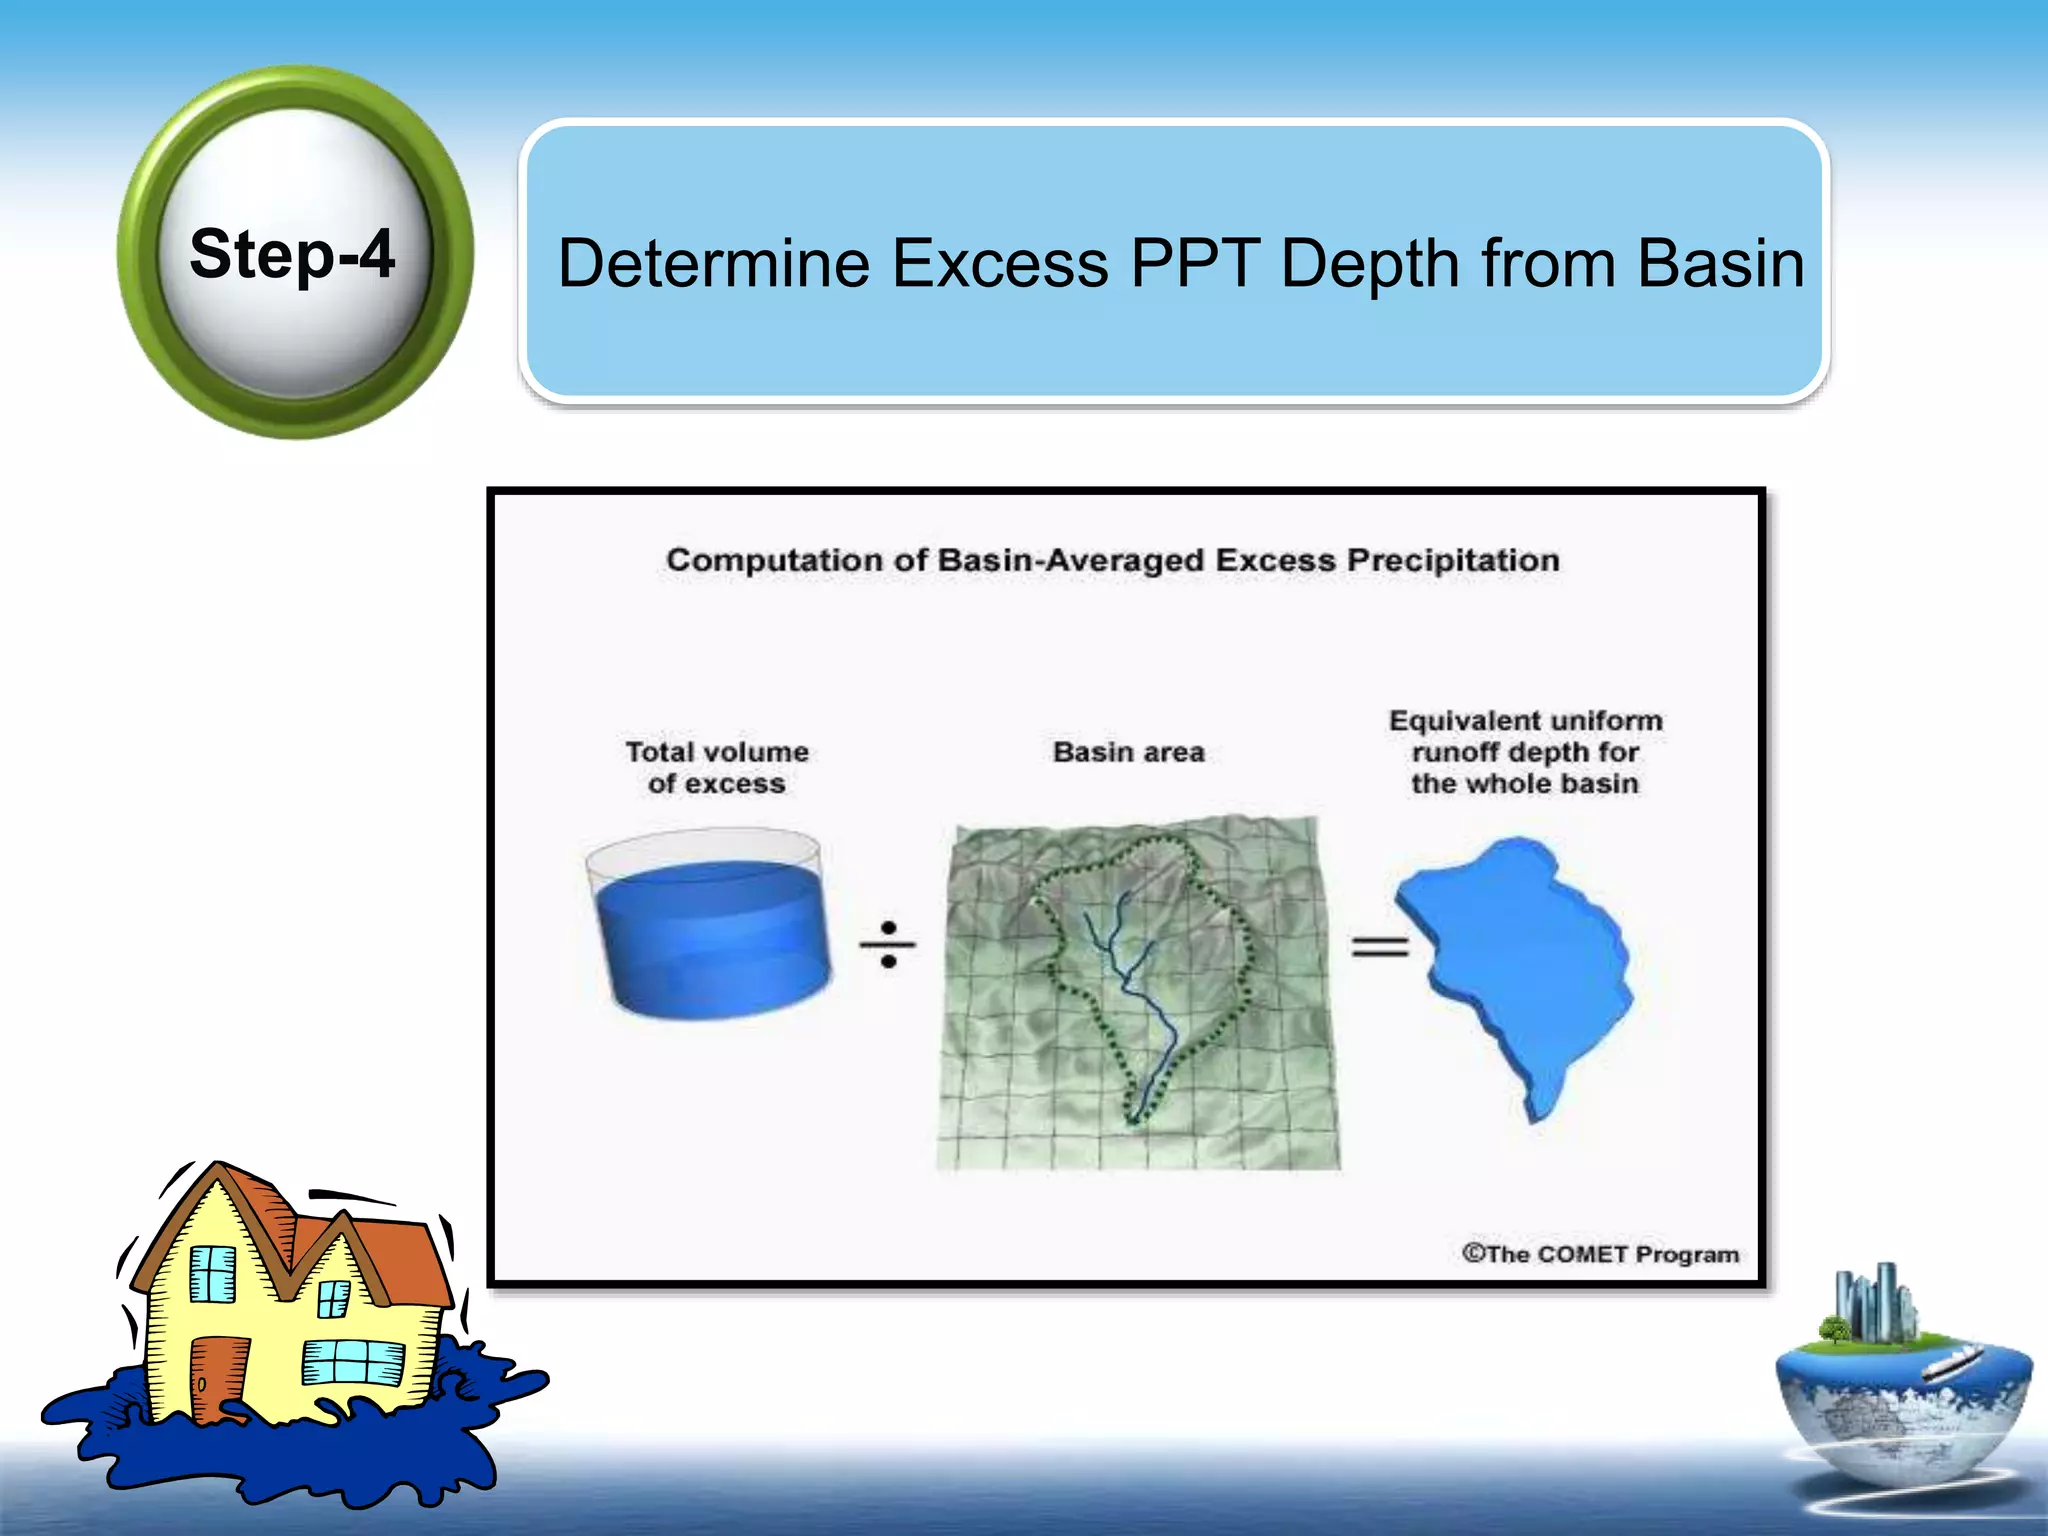
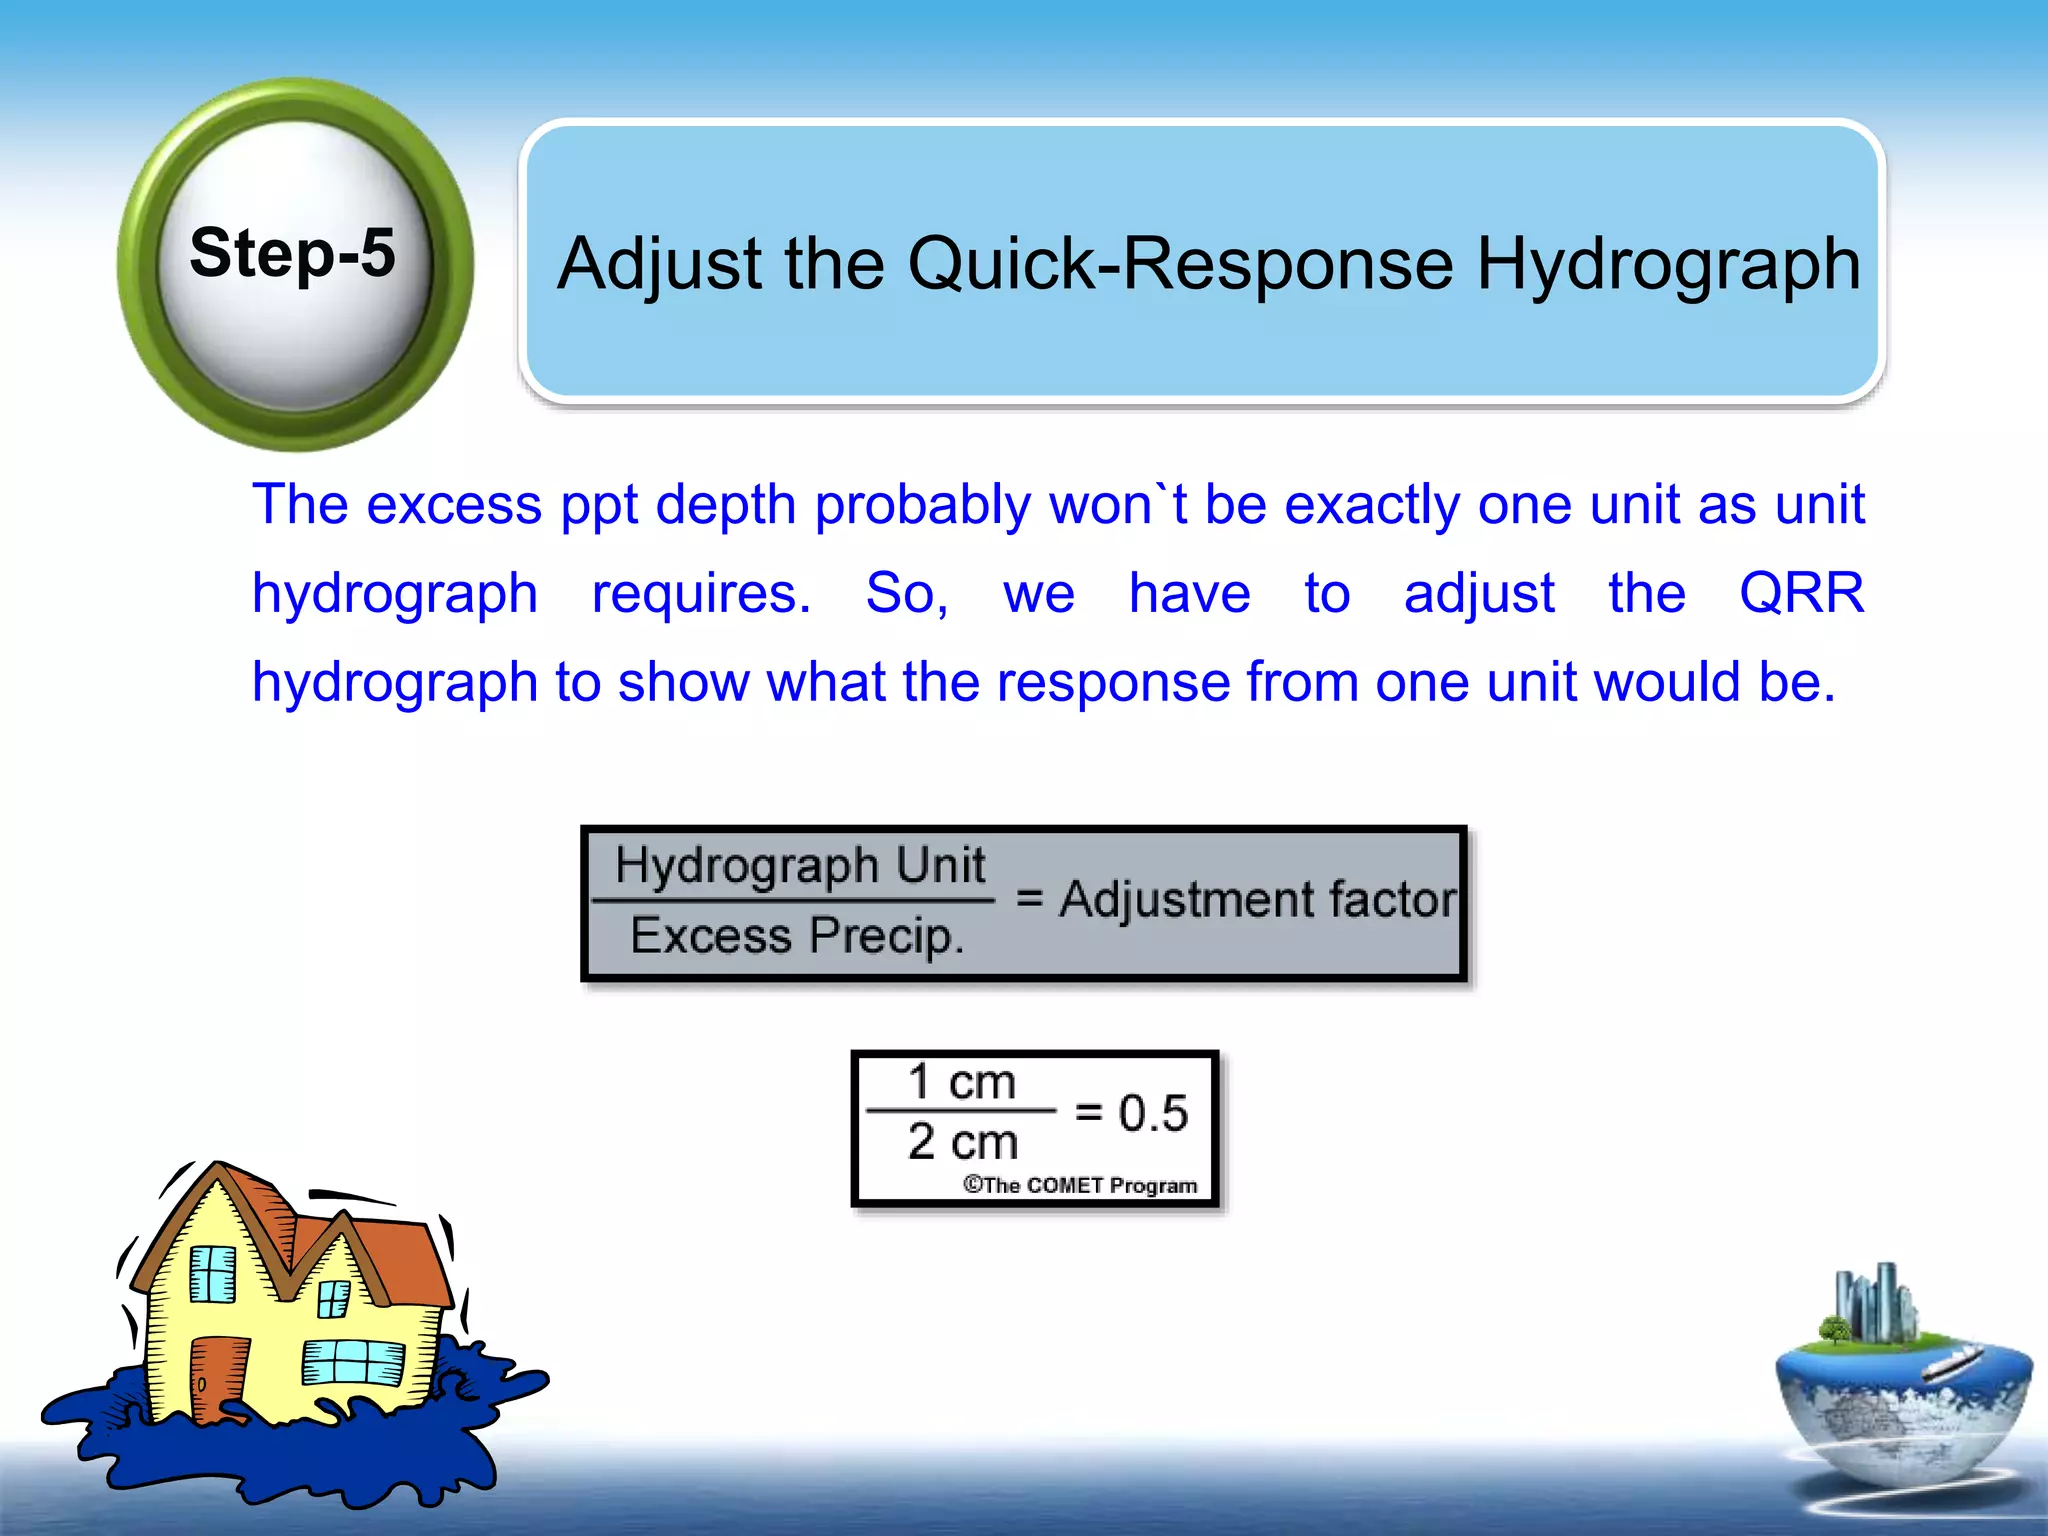
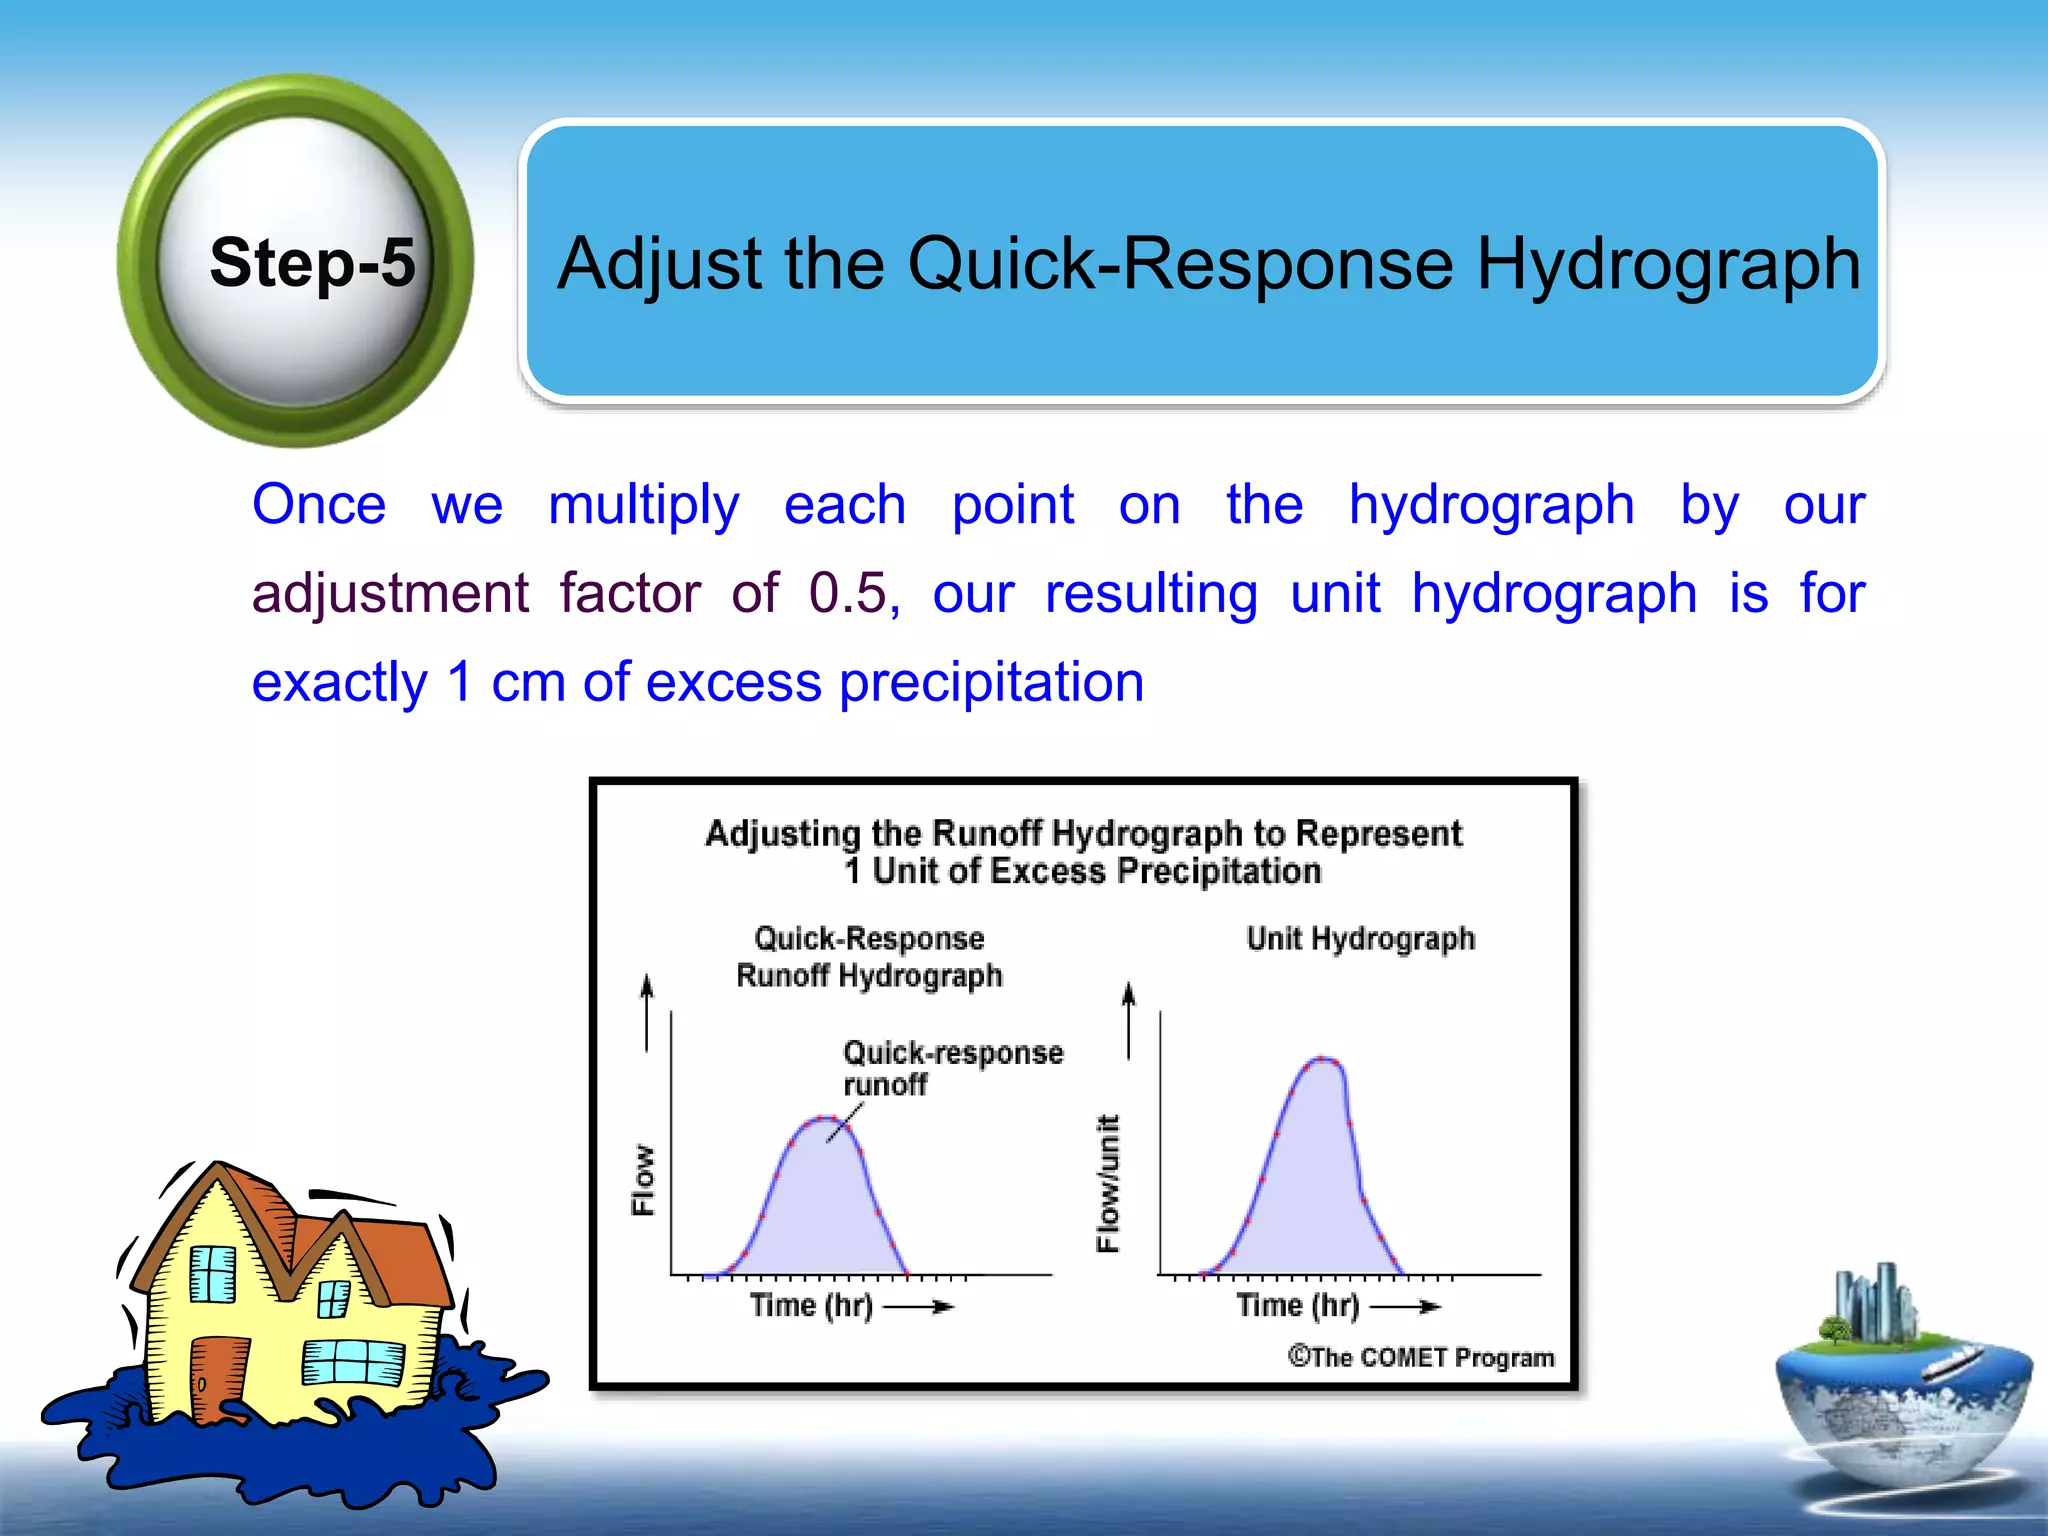
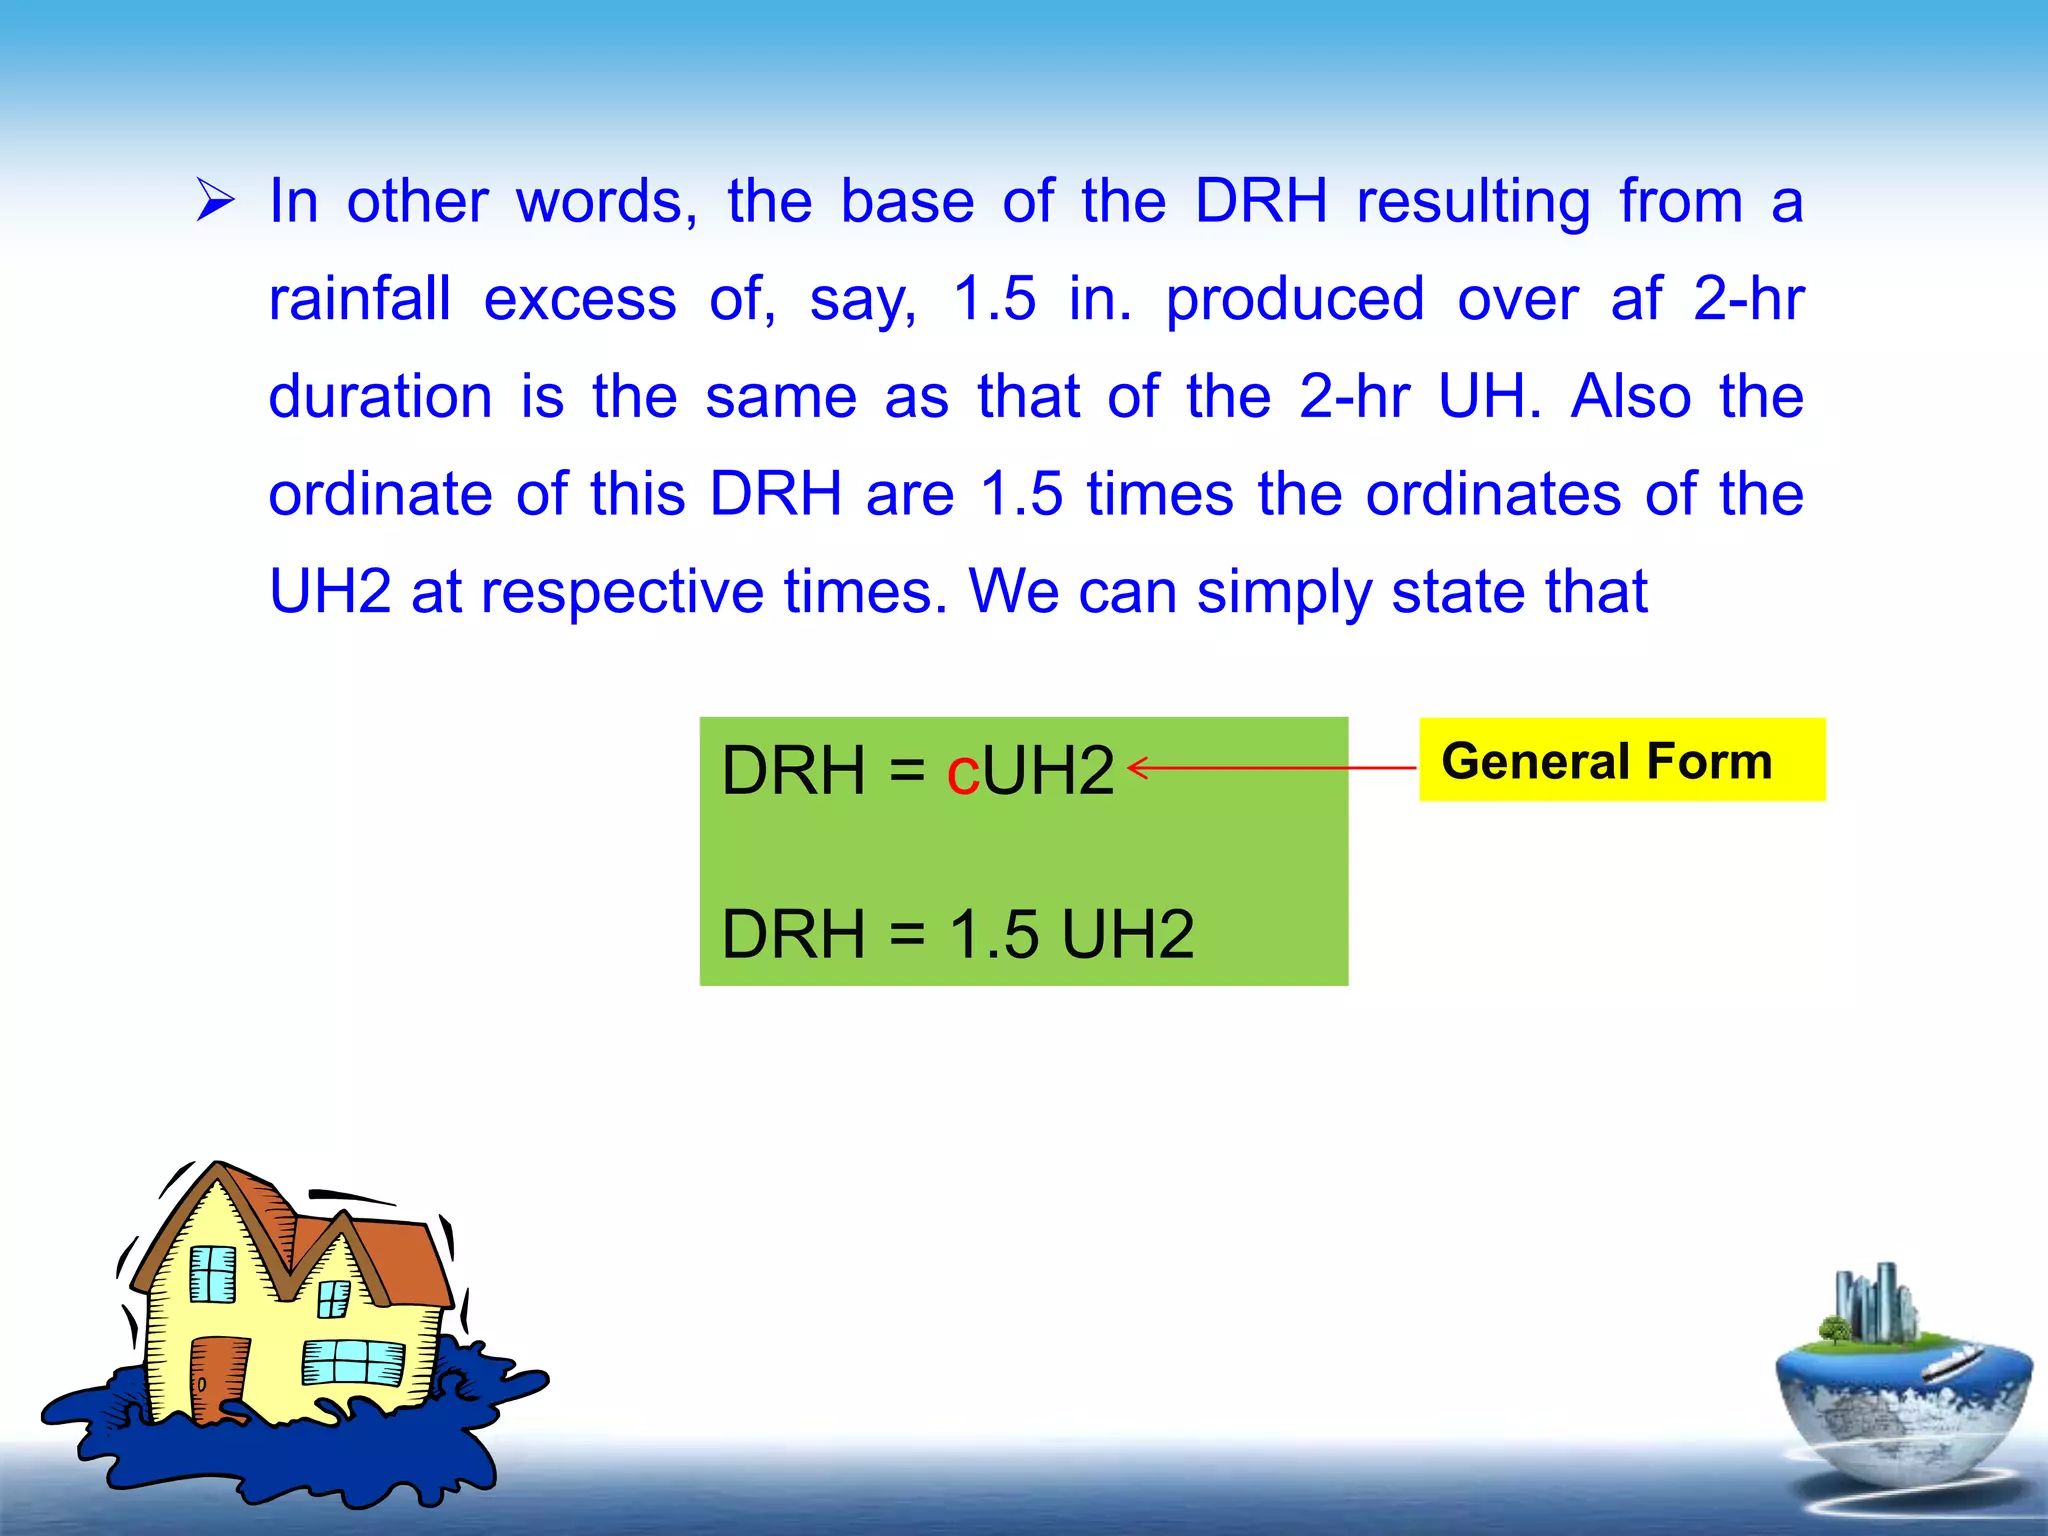
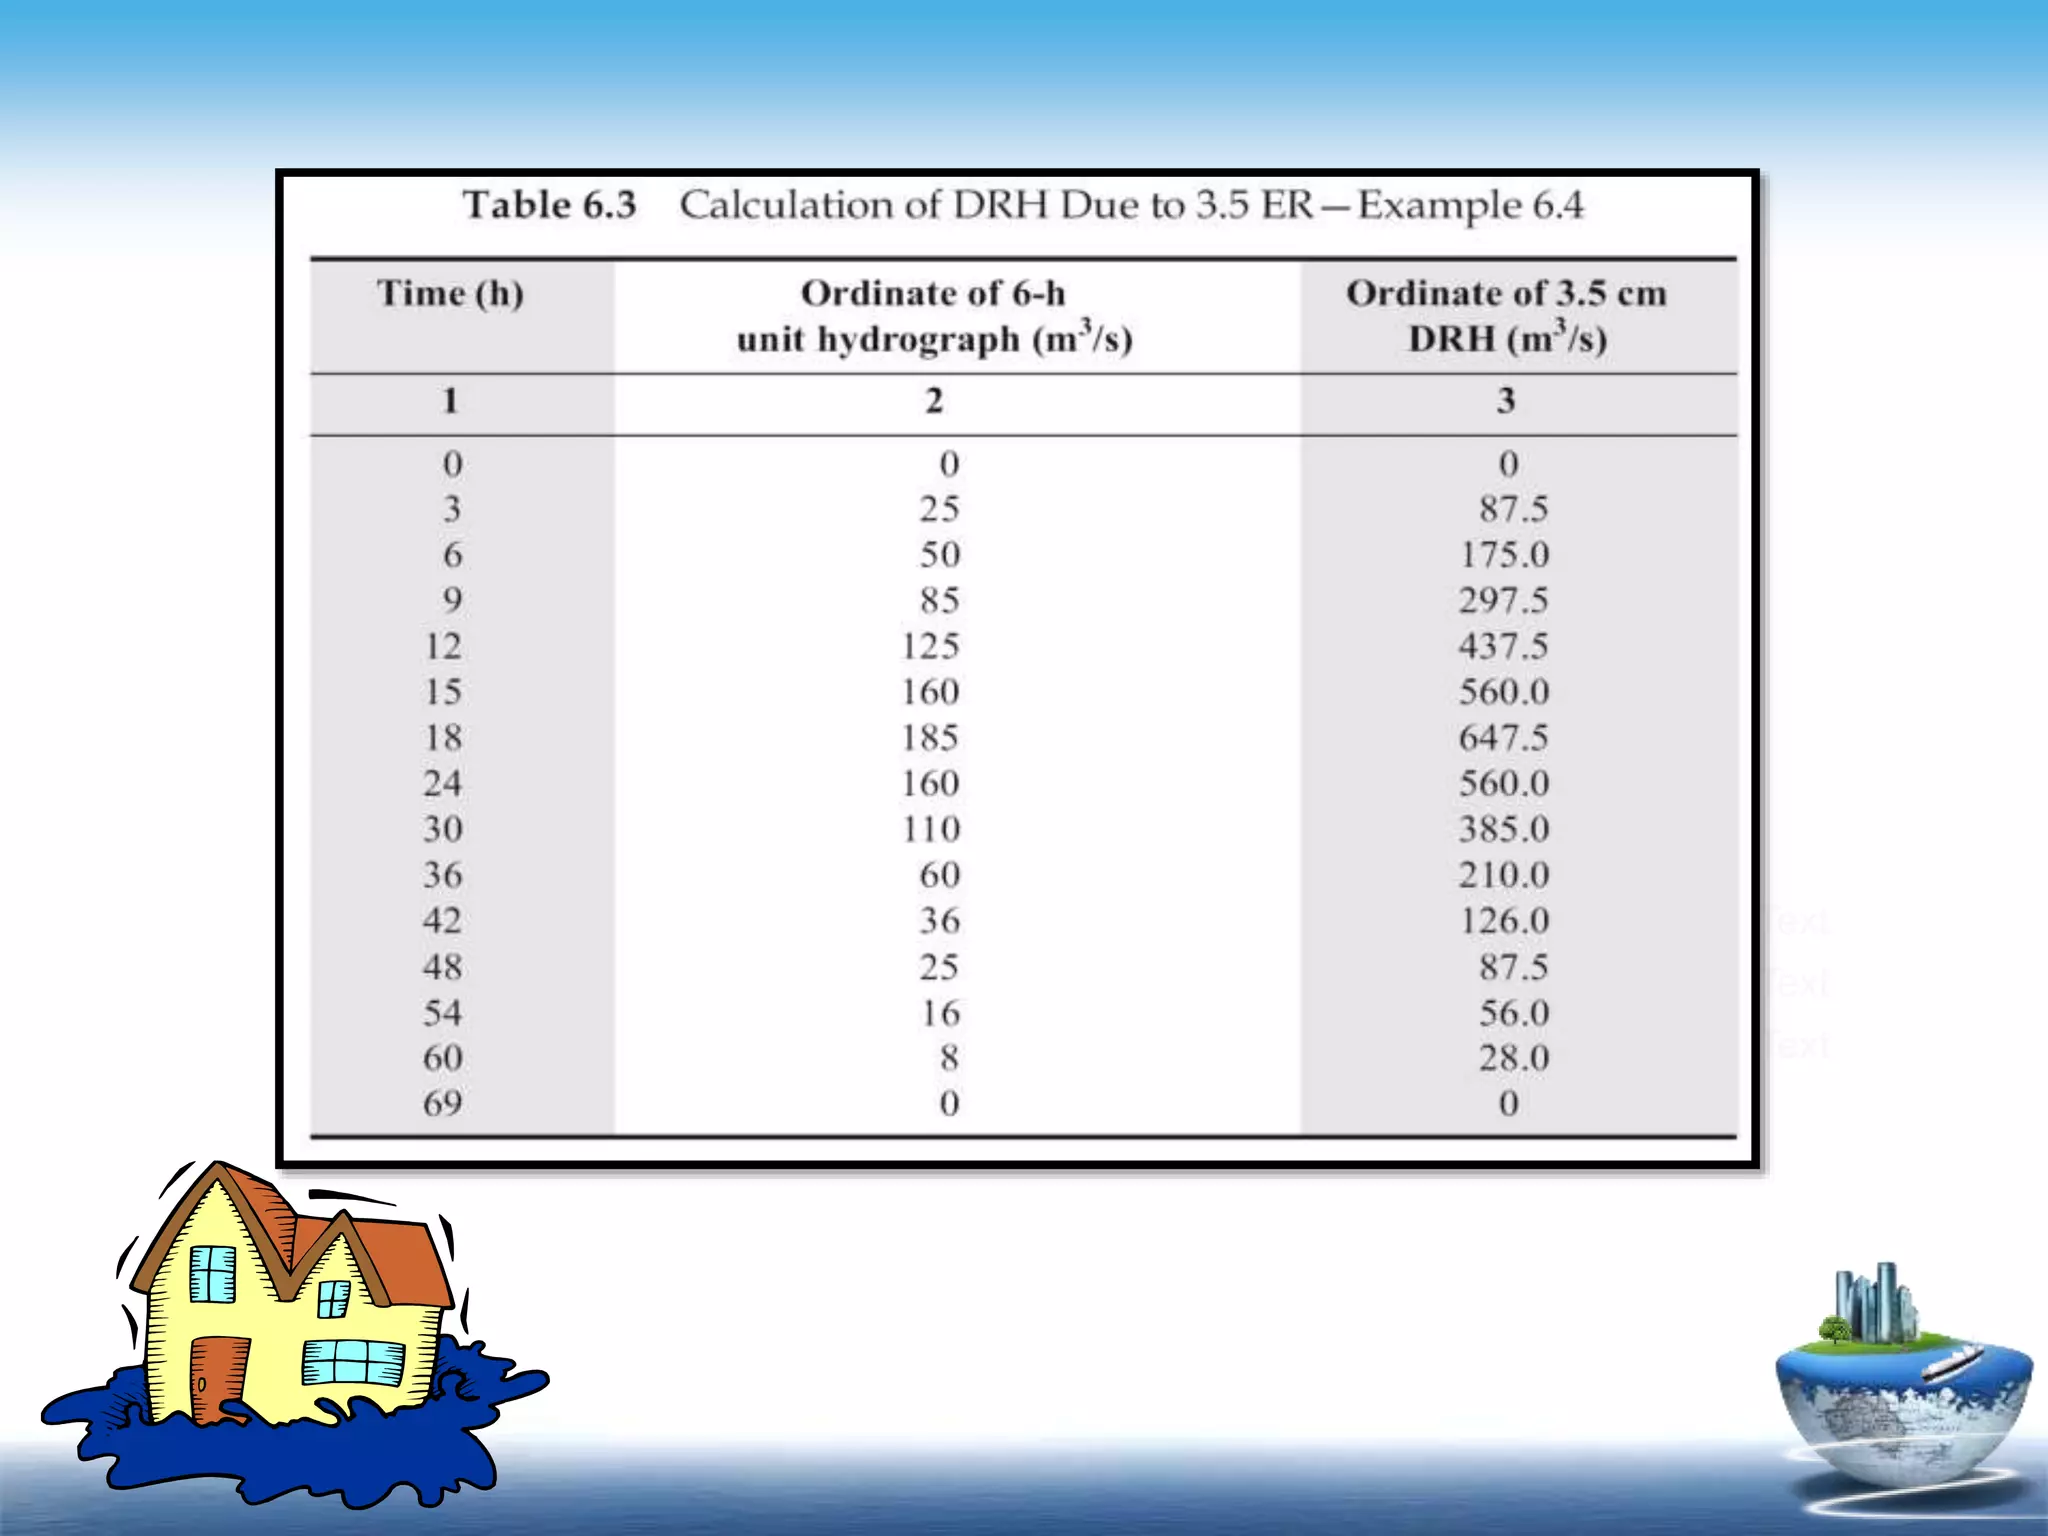
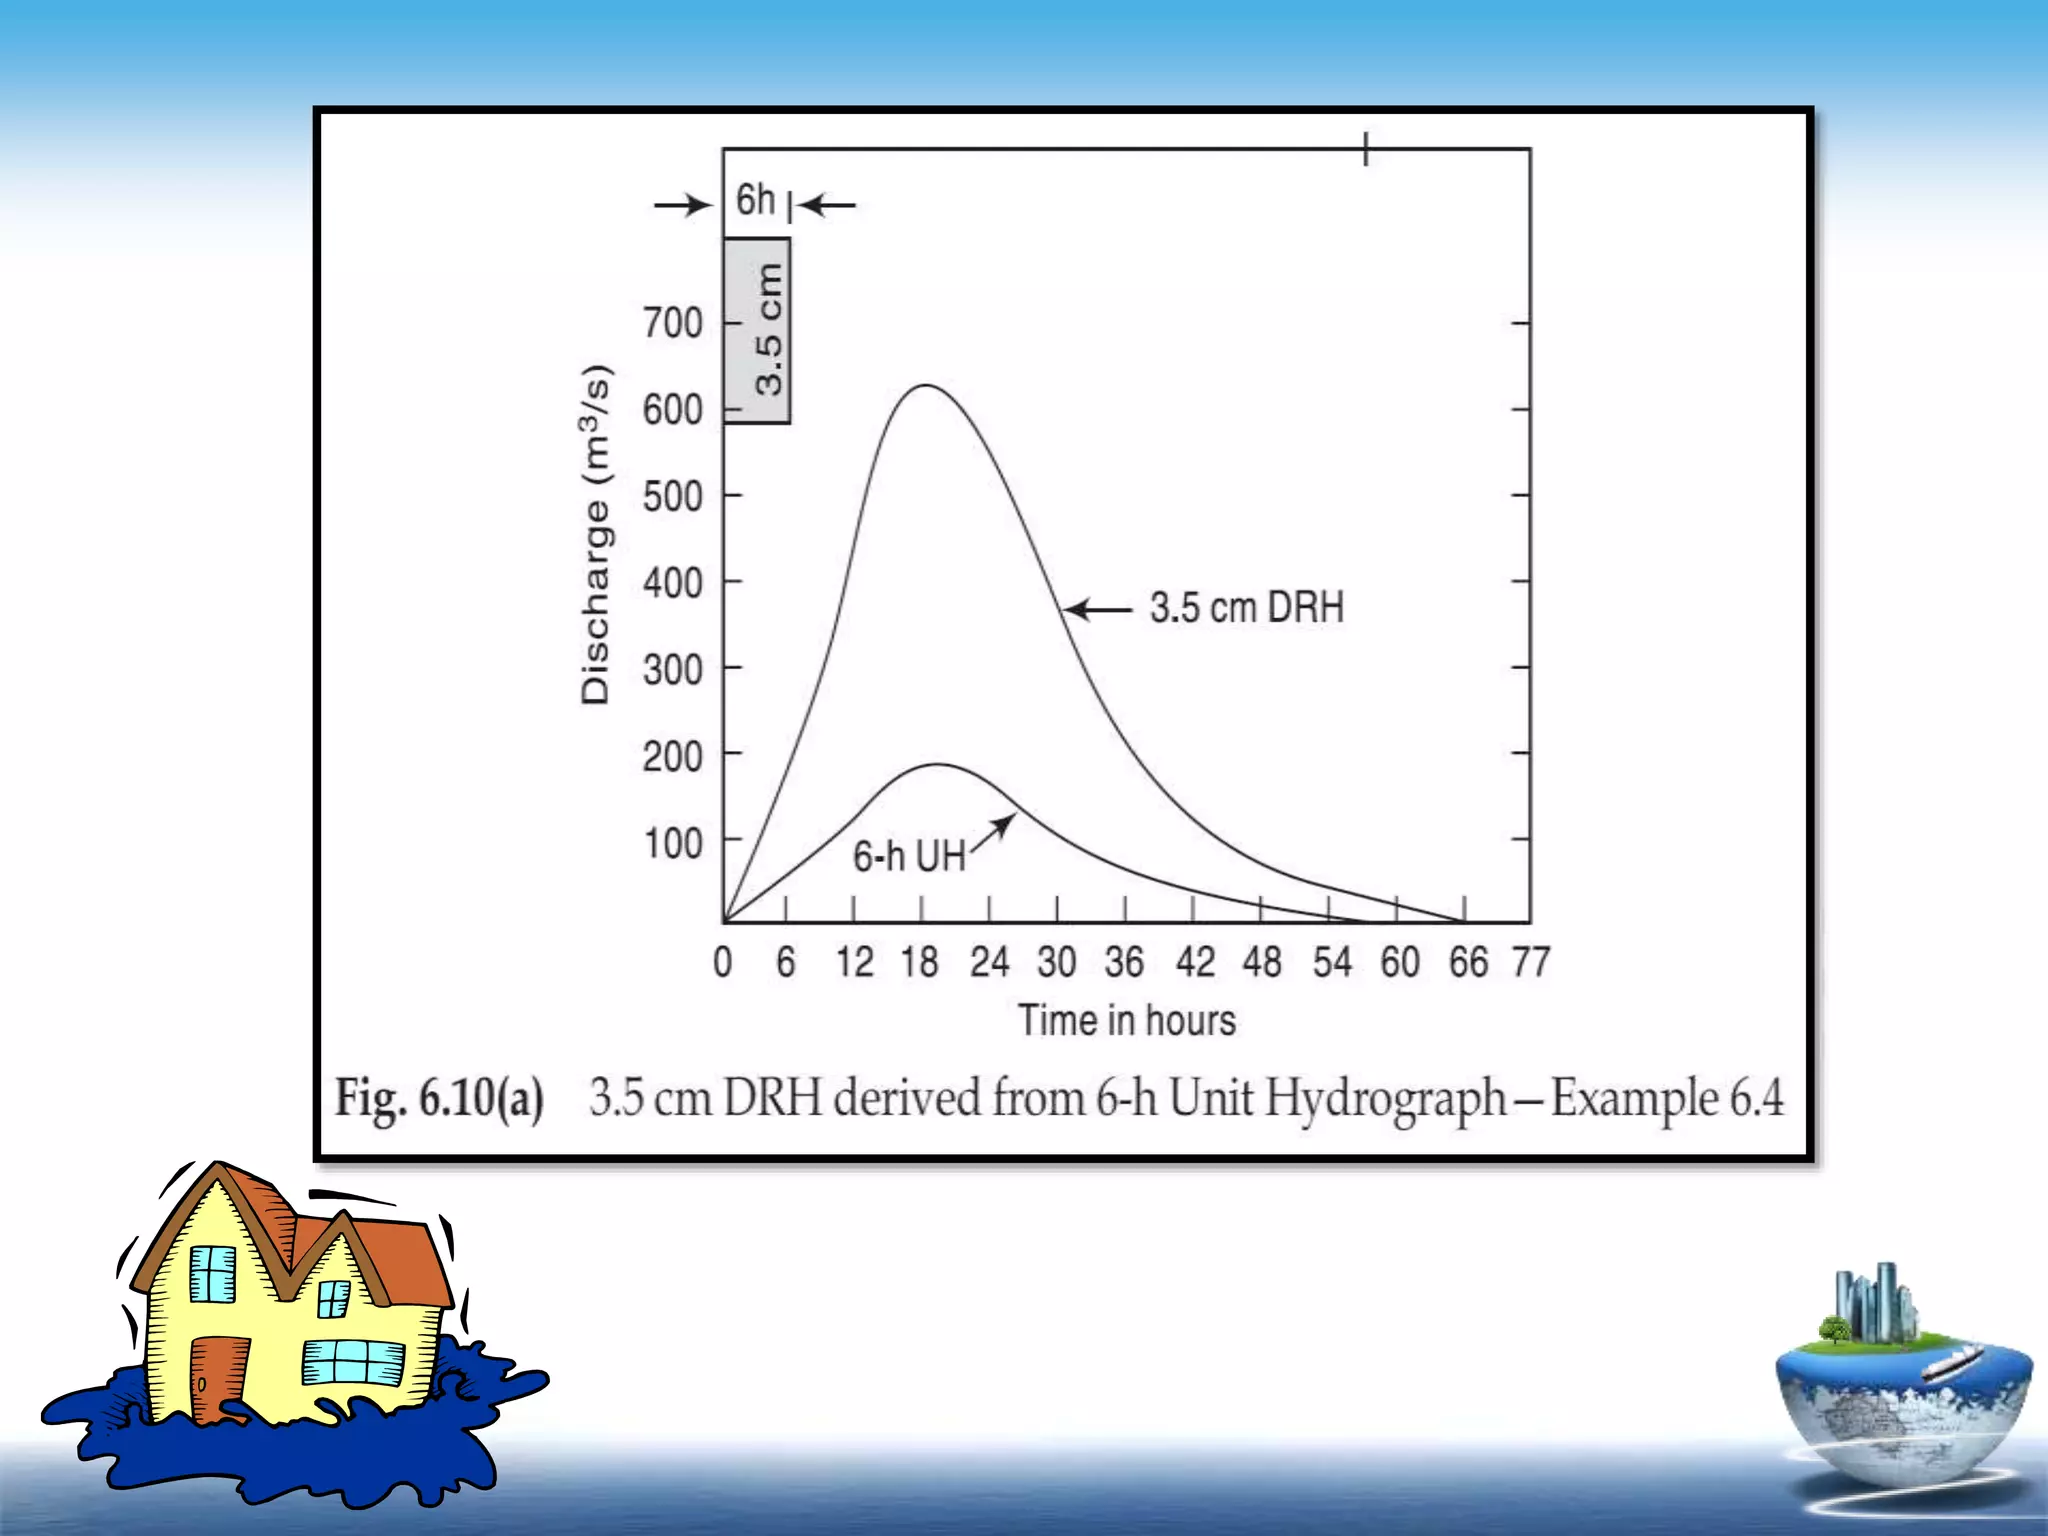
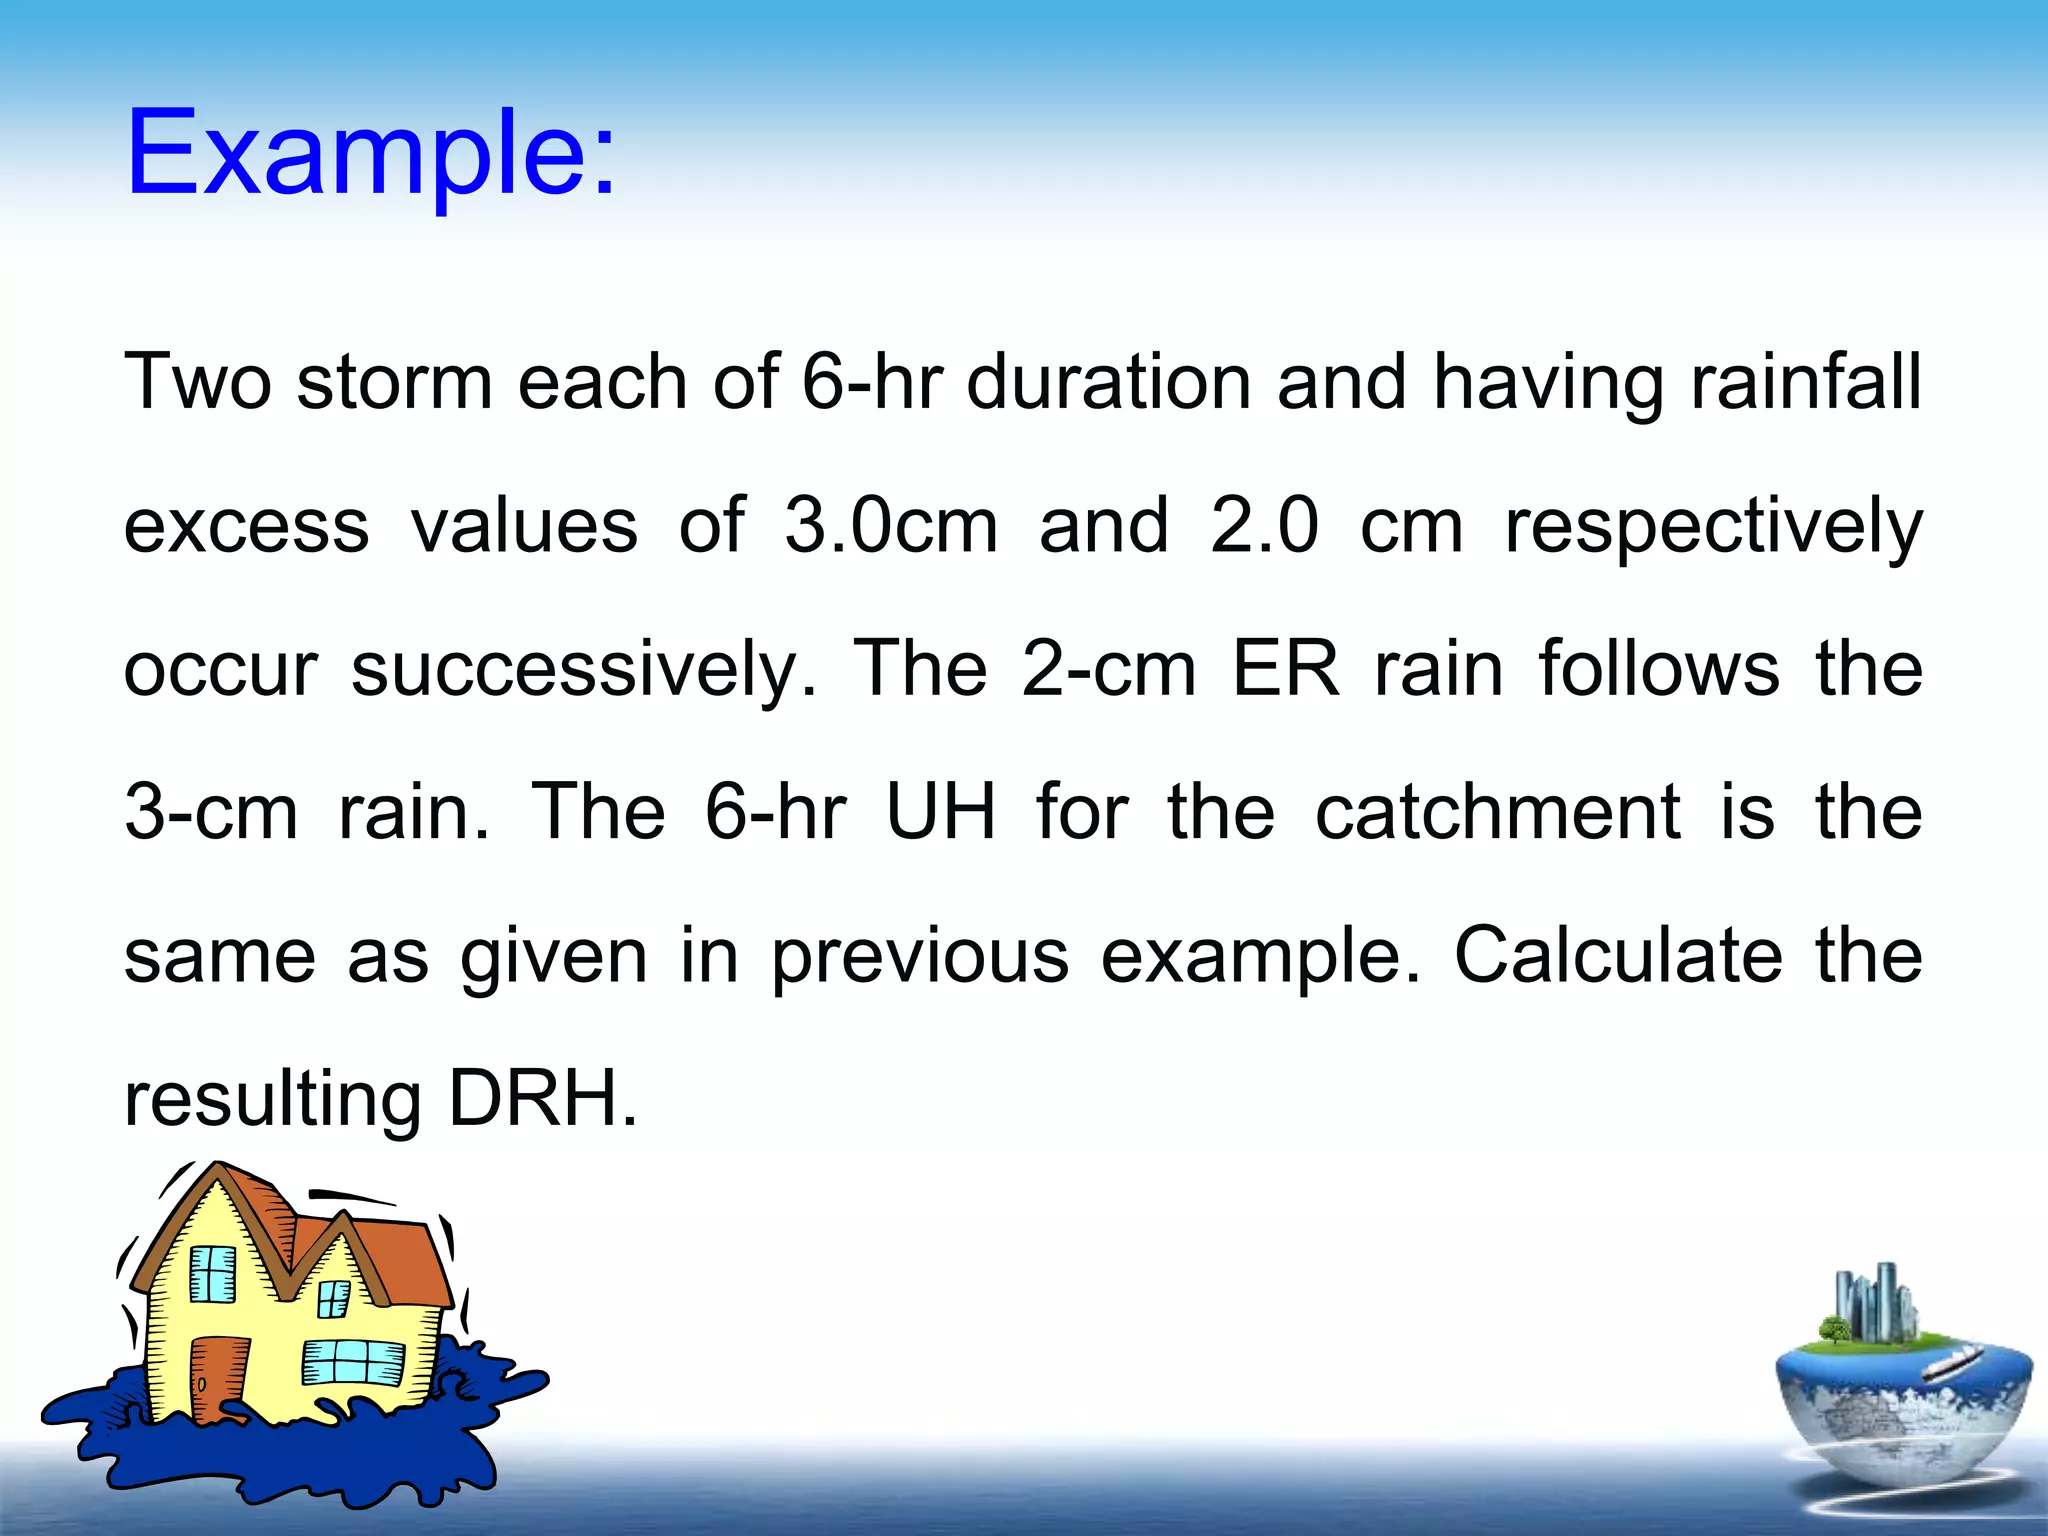
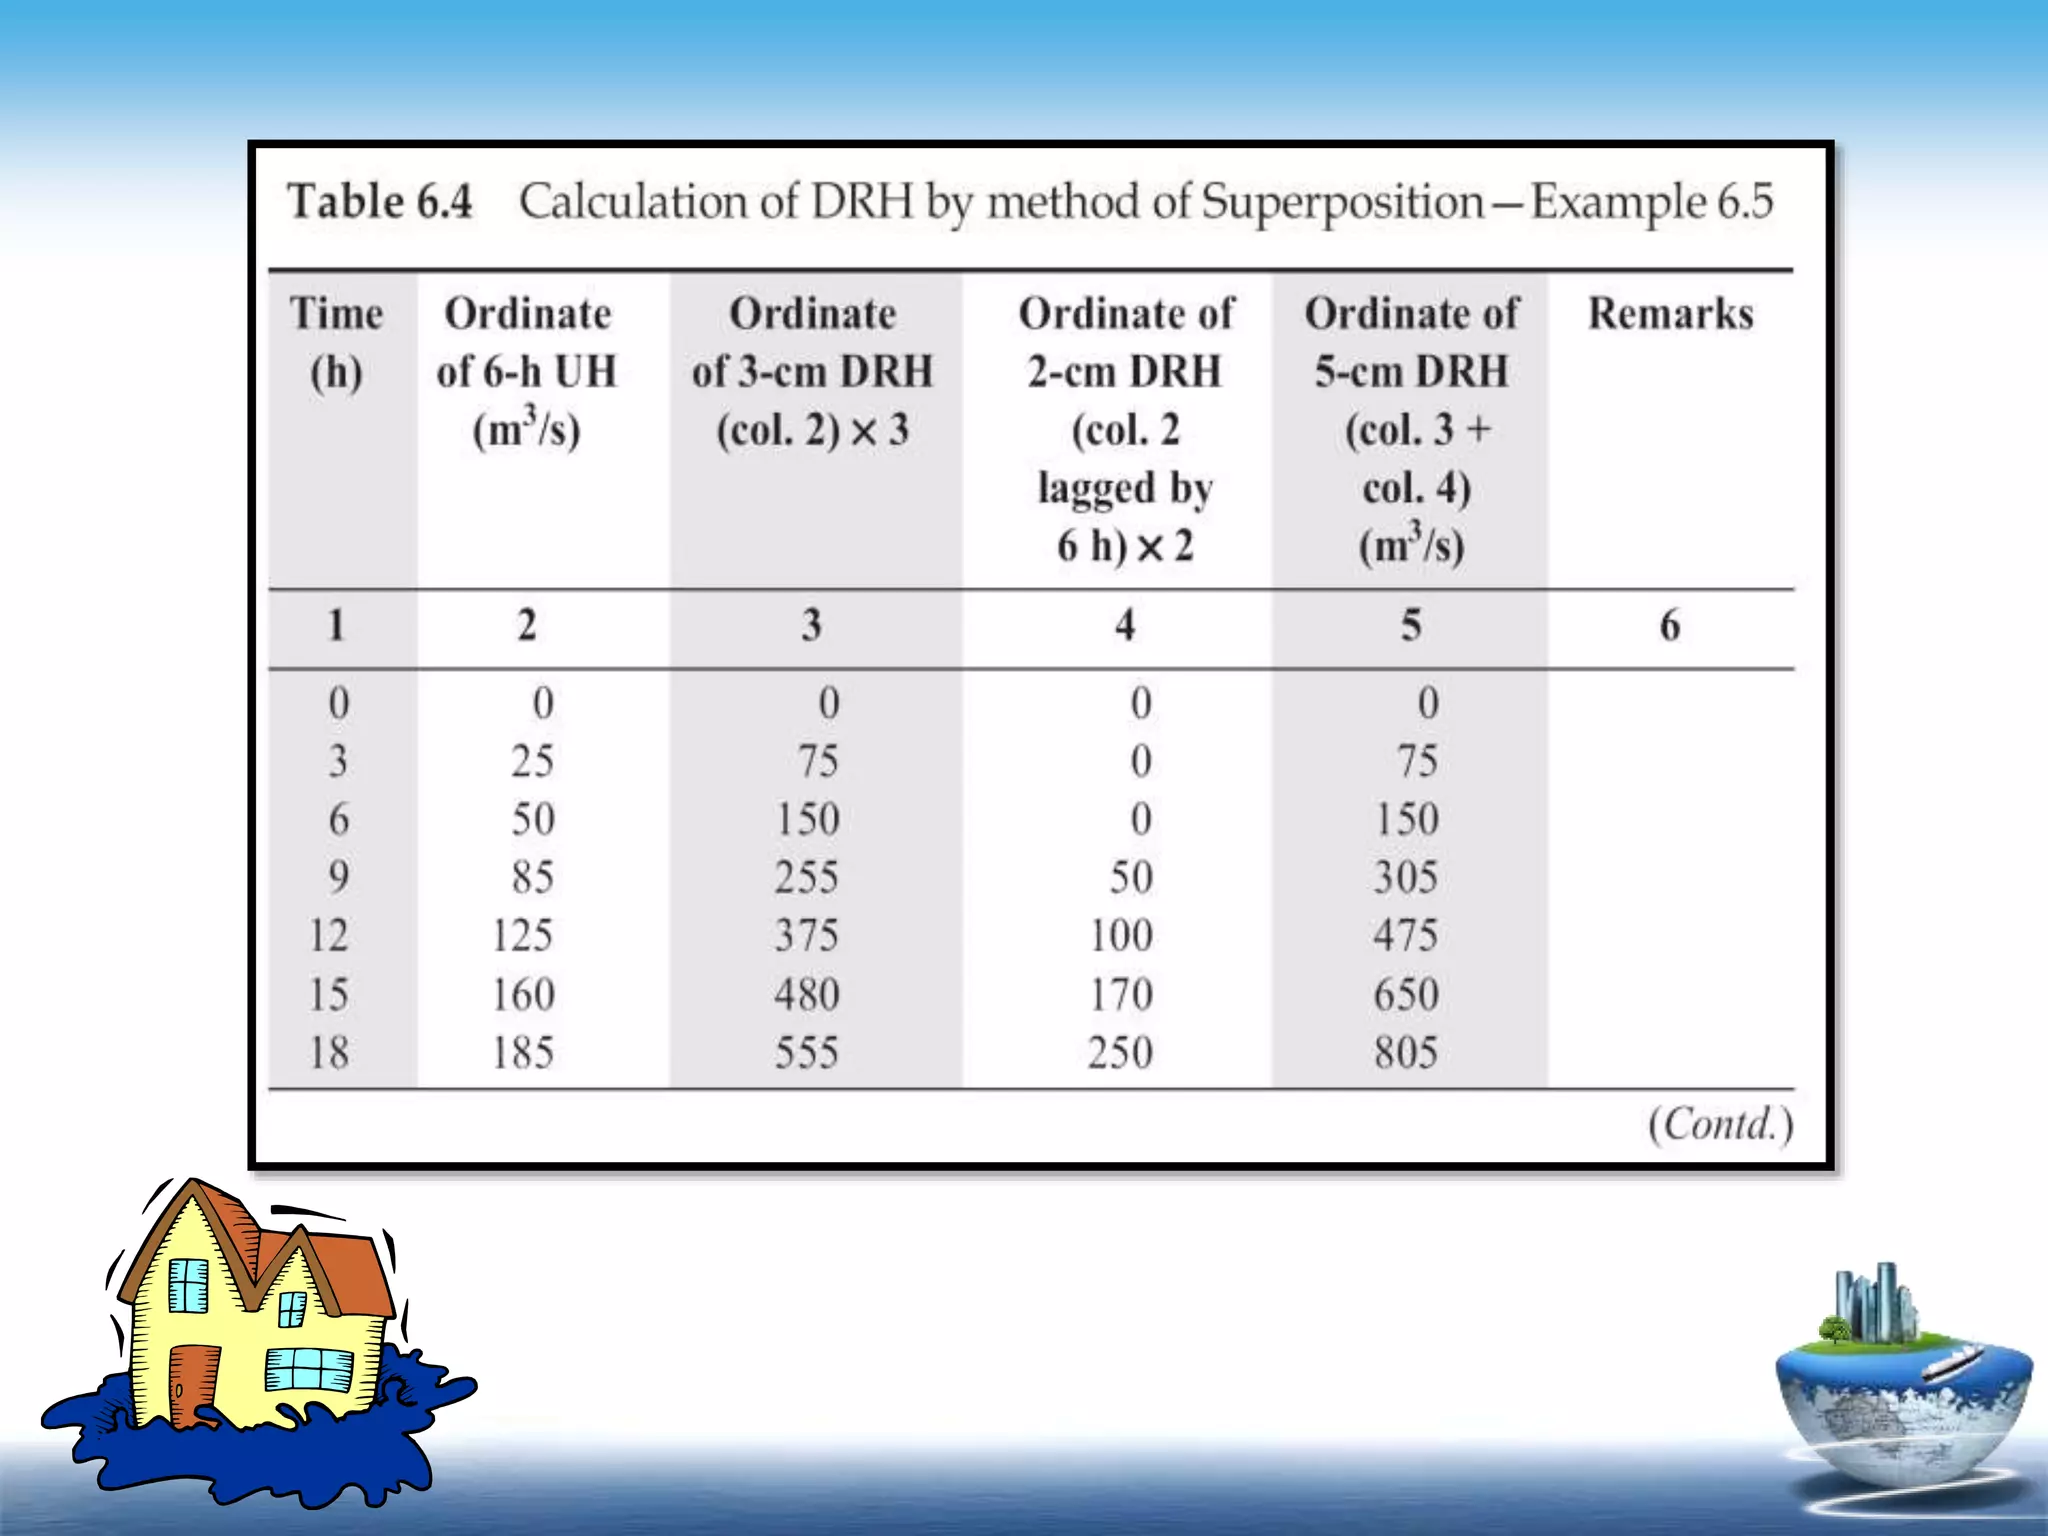
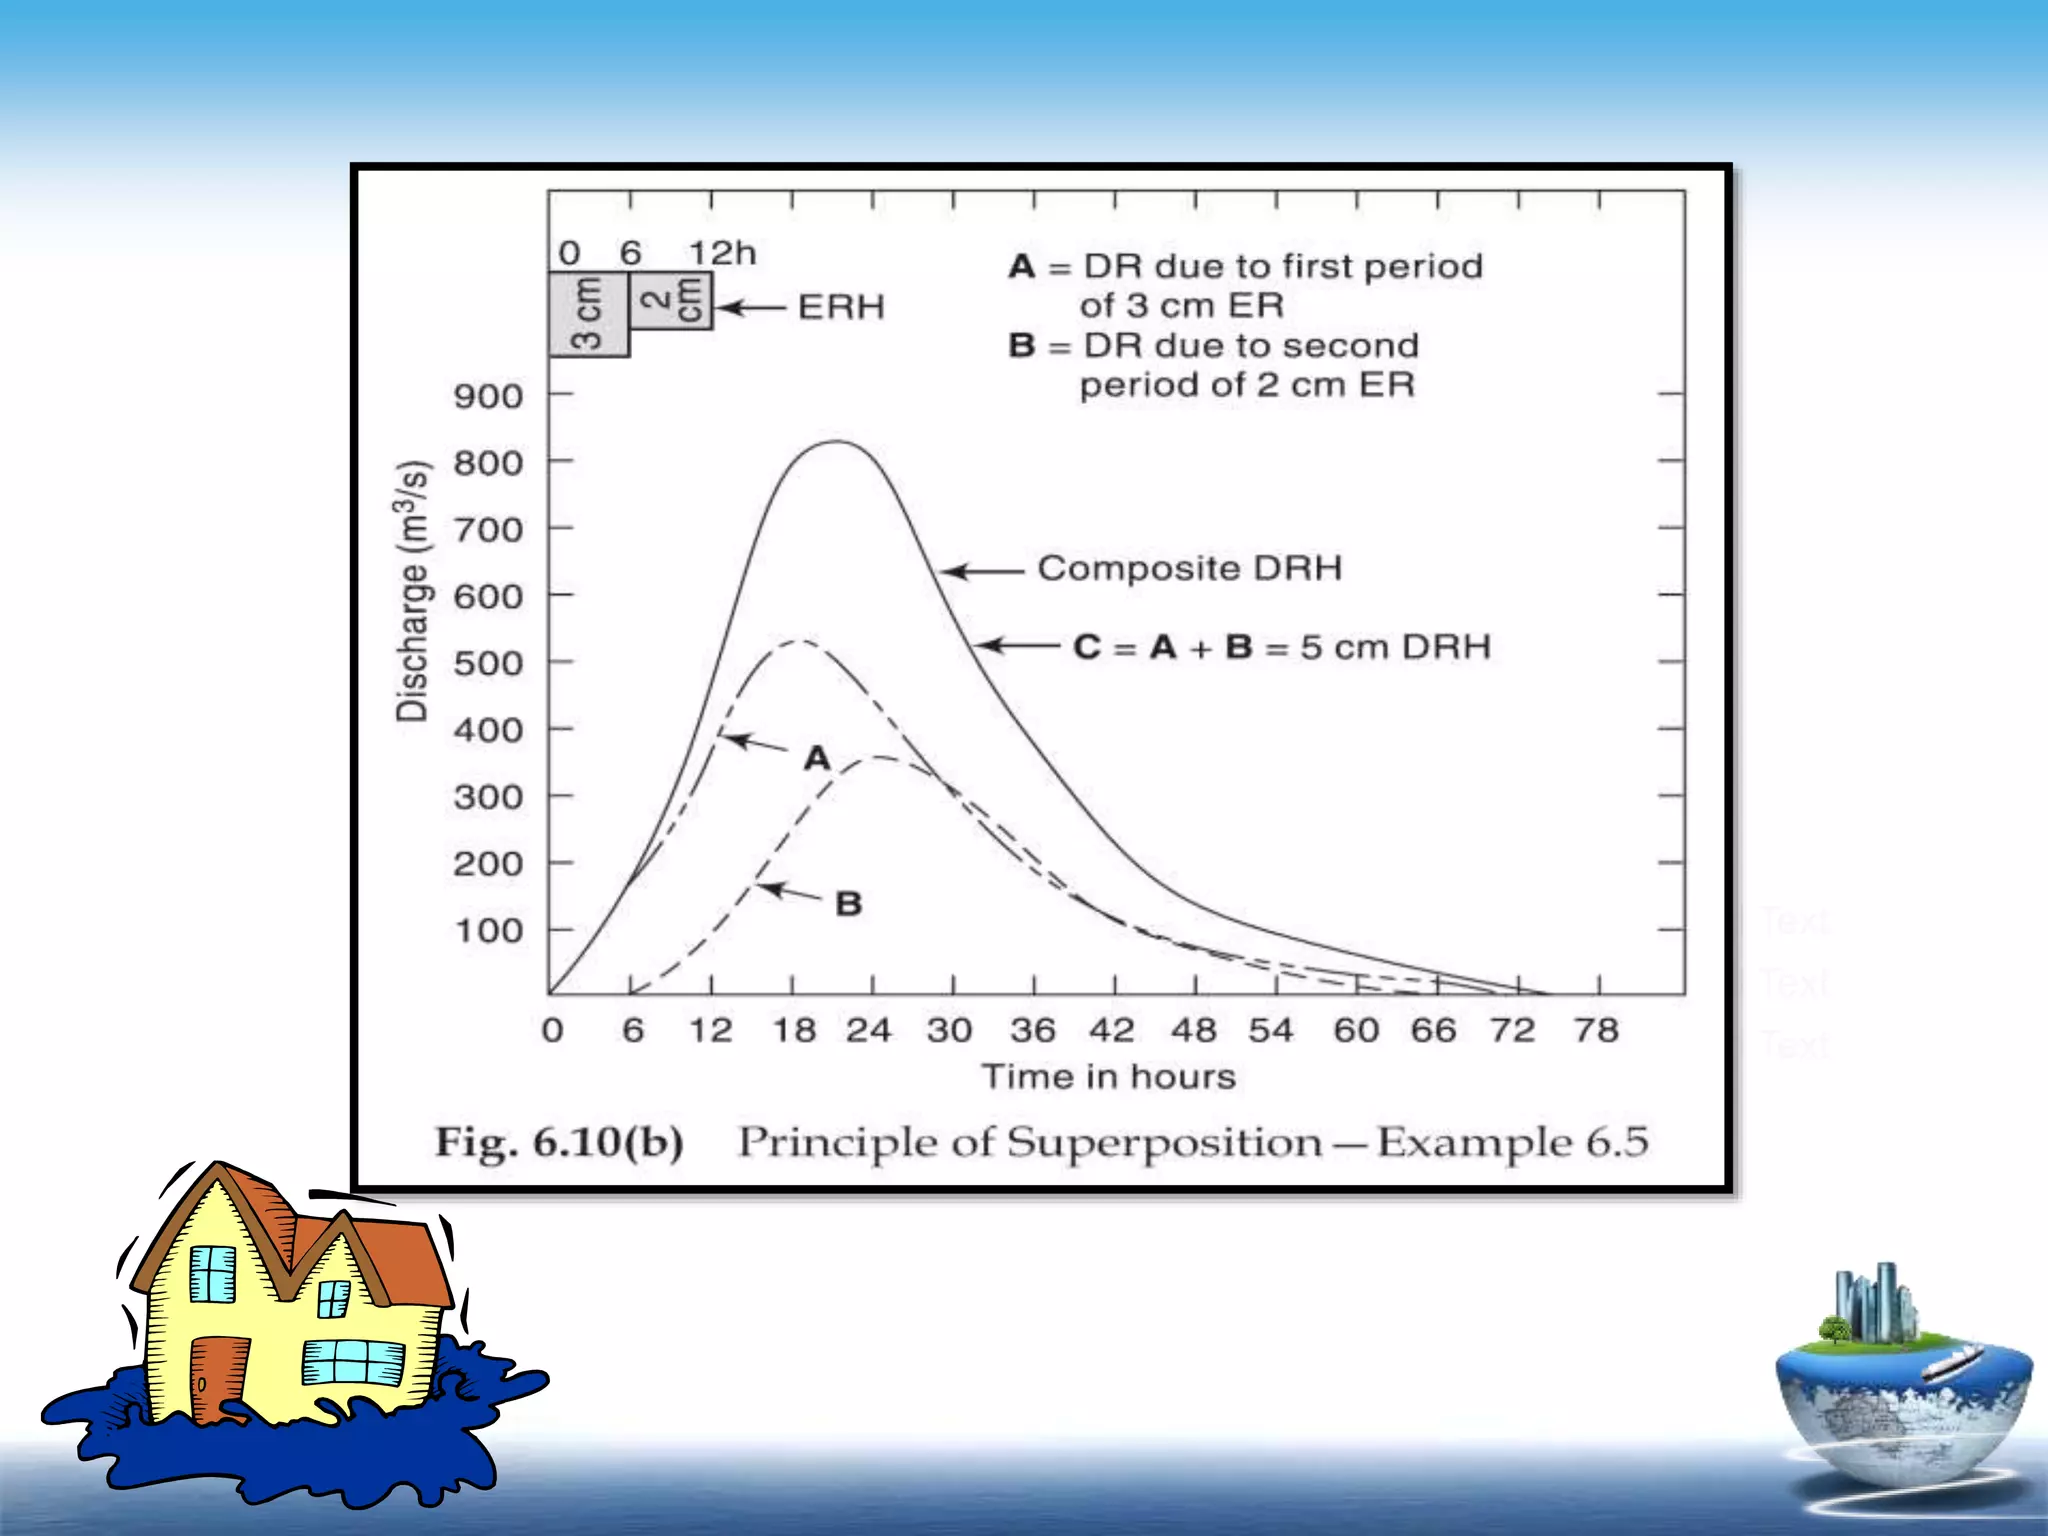
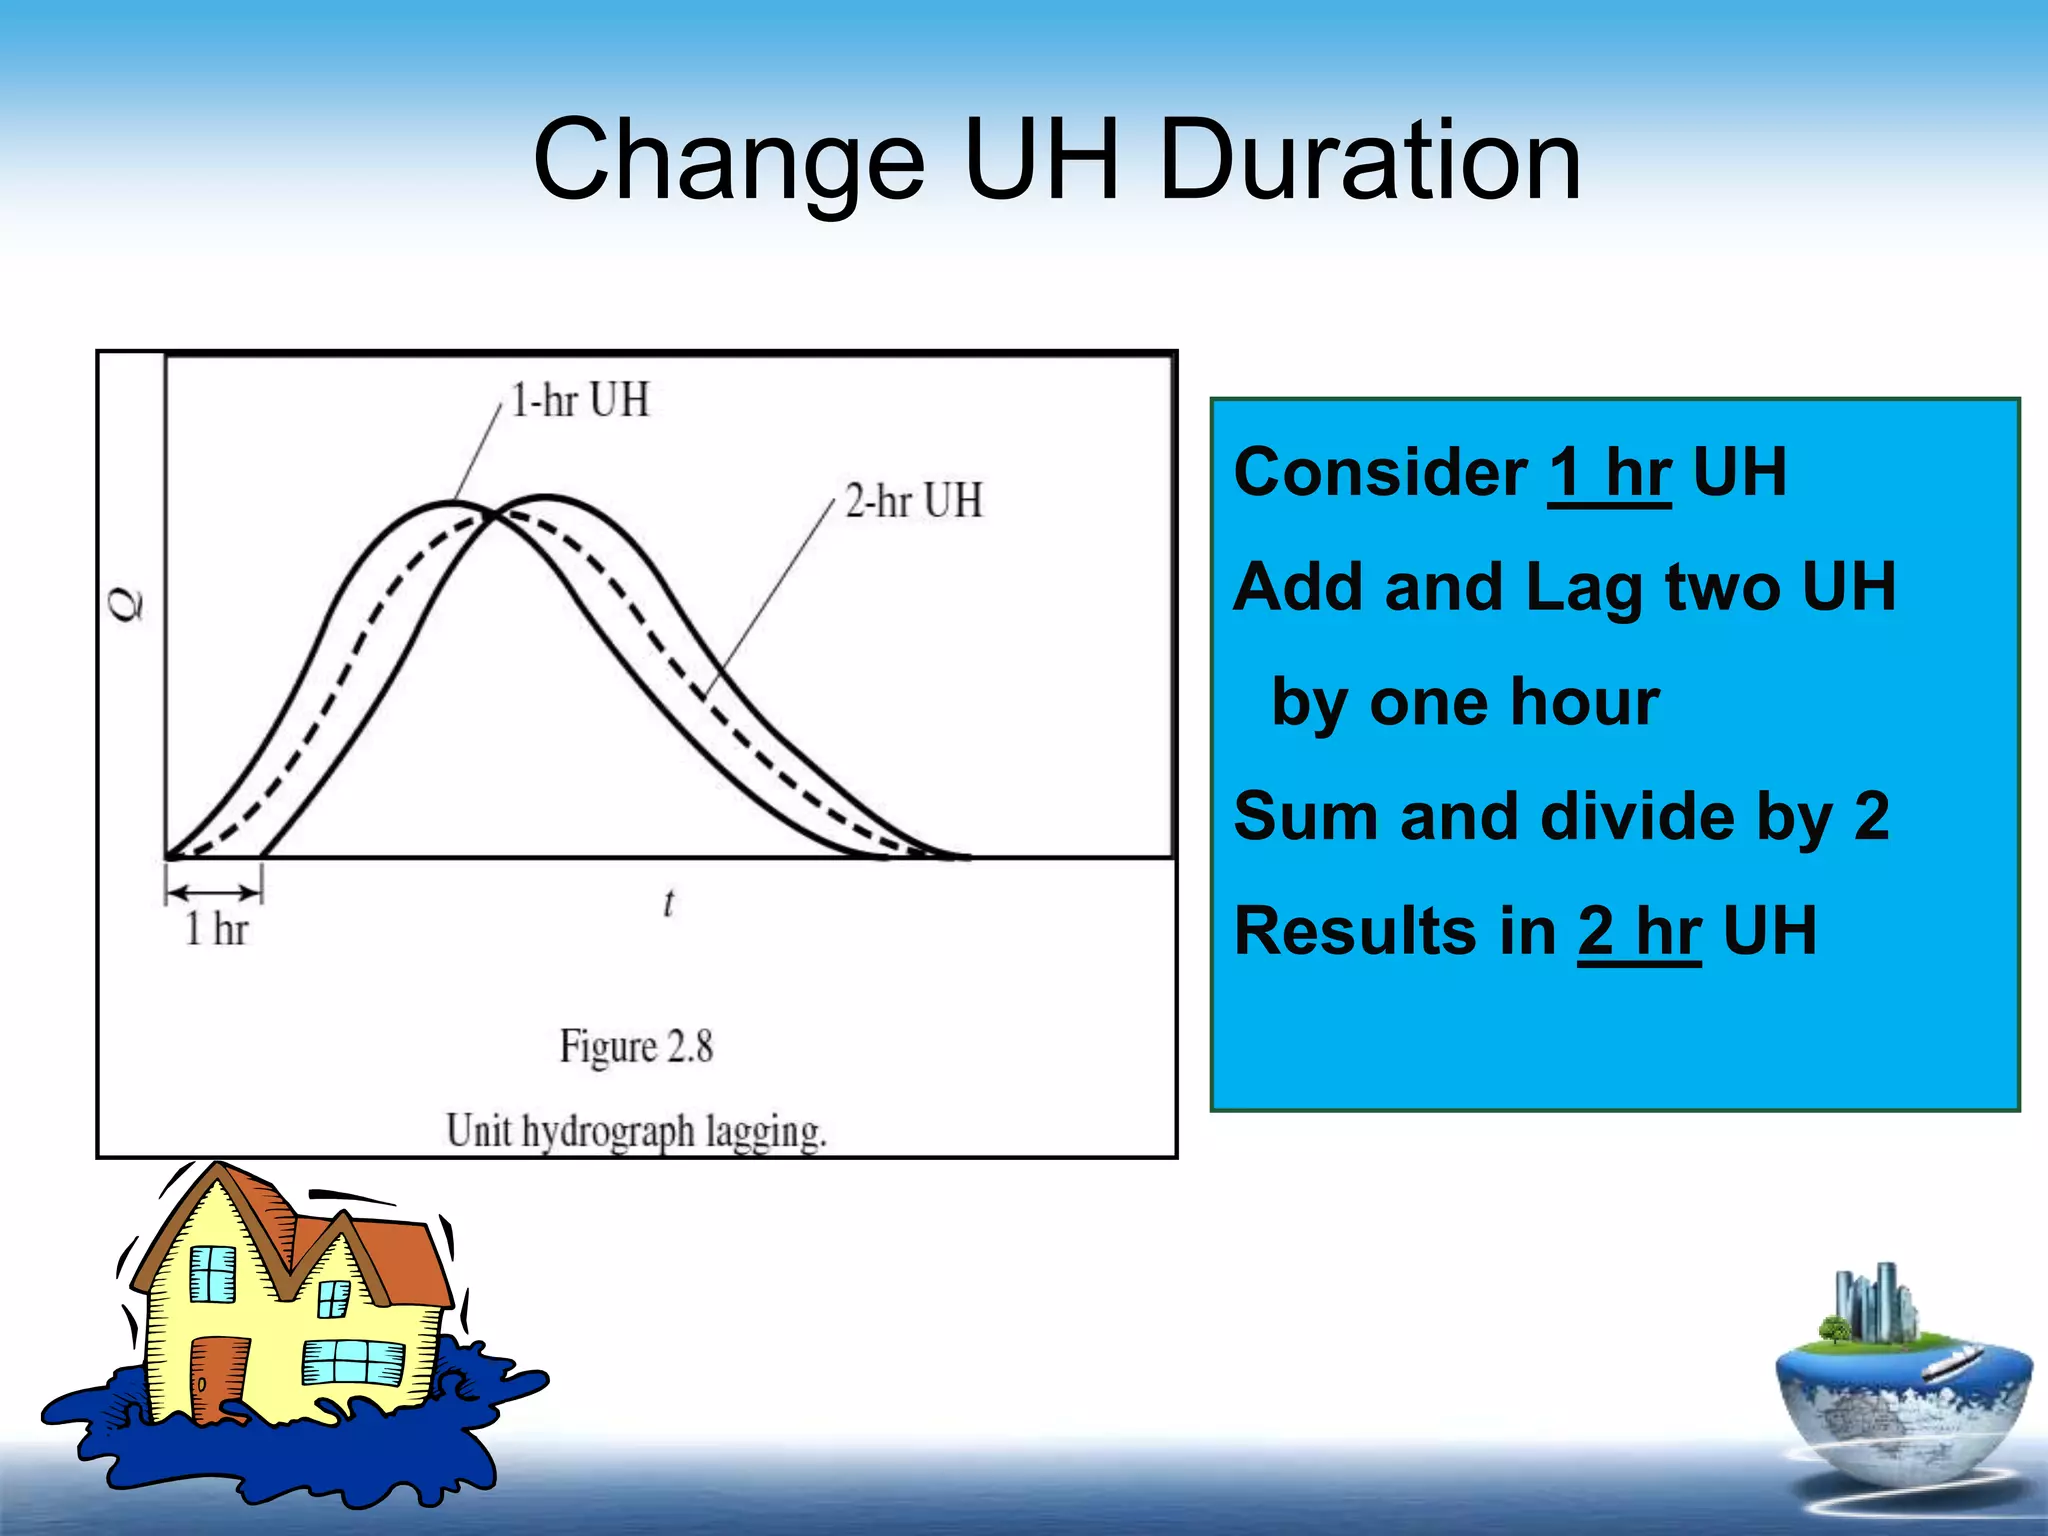
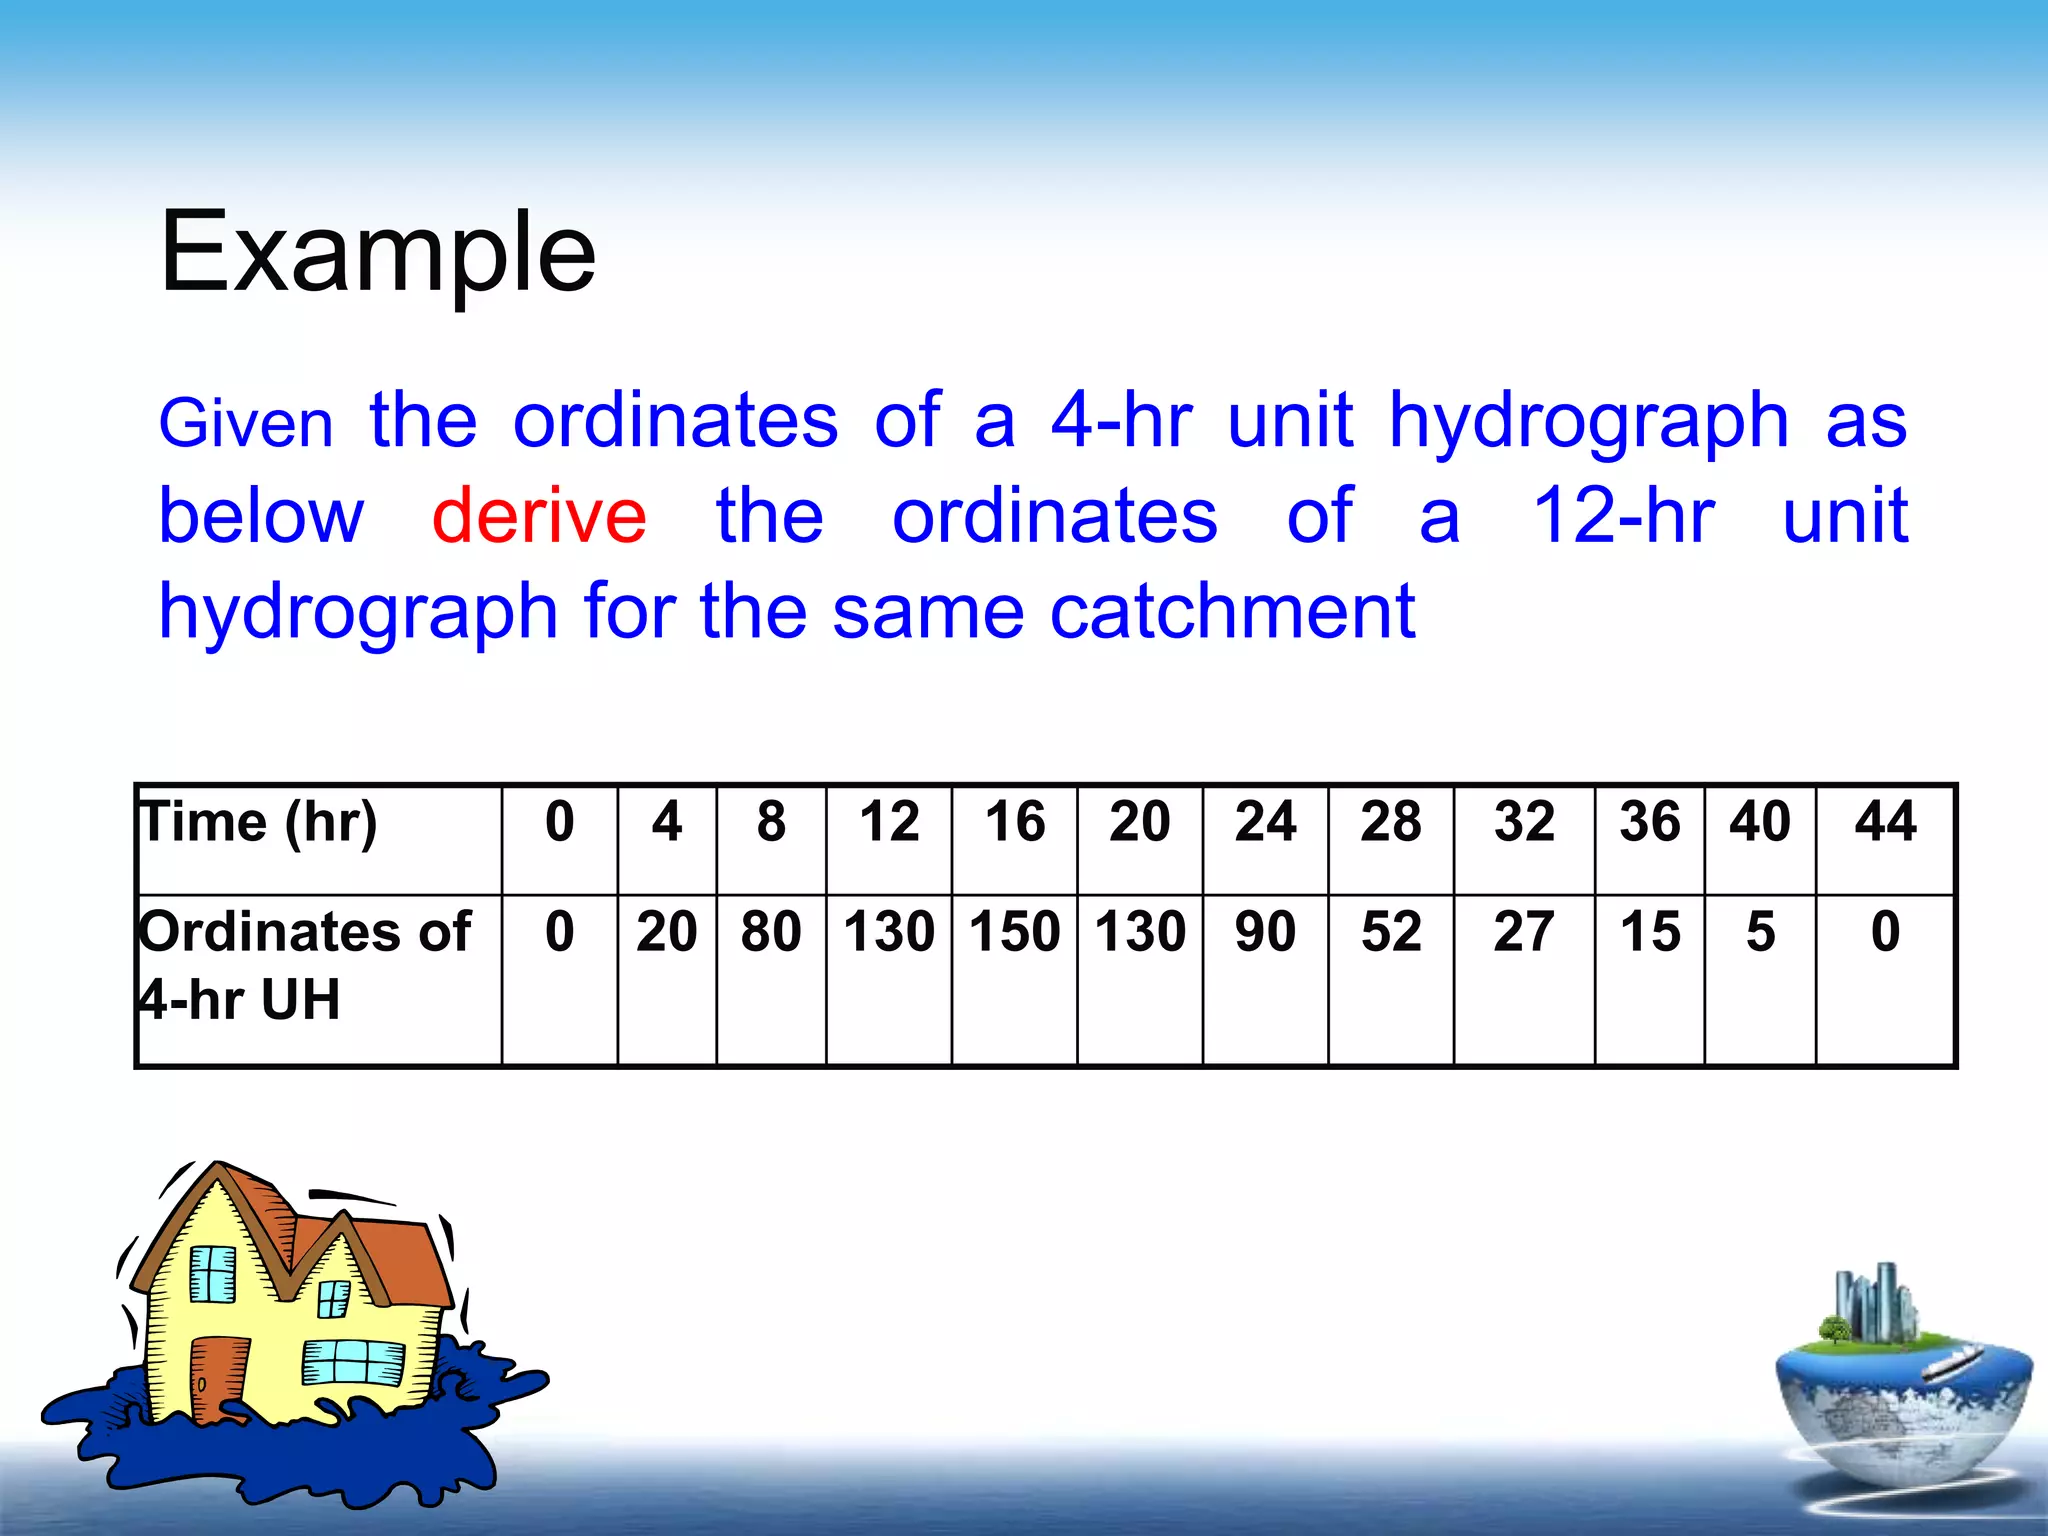
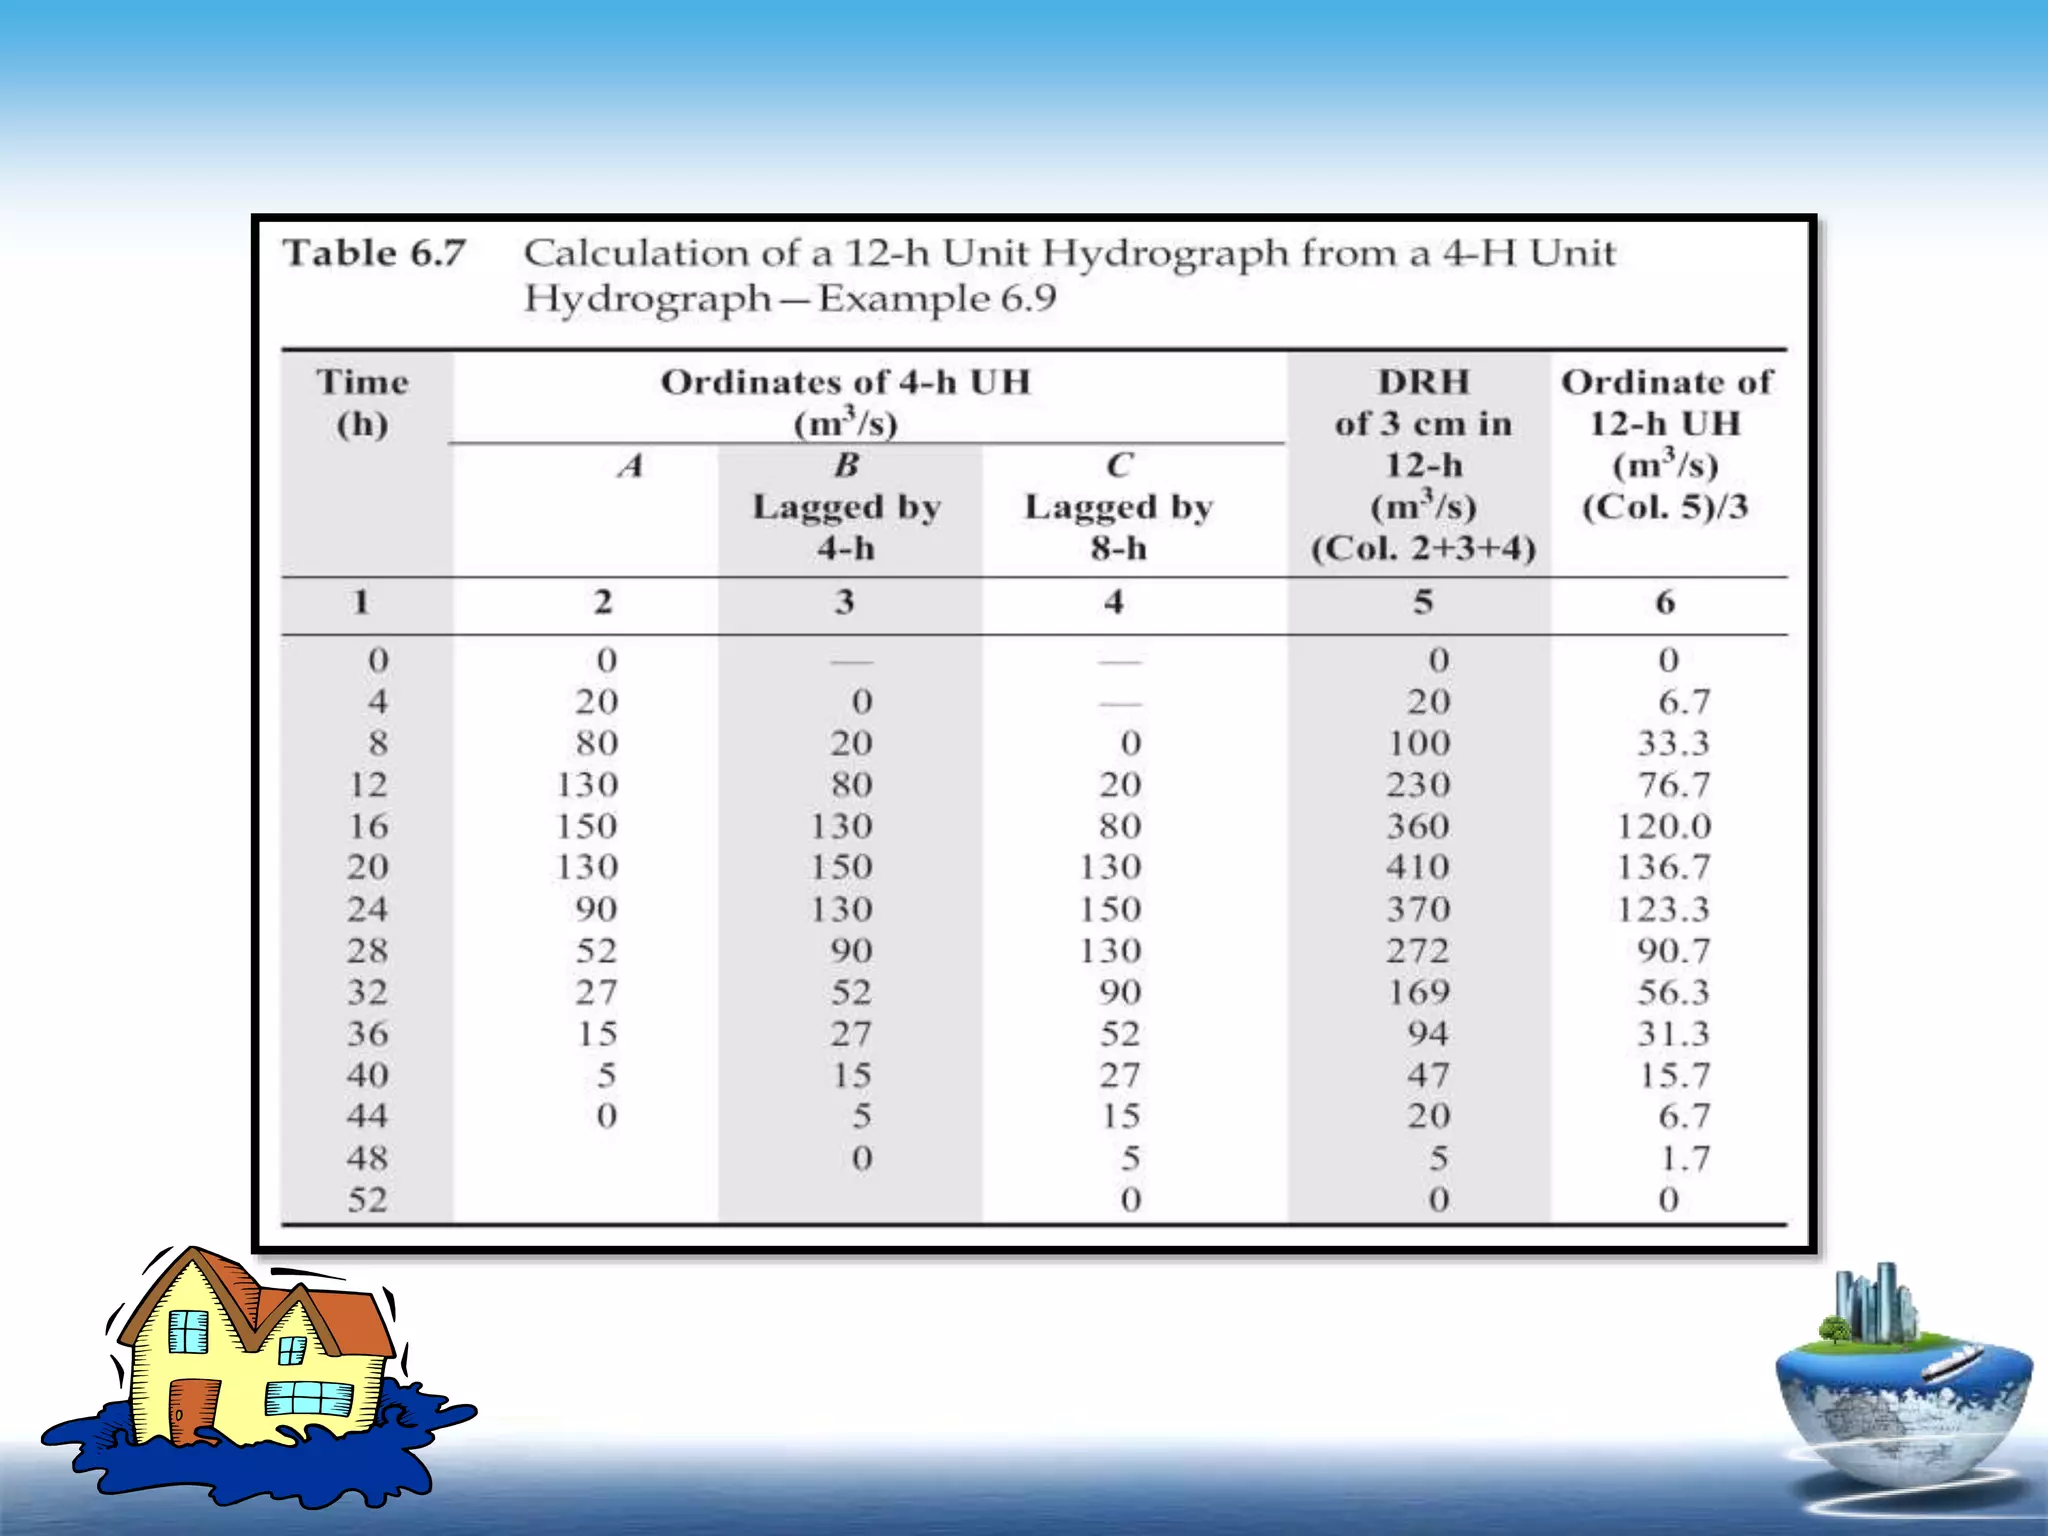
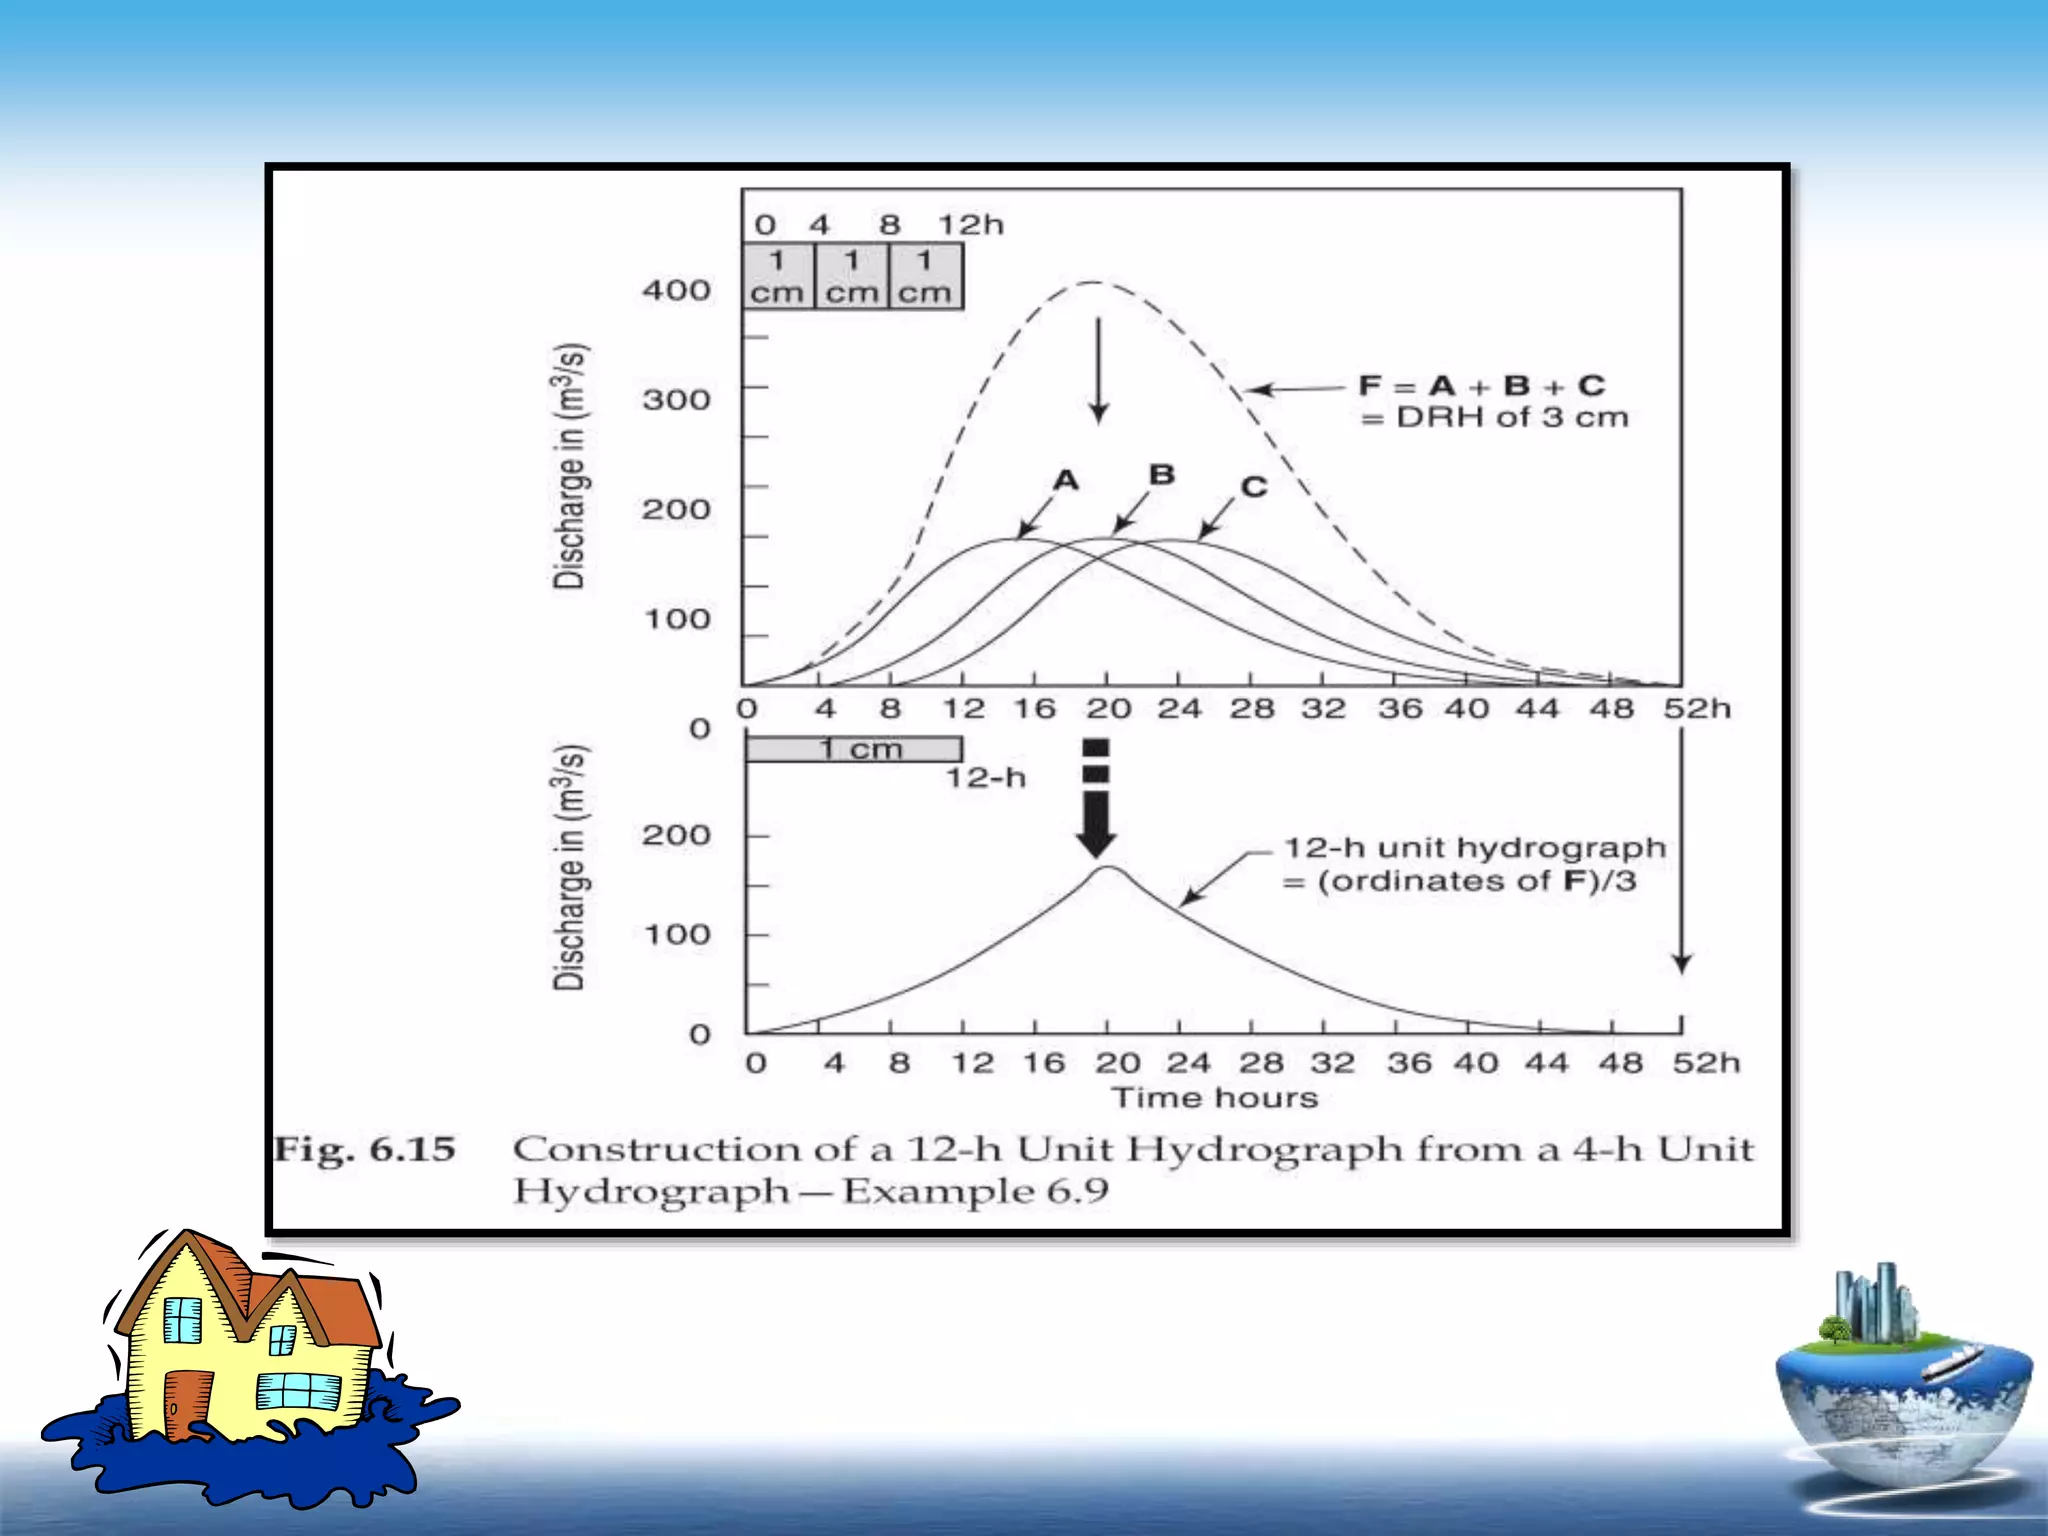
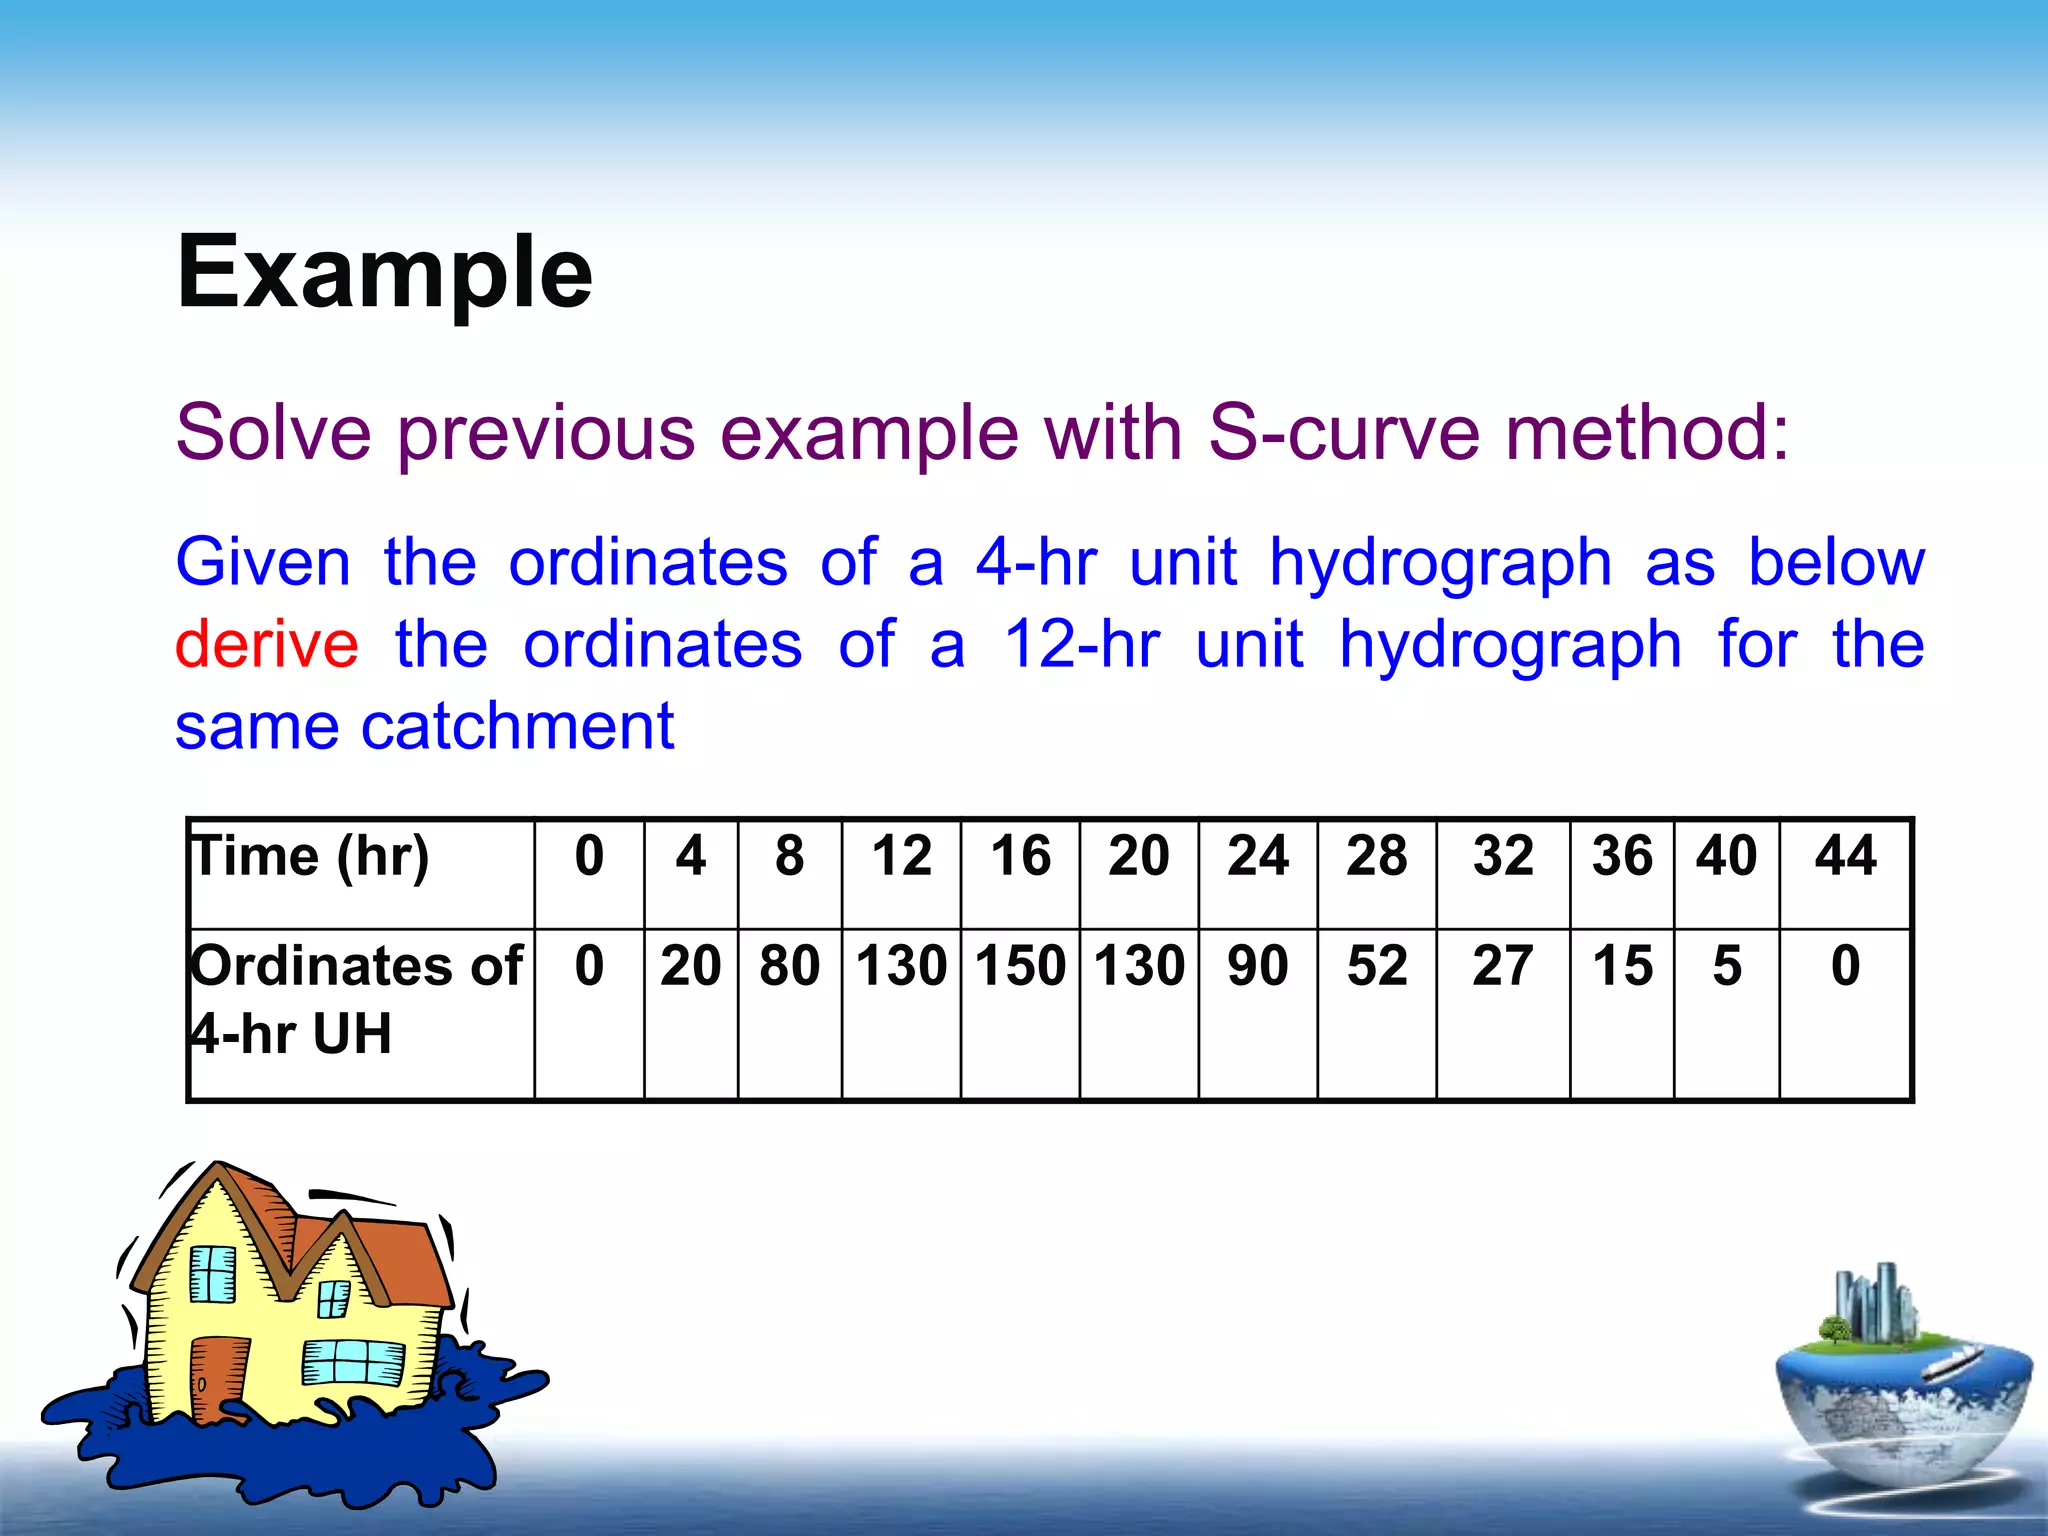
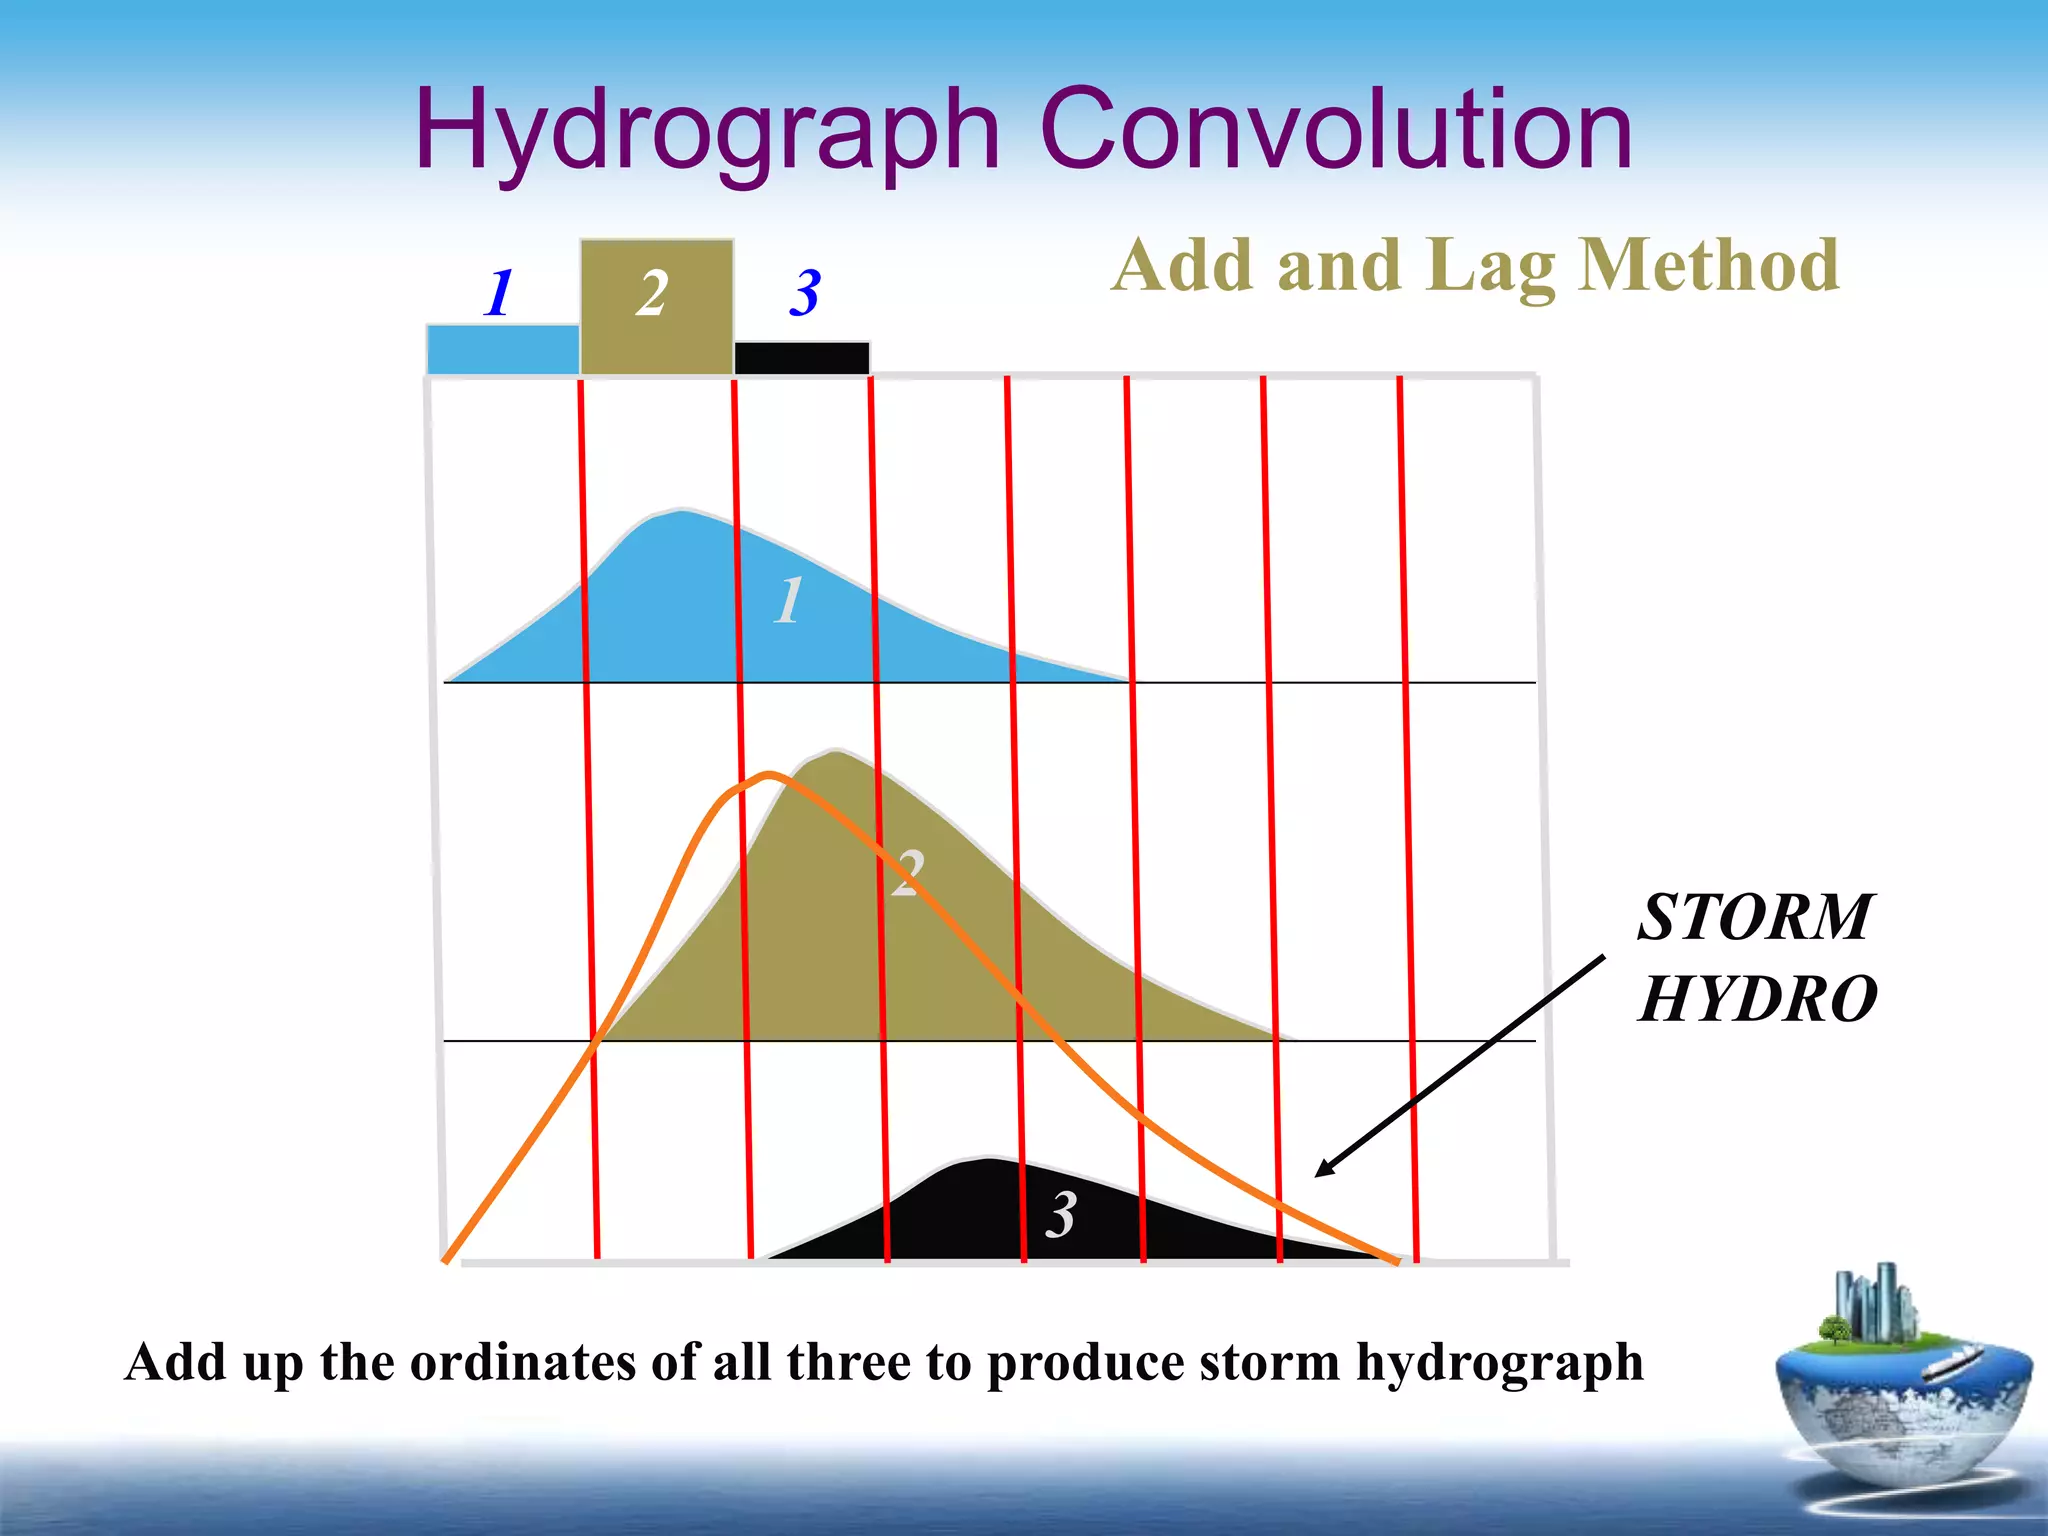
- Explaining how to create a unit hydrograph from streamflow data or synthetically, and how to apply it to calculate a direct runoff hydrograph from rainfall inputs.