This document proposes a new methodology to link ocean wave spectra to atmospheric circulation patterns (CPs) in order to improve wave modeling. The methodology involves:
1. Partitioning wave spectra into low frequency swell and locally generated wind waves.
2. Estimating the origin of swell waves using wave dispersion relationships and tracking algorithms.
3. Grouping swell wave origins by location or spectral characteristics.
4. Identifying and classifying CPs that correspond to swell wave origins using fuzzy logic.
5. Obtaining typical spectral characteristics associated with specific CPs that can then be used to model waves driven by different forcing mechanisms like tropical cyclones. The methodology is tested using wave data from South Africa.
International Journal of Engineering Research and Applications (IJERA) is an open access online peer reviewed international journal that publishes research and review articles in the fields of Computer Science, Neural Networks, Electrical Engineering, Software Engineering, Information Technology, Mechanical Engineering, Chemical Engineering, Plastic Engineering, Food Technology, Textile Engineering, Nano Technology & science, Power Electronics, Electronics & Communication Engineering, Computational mathematics, Image processing, Civil Engineering, Structural Engineering, Environmental Engineering, VLSI Testing & Low Power VLSI Design etc.
International Journal of Engineering Research and Applications (IJERA) is an open access online peer reviewed international journal that publishes research and review articles in the fields of Computer Science, Neural Networks, Electrical Engineering, Software Engineering, Information Technology, Mechanical Engineering, Chemical Engineering, Plastic Engineering, Food Technology, Textile Engineering, Nano Technology & science, Power Electronics, Electronics & Communication Engineering, Computational mathematics, Image processing, Civil Engineering, Structural Engineering, Environmental Engineering, VLSI Testing & Low Power VLSI Design etc.
Interfade Duration Statistics at Ku-band for Satellite Earth Links System in ...TELKOMNIKA JOURNAL
Fade dynamics is one of more important parameters when implementing Fade Mitigation
Techniques (FMTs) to counteract an excessive attenuation that affect satellite communication systems
operating above 10 GHz. The statistics of probable duration between two rain fade namely interfade
duration enables system operator to estimate how long the system will need to recover before the next
outage and assist in designing the FMTs. In this paper, interfade duration statistics have been derived from
one year of slant path attenuation measurements data collected in Equatorial Johor Bahru at 12.2 GHz
with elevation angle of 75.61o. The result had shown the dependency of number of events with attenuation
thresholds. Empirical interfade duration statistics are also obtained and suitable model distribution are
proposed.
Unit Hydrograph (UH) is the most famous and generally utilized technique for analysing and deriving flood hydrograph resulting from a known storm in a basin area. For ungauged catchments, unit hydrograph are derived using either regional unit hydrograph approach. Central Water Commission (CWC) derived the regional unit hydrograph relationships for different sub-zones of India relating to the various unit hydrograph parameters with some prominent physiographic characteristics. In this study, the lately developed UH model is applied located between Latitude 15º54′2′′ N to 16º16′19′′ N Latitude and 76º48′40′′ E to77º4′21′′ E Longitude. The study area covers an area of 466.02 km2, having maximum length of 36.5 km. The maximum and minimum elevation of the basin is 569 m and 341 m above MSL, respectively. The Peak discharge of unit hydrograph obtained is 171.58m3/s. The final cumulative discharge is 1669.05 m3/s.
Unit Hydrograph (UH) is the most famous and generally utilized technique for analysing and deriving flood hydrograph resulting from a known storm in a basin area. For ungauged catchments, unit hydrograph are derived using either regional unit hydrograph approach. Central Water Commission (CWC) derived the regional unit hydrograph relationships for different sub-zones of India relating to the various unit hydrograph parameters with some prominent physiographic characteristics. The Study Area is located between Latitude 15º57′58′′ N to 16º11′25.6′′ N and 77º18′1′′ E to77º32′5.3′′ E Longitude and covers area of 360.97 km2, having maximum length of 26.17 km. The maximum and minimum elevation of the basin is 533 m and 323 m above MSL, respectively. The Peak discharge of unit hydrograph obtained is 311.469 m3/s. The final cumulative discharge is 1458.55 m3/s.
Spatial-temporal Characterization of Hurricane Path using GNSS-derived Precip...CSCJournals
Global Navigation Satellite System (GNSS) precise point positioning (PPP) technique is capable of monitoring Precipitable Water Vapor (PWV) in high accuracy with low cost. As PWV is related to the initiation and development of a severe weather convective system, this study analyzed the characteristics of PWV variations over time and space to monitor and predict the path and the intensity of a severe rainfall during a hurricane. The PWV measurements are obtained by processing ground based GNSS data. The spatial and temporal variation of PWV and other meteorological variables are characterized for the time frames of before, during, and after the severe precipitation. The correlation effect between meteorological variables were mitigated by adapting a principle component analysis (PCA) and multivariate regression analysis. The method allows determining the expected movement of the rainfall up to 24 hours in advance. The proposed method was validated by analyzing the distribution pattern of the predicted PWV residual, its magnitude, and the actual observed PWV in the region. As a case study, we adopted one of the destructive and long-lived hurricane along the Florida, Georgia, North Carolina and South Carolina coast, namely, Hurricane Matthew, occurred in October 2016. From the experiment, we identified the areas closely fitting the prediction model by computing the residuals between the GNSS derived PWV measurements at each station in the test site. The residual of the predicted model is used for determining the track of extreme hurricane precipitation and potentially applied to evaluate its intensity. This study proved the effectiveness of the statistical model for forecasting the hurricane rainfall path that is potentially applied to a hazard early warning system.
International Journal of Engineering Research and Applications (IJERA) is an open access online peer reviewed international journal that publishes research and review articles in the fields of Computer Science, Neural Networks, Electrical Engineering, Software Engineering, Information Technology, Mechanical Engineering, Chemical Engineering, Plastic Engineering, Food Technology, Textile Engineering, Nano Technology & science, Power Electronics, Electronics & Communication Engineering, Computational mathematics, Image processing, Civil Engineering, Structural Engineering, Environmental Engineering, VLSI Testing & Low Power VLSI Design etc.
Hydraulic fracturing stimulation designs are moving towards tighter spaced clusters, longer stage length, and more proppant volumes. However, effectively evaluating the hydraulic fracturing stimulation efficiency remains a challenge. Distributed fiber optic sensing, which includes DAS and DTS, can continuously monitor the hydraulic fracturing stimulation downhole and be compared with other monitoring technology such as microseismic.
The DAS and DTS data, when integrated with the microseismic, highlight processes relevant to the completion design and allow for a better understanding and interpretation of each dataset.
This paper outlines a workflow to improve processing and interpretation of DAS and DTS data. In addition,
an estimate of the slurry distribution can be made. These methods will be demonstrated for a horizontal
Wolfcamp well in the Permian Basin. Here we compare key aspects of the microseismic, DAS, and DTS
results in several fracture stages to understand the downhole geomechanical processes. In order to interpret
the DTS data a thermal model is developed (using DTS data) to simulate the temperature behavior after
pumping has ceased. A slurry distribution is obtained by matching the simulated temperature with the
measured temperature from DTS. In addition, the DAS data signal is studied in the frequency domain and
the dominant frequencies are identified that are mostly related to fluid flow and to reduce the background
noise. This time frequency analysis enhances the ability to monitor and optimize well treatments.
After reducing the background noise, the acoustic intensity is correlated to the slurry distribution. The fluid
distribution data from DAS and DTS are compared with the microseismic and near field strain to better
understand the completion processes. We utilized fiber optic microseismic to better understand and
compare it to conventional microseismic.
Finally, we highlight the dynamics of strain and microseismic signature as fluid moves from an offset well
completion into the prior stimulated fiber well to better understand the reservoir and far field effects of the
completion.
Evidence for Long-Lasting Electrical Leader Discharges in NonSpecular Meteor ...researchinventy
Unusual, non-specular, fast-movingmeteortrail echoes are observed in the summer polar upper mesosphere near 90 km.Usually, at mid-latitudes, field-aligned irregularities cause non-specular trails, while in the polar region long-lasting irregularities are possibly sustained by charged meteor dust.The unusual meteor trails propagate downward and upward at speeds of 3.3-6.4 kms-1 along a slanted path length of 10.4 km between 87-93 km altitudes, merging in the middle and lasting for 8-10s. Here we propose that an electrical discharge is responsible for these trails. The corresponding horizontal electric field for the observed speeds is estimated up to 16.3 Vm-1 at 90 km.Both the long-lasting merging of two fast-moving plasma trails and the modest speed compared to those (~104 -105 ms -1 ) of lightning leader process and of jets (< 400 ms) occurring above thunderclouds likely suggest a new type of meteor-trail leader discharge occurring in the summer polar upper mesosphere
Brown Bag Lunch: Longreads, in-depth writing for a wider a publicMiriam Rasch
Presentation on the use of longreads and longform in disseminating research on the creative industries and the launch of the publication series INC Longform. Held by Miriam Rasch of the Institute of Network Cultures at the University of Applied Sciences Amsterdam, for colleagues within create-it research center.
Tropospheric Scintillation with Rain Attenuation of Ku Band at Tropical RegionTELKOMNIKA JOURNAL
Tropospheric scintillation can become a significant impairment in satellite communication systems, especially in tropical regions with frequencies higher than 10 GHz, the attenuation is dramatically affecting the scintillation. This work concentrates on those aspects in equatorial Johor Bahru, Malaysia, based on a one-year Ku-band propagation measurement campaign, utilizing the equipment of Direct Broadcast Receiver (DBR) and Automatic Weather Station (AWS). This study investigates the relationship between wet scintillation and rain attenuation using experimental measurement and concentrate on the probability density function (PDF) of different scintillation parameters. From the results, it is concluded that wet scintillation intensity increases with rain attenuation. Thus, the relationship can be phrased by linear equations or power-law. The PDFs of wet scintillation intensity, adapted to a given rain attenuation level, are found lognormally distributed, leading to selection of method for determining the relation between conditional PDFs and rain attenuation.
An Extended Tropospheric Scintillation Model for Free Space Optical Communica...ijeei-iaes
Fluctuations caused mostly by tropospheric scintillation at the free space optical receiver end have been a major problem in the rapid development of telecommunication and the increasing demands for larger bandwidth is forcing the use of free space optical (FSO) technology. This paper examined existing tropospheric scintillation models of Karasawa, Van de Kamp model, Otung, Ortgies and ITU-R, and discovered that all of them operate at the microwave range, which limits their application in FSO laser beam technology that operates in PHz frequency-range. ITU-R model was later selected owing to its global application and modified for use in FSO communication system. The new model can serve as basis for communication engineers to use as platform in the link budgetary for planning and design of low margin systems of free space optical communication link.
A Numerical Simulation for Predicting Sea Waves Characteristics and Downtime ...Professor Kabir Sadeghi
In this paper, a numerical simulation of sea wave characteristics and operation
downtimes of offshore structures is presented. The simulation was based on available
wind data and seawater temperature recorded by an oceanography buoy installed in
the Caspian Sea. Wave characteristics were simulated for deepwater parts of the
Caspian Sea by applying the Bretschneider spectrum and equations using following
recorded data: wind velocity, wind duration, fetch length, and water/air temperature
differences. Since recorded wave data were only available for a one-year period, they
were solely used for validation of the simulation results with recorded data but for
not the simulation itself. Some practically established thresholds for wave velocity,
wave period, and wind velocity were considered as constrains, limiting the operation
of offshore installations. The numerical simulation model revealed that it is possible
to operate offshore installations for 250 days per year in the southern parts of the
Caspian Sea. A worst-case scenario showed that the maximum waiting time for
restarting the offshore installations is 17 days. Considering the swell parameter, it
was concluded that the annual downtime period of offshore installation operations in
southern parts of the Caspian Sea is about one third of a year and the maximum
waiting time for this operation is about two third of a month.
International Journal of Research in Engineering and Science is an open access peer-reviewed international forum for scientists involved in research to publish quality and refereed papers. Papers reporting original research or experimentally proved review work are welcome. Papers for publication are selected through peer review to ensure originality, relevance, and readability.
International Journal of Engineering Research and Applications (IJERA) is an open access online peer reviewed international journal that publishes research and review articles in the fields of Computer Science, Neural Networks, Electrical Engineering, Software Engineering, Information Technology, Mechanical Engineering, Chemical Engineering, Plastic Engineering, Food Technology, Textile Engineering, Nano Technology & science, Power Electronics, Electronics & Communication Engineering, Computational mathematics, Image processing, Civil Engineering, Structural Engineering, Environmental Engineering, VLSI Testing & Low Power VLSI Design etc.
2. within one. By partitioning the wave spectra and cross assigning the
wave partitions we can define actual independent events without
requiring a subjective inter-event time period.
In this paper we discuss a method of estimating the spectral charac-
teristics of waves caused by various forcing mechanisms using a
partitioning and swell tracking algorithm and then linking them to
atmospheric CPs. We initially describe the proposed methods of linking
wave spectrum characteristics to the CPs (Section 2). Results from our
case study site at Durban, South Africa are then presented (Section 3).
Finally we discuss the results and the limitations of our approach
(Section 4).
2. Methods
In order to link wave spectral characteristics to CPs we need to
estimate the origin(s) of the waves. The waves produced near the
coast are typically forced by local winds that do not have a long enough
fetch to develop a significant amount of wave energy. For this reason
we are interested in swell waves that develop far offshore and are
driven by large scale circulation patterns. These swell waves generally
have higher energies and are of particular interest for coastal engineering
applications.
To estimate the origin of swell waves we first have to ensure that we
are only considering the swell component of the total wave energy. The
energy spectra are therefore partitioned into unique swell and wind
waves by means of a partitioning algorithm (Section 2.2). The spectral
partitions are then cross assigned into a collection of independent
swell events (Section 2.3). Using the linear wave theory deep water
wave dispersion relationship and spherical geometry the swell origins
can be estimated (Section 2.3.2). The origins of the events are then
grouped by location or spectral characteristics (Section 2.3.3). The
grouped origins are then used to search the global geo-potential height
data during the times when the swell is estimated to have been pro-
duced (Section 2.5). The circulation patterns within the origin groups
are then averaged into a characteristic circulation pattern for those
swell events.
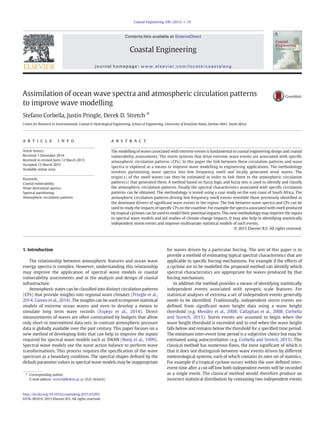
2.1. Case study site
The province of KwaZulu-Natal on the east coast of South Africa has
two relatively long records of wave data measured at Durban and
Richards Bay (Fig. 1). Descriptions of the wave characteristics for this
region, including directional energy spectra, are given by Corbella and
Stretch (2012b, 2014). The spectral wave data are derived from wave
recording buoys that are listed in Table 1. The wave recording buoys
sample at a rate of 1.28 Hz and the data sets have spectral data available
at 3-hour, 1-hour and 0.5-hour intervals.
Data for geo-potential heights that are required to investigate
atmospheric circulation patterns were obtained from the ERA-Interim
data set (http://apps.ecmwf.int/datasets/) for the period 1979–2013 at
6 hourly intervals. Circulation patterns are defined in this study as
normalized anomalies derived from the 700 hPa geopotential with a
grid resolution of 2.5° (10°S 0°E-50°S 50°E). The 700 hPa geopotential
anomalies indicate regions of relatively high and low pressures and
can be used to infer wind fields without accounting for boundary layer
effects (Bárdossy et al., in press). Furthermore they are less noisy than
those based on surface pressures which facilitates the automated CP
classification procedure.
Wind data is required to identify the locally generated wind wave
components of the wave energy spectra. Durban and Richards Bay
both have land based wind recording instruments for their port control.
Durban and Richards Bay wind data was available from 31/05/2002 to
31/07/2013 and 19/08/1993 to 31/07/2013 respectively. It should be
noted that coastal wind gradients may produce dramatically different
wind velocities between offshore and onshore locations. In this case
the buoys are within 2 km of the wind recording instruments and are
a representative measurement. Since the data period is restricted by
the availability of the wave data (Table 1) Durban was only analysed
for approximately 6 years and Richards Bay was analysed for approxi-
mately 16 years.
Mid-latitude cyclones (with associated cold fronts), coastal lows,
cut-off lows and tropical cyclones have been cited as the main swell
producing mechanisms along the KwaZulu-Natal coast (Mather and
Stretch, 2012; Corbella and Stretch, 2012a; Rossouw et al., 2011). The
reader is referred to Hunter (1987), Preston-Whyte and Tyson (1993)
and Taljaard (1995) for a detailed description of South African weather
systems. Coastal lows form closer to the coast than cut-off lows, mid-
latitude and tropical cyclones. Therefore they are typically associated
with smaller wave heights and shorter periods. Mid-latitude cyclones
that traverse west to east in the region south of the country, drive
long period southwesterly–southeasterly swell waves and occur during
the austral winter months. Cut-off lows are deep, low pressure systems
that become cut-off from the west–east moving mid-latitude cyclones
(Preston-Whyte and Tyson, 1993). Their persistence can produce large
swell waves with long periods. Tropical cyclones produce long period
waves typically from the northeast or east-northeast and occur during
late austral summer/early autumn months. However Mather and
Stretch (2012) argue that tropical cyclones that become stationary
south of Madagascar can drive severe wave conditions resulting in ex-
tensive coastal erosion. Seasons are defined in Table 2.
The wave data from Durban and Richards Bay will be used to
demonstrate a method of linking spectral wave data to the above-
mentioned circulation patterns.
2.2. Partitioning of spectral wave energy
The partitioning of spectral wave data is the separation of spectral
energy into swell energy and wind-wave or sea energy. The swell
energy that is usually characterised by waves produced large distances
Fig. 1. Map of South Africa showing KwaZulu-Natal with locations of the wave recorders.
Table 1
Historical wave recording instruments at Durban and Richards Bay, their operating
periods and water depth (from Corbella and Stretch, 2014).
Instrument Date Depth (m)
Durban
Directional Waverider
23/08/2007–30/04/2013 30
Richards Bay
3D Directional Buoy
11/06/1997–14/10/2002 22
Richards Bay
Directional Waverider
08/11/2002–30/04/2013 22
2 S. Corbella et al. / Coastal Engineering 100 (2015) 1–10
3. away from the coast and has longer periods and higher energy than
local wind-waves. The proposed method is focussed on the origin
of the more energetic swell waves. In order to estimate the origin of
specific swell waves one must first remove the locally formed wind
wave energy and partition the swell waves that are produced from
different forcing locations. Numerous authors have taken an interest
in developing partitioning algorithms (e.g. Hanson and Phillips
(2001); Portilla et al. (2009); Gerling (1992); Voorrips et al. (1997))
and Aarnes and Krogstad (2001) provide a general review of these
algorithms. The algorithm implemented in this paper is a mixture of
those proposed in Hanson and Phillips (2001) and Voorrips et al.
(1997).
Direct measurements of directional wave spectra S(ω, θ), where ω is
frequency and θ is the direction, are often not archived because they are
either considered unnecessary or impractically large to store. Most
available spectral data is therefore limited to 1-dimensional frequency
spectra S(ω). Applying the partitioning algorithm to two-dimensional
spectra is similar to applications with one-dimension spectra. The
reader is referred to Hanson and Phillips (2001) for a detailed descrip-
tion of the partitioning algorithm. Here we provide only a brief summary
of the Hanson and Phillips (2001) partitioning algorithm.
Initially the spectral peaks are isolated and separated using a
steepest ascent algorithm. A number of these isolated peaks will contain
wind-wave peaks and these are identified by a wave age criterion. All
the peaks that satisfy the criterion are considered to be local wind-
waves and are removed from the partitioned data. The remaining
peaks are all swell energies but may belong to the same swell system.
Mutual swell peaks are combined if they satisfy a peak separation
criterion. The peak separation criterion is satisfied if the peaks are
within a threshold distance of each other. The threshold contains a
calibration factor κ which may be unique to particular data sets. Finally
any partitions whose energy falls below a specified energy threshold
(A/(ωp
4
+ B)) are removed, where A and B are calibration factors.
2.2.1. Partitioning statistics
Partitioning statistics are required for the tracking algorithm
(Section 2.3). The relevant partitioning statistics are a partitioning
identification number, the observation time (t), the total energy (E),
the significant wave height (Hs), the mean (ωm) and peak frequency
(ωp) and the mean direction (θm).
The total spectral energy is defined as
E ¼
Z
ω
Z
θ
S ω; θð Þ dθ dω: ð1Þ
The significant wave height is defined as
Hs ¼ 4
ffiffiffi
E
p
; ð2Þ
and the mean frequency and mean direction are defined as
ωm ¼
E
Z
ω
Z
θ
S ω; θð Þω
−1
dθ dω;
ð3Þ
θm ¼ arctan
Z
ω
Z
θ
S ω; θð Þsin θ dθ dω
Z
ω
Z
θ
S ω; θð Þcos θ dθ dω
0
B
B
@
1
C
C
A; ð4Þ
respectively.
2.3. Swell tracking
2.3.1. Cross assignment of wave partitions
It cannot be assumed that all the partitioned spectra are uncorrelated
and many swell partitions may represent only one wave system. These
dependent events need to be collected by cross assignment criteria.
Although both Hanson and Phillips (2001) and Voorrips et al. (1997)
provide cross assignment criteria neither have any theoretical reason
to be preferred over the other. The cross assignment criteria, as with
other partitioning criteria, are used mainly as a means to calibrate the
cross assignments. For these reasons we create our own criteria, the
bounds of which are determined iteratively.
Two partitions, A and B, are cross assigned if they satisfy the
following criteria:
1. EA−EBj j
EA
b 0:2
2. |θmB − θmA| b 20°
3. ωmA−ωmBj j
ωmA
b 0:015:
Each partition is compared to the 6 consecutive partitions. The
comparison of the 6 consecutive partitions is based on the assumption
that it is unusual for more than 3 swell sources to be identified in any
one recording period. The latter has never occurred in the available
case study data. This is however a function of the specific data set and
the comparison length may need to be changed for other locations.
2.3.2. Swell origin identification
The swell source may be estimated from linear wave theory and the
partitioning statistics. The group velocity, Cg = g/4πd, can be rewritten
in terms of frequency and travel time to find the distance d to the
wave origin, namely
d ¼
g
4π
dω
dt
: ð5Þ
Assuming that the frequency at the observation point is increasing
over time and that the wave origin time, t0, can be calculated at ω = 0
we can calculate the wave origin time as
t0 ¼ −b
dω
dt
−1
; ð6Þ
where b is the ω intercept at t = 0. The rate of change of the frequency
(dω
dt
) is calculated from the best fit line between the observation time
(t) and mean frequency (ωm) of the cross assignment groups.
The distance to the swell origin can then be used with spherical
geometry to estimate the coordinates of the swell source. The source
latitude and longitude are given by Bartsch (1974) as:
ϕ ¼ sin
−1
sin ϕ0cos θd þ cos ϕ0sin θdcos ϑð Þ;
φ ¼ φ0 þ sin
−1 sin θdsin ϑ
cos ϕ
;
ð7Þ
where ϕ0 is the observation latitude, φ0 is the observation longitude, ϑ
is the mean direction of the cross assignment group, θd = d/RE is the
angular distance from the swell origin and RE is the radius of the earth.
2.3.3. Grouping of independent swell events
Before the characteristic circulation patterns can be assigned to swell
origins the cross assignment groups have to be collated into swell that
Table 2
The allocation of months to seasons.
Season Months
Summer December–February
Autumn March–May
Winter June–August
Spring September–November
3S. Corbella et al. / Coastal Engineering 100 (2015) 1–10
4. have similar points of origin. This is done on the assumption that waves
that formed at similar locations will have similar forcing systems. To
investigate the plausibility of this assumption we also carried out an
additional alternative grouping based on the wave characteristics.
The spatial groupings are defined by segments of circles extending
from the wave recording instrument into the ocean. The segment size
may be defined at a user's discretion. Here we use segments of 22.5°
divided into intervals of 5°. Fig. 2 illustrates a segment of independent
swell events.
The grouping by wave characteristics is defined in terms of signifi-
cant wave height, peak period and directions. All swell events that fall
within a similar range of these characteristics are grouped together. If
the assumption that similar wave events are formed by similar CPs is
correct, then the two grouping methods should have a strong correla-
tion. Fig. 2 shows an example comparing the two methods. The small
blue dots are the swell sources grouped by location and the larger
black dots are the swell sources grouped by wave characteristics. The
two methods of grouping show similar results. The wave characteristics
grouping contains less points as it is limited to a specific range of wave
heights, whereas the location grouping contains all the swell events
within a segment irrespective of wave height.
2.4. Atmospheric classification
Automated classification provides significant insight into high
dimensional problems. Different states are grouped together through
a clustering technique such as k mean, principle component analysis
or artificial neural networks (Huth et al., 2008; Hewitson and Crane,
2002). However in the aforementioned techniques, links to surface
weather phenomena are made after the classes (or groups) are found
(e.g. Camus et al., 2014). The classification algorithm used in this
study was first developed by Bárdossy et al. (1995) and adapted
by Pringle et al. (2014) to incorporate wave climate analysis. The
algorithm consists of two parts, firstly a set of CP classes are derived
using an optimization procedure and secondly CP anomalies at each
time are assigned to a particular class. The optimization procedure is
guided by the significant wave height (Hs) to an optimal solution
using a set of objective functions and simulated annealing. It follows
that the classes derived in this supervised manner will have strong
links to wave behaviour and should provide insight into the causal
mechanisms of regional wave climates (Pringle et al., 2014).
The classification method herein is based on fuzzy logic and fuzzy-
sets after Zadeh (1965). The use of fuzzy logic allows the algorithm to
quantify the meaning of statements such as ‘strong low pressure’
(Bárdossy et al., 1995). Details of the method and its performance can
be found in Bárdossy et al. (1995, 2002), Stehlik and Bárdossy (2003),
Bárdossy (2010), and Pringle et al. (2014). Only a brief overview is
given here.
The CP classes are defined as a fuzzy rule which consists of spatially
distributed fuzzy numbers that correspond to fuzzy-set membership
functions. The jth
class is described by the vector vj = [H(l, j), …,
H(K, j)] for all grid points (1, …, k, …, K). The matrix H contains all
the rules (1, …, j). To each grid point k one of the following fuzzy-set
membership functions can be assigned based on the anomaly value
(Pringle et al., 2014):
Fuzzy set number 0 — any type of anomaly,
Fuzzy set number 1 — strong positive anomaly,
Fuzzy set number 2 — weak positive anomaly,
Fuzzy set number 3 — weak negative anomaly and
Fuzzy set number 4 — strong negative anomaly.
A degree of fit (DOF) is then assigned to each class for the CP
anomaly at time t. This means that the anomaly on any given day can
belong to a degree to all classes. However the class with the highest
DOF value is assigned as the CP for that particular day.
The classes are derived through an optimization procedure. The
optimization is based on a set of objective functions. It is through the
objective functions that the wave height is incorporated (Pringle et al.,
2014). The first objective function corresponds to extreme wave events.
An event is defined as the time from when Hs ≥ 3.5 m to the time
Hs b 3.5 m.
O1 θð Þ ¼
ffiffiffiffiffiffiffiffiffiffiffiffiffiffiffiffiffiffiffiffiffiffiffiffiffiffiffiffiffiffiffiffiffiffiffiffiffiffiffiffiffiffiffiffiffiffiffiffiffiffiffiffiffiffi
XT
t¼1
p Hs ≥θ j CP tð Þð Þ−pð Þ
2
v
u
u
t ð8Þ
Fig. 2. A map of the Indian Ocean with the dashed lines showing the grouping segments. The small blue dots show a spatial grouping of swell sources and the larger black dots show a
grouping by wave characteristics. The grouping by wave characteristics has the following parameters: 1.5 m b Hs b 2.0 m, 10 s b Tp b 12 s, 90° b θ b 135°. The large black dot indicates
the location of the Durban wave recording buoy. (For interpretation of the references to colour in this figure legend, the reader is referred to the web version of this article.)
4 S. Corbella et al. / Coastal Engineering 100 (2015) 1–10
5. where θ is a predefined threshold, T is the total number of days,
p(Hs ≥ θ | CP(t)) is the conditional probability of an extreme event for
a given CP on a day t, p is the unconditional probability of exceedance
for all days in period T. Two different thresholds were considered:
θ1 = 3.5 m and θ2 = 2.5 m. The two thresholds force the algorithm to
consider CPs driving both extreme wave events and medium size
wave events.
The second objective function corresponds to the average significant
wave heights and is defined as
O2 ¼
XT
t¼1
ln
Hs CP tð Þð Þ
Hs
!
6.
7.
8.
9.
10.
11.
12.
13.
14.
15. ð9Þ
where Hs(CP(t)) is the mean significant wave height at time t with
a given CP class and Hs is the mean daily wave height without
classification.
The optimization procedure maximizes a linear combination of
Eqs. (8) and (9). This implies that the optimization aims to define a
set of distinct classes based on the wave heights that have statistics
significantly different from the mean (or unclassified case).
2.5. Linking swell events to circulation patterns
The circulation patterns associated with storm swell energy are
obtained by ensemble averaging the anomalies that occurred at the
estimated times of the swell origins for each grouping of independent
swell events. This average (or characteristic) CP can then be plotted
and compared with the location of the inferred grouped swell origins.
Section 3 presents the results for all the swell groupings.
The characteristic CPs are then classified according to Section 2.4
into the classes that best describe their appearance. The choice of the
number of classes used in the classification is generally subjective but
Pringle et al. (in press) have provided an objective method for estimat-
ing the optimal number of classes. They suggested a range of 15–20 and
therefore 16 CP classes were used for the present study.
3. Results
The results obtained from analysis of the Durban and Richards
Bay data are similar so we focus on presenting results from the
Durban data.
3.1. Partitioning KwaZulu-Natal wave data
Wind data is crucial in the separation of wind waves from swell
waves. Fig. 3 shows the wind roses of Durban and Richards Bay. An ex-
ample of partitioned data, both in terms of the associated frequency
spectra and the directional energy spectra, is shown in Fig. 4. Fig. 4a
shows the unpartitioned spectral data and the recorded wind vector,
Fig. 4b shows the partitioned swell component in the data and Fig. 4c
shows the partitioned wind-wave component. The plots show that the
partitioning algorithm has effectively separated the locally generated
wind-waves from the swell waves. The 2-dimensional plots illustrate
how the wind waves are significantly different from the swell waves
in both energy, direction and period.
The calibration factor κ for the peak separation criterion was
calculated iteratively and a value of 0.8 was adopted. The function
A/(ωp
4
+ B) was used to define the peak energy threshold following
Hanson and Phillips (2001). The parameters A and B were chosen as
A = 1.0 × 10⁻⁵
and B = 1.0 × 10⁻³
respectively. The intention of the
threshold is to eliminate noise and Fig. 5 shows the spectral energy for
the Durban data relative to the specified energy threshold.
3.2. Swell origins and associated circulation patterns
The derived spatial origins of the cross-assigned swell are shown in
Fig. 6. The dots indicate the origin of the swell and the colour of the dots
indicates the associated wave periods. As expected the shorter wave
periods have origins closer to the coast than the longer wave periods.
The majority of the swell wave events originate from the south east
and have wave periods above 10 s.
Fig. 7 shows five characteristic CP anomalies, the classes to which
the classification algorithm assigns the anomalies, and the associated
wave directional spectra. The swell origins shown as dots in Fig. 7
were grouped according to the spatial grouping method described in
Section 2.3.3. Visually, the characteristic CPs only weakly resemble the
CP classes to which they are assigned. Furthermore the associated CP
anomalies show a high degree of variability. While their shapes are
similar to the identified classes their strengths are significantly weaker
(values ranging from about −0.5 to +0.5). This may be attributed to
the movement of low pressure cells within the vicinity of the swell
origins or inaccuracy in the location and grouping of the swell origins.
According to this method of swell grouping, the characteristic CPs are
similar to west–east moving mid-latitude cyclones that frequent the
region south of the country. The large area of high pressure shown in
Fig. 7(c) is typical of the pattern associated with the passage of mid-
latitude cyclones.
Fig. 3. Wind roses for Durban (31/05/2002–31/07/2013) and Richards Bay (19/08/1993–31/07/2013).
5S. Corbella et al. / Coastal Engineering 100 (2015) 1–10
16. Grouping the swell origins using the associated wave characteristics
(Fig. 8) yields results with stronger associated CPs and therefore
improved fidelity in associating CPs with the swell origins. The associated
CPs were classified as (a) (b) CP03, (c) CP08, (d) CP07 and (e) CP09.
Their statistics are shown in Table 3. The wave parameters used for
grouping the swell origins were as follows:
(a) Hs = 1.5 − 2.0 m, ω = 0.1 − 0.088 Hz, θ = 90 − 135°
(b) Hs = 1.5 − 2.0 m, ω = 0.0875 − 0.075 Hz, θ = 90 − 135°
Fig. 4. An example of a directional energy spectrum (a) and frequency spectrum (d) partitioned into their respective swell (b e) and wind-wave spectra (c f).
Fig. 5. The minimum energy threshold for the Durban data as defined by A/(ωp
4
+ B). The
dots show the total energy of each swell partition.
Fig. 6. A map of the Indian Ocean with the coloured dots showing all the swell sources for
Durban. The colours depict the swell periods as defined in the legend. The large black dot
indicates the location of the Durban wave recording buoy. (For interpretation of the
references to colour in this figure legend, the reader is referred to the web version of
this article.)
6 S. Corbella et al. / Coastal Engineering 100 (2015) 1–10
17. Fig. 7. The origins of swell events and associated CP anomalies using the spatial grouping method. The class assigned by the classification algorithm is shown in the top panel. The swell
origins (dots) and associated average CP anomalies are shown in the centre panel. The associated wave directional spectra are plotted in the bottom panel. The characteristic CPs are
classified as (a) CP15, (b) CP10, (c) CP12 (d) CP15 and (e) CP10.
Fig. 8. The origins of swell events and associated CP anomalies using the wave characteristics grouping method. The class assigned by the classification algorithm is shown in the top panel.
The swell origins (dots) and associated average CP anomalies are shown in the centre panel. The associated wave directional spectra are plotted in the bottom panel. The characteristic CPs
are classified as (a) CP03, (b) CP03, (c) CP08, (d) CP07 and (e) CP09.
7S. Corbella et al. / Coastal Engineering 100 (2015) 1–10
18. (c) Hs = 1.5 − 2.0 m, ω = 0.0875 − 0.075 Hz, θ = 135 − 180°
(d) Hs = 2.0 − 2.5 m, ω = 0.1 − 0.088 Hz, θ = 90 − 135°
(e) Hs = 2.0 − 2.5 m, ω = 0.088 − 0.075 Hz, θ = 135 − 180°.
Wave heights above 3.0 m were not considered since there were too
few events on record during the time period considered. According to
Table 3 CP07 is associated with the majority of extreme wave events,
while CP09 contributes the largest percentage of extreme wave events
during winter. All CP classes occur infrequently (4%–6%). Figs. 7 and 8
show that the main driver of wave events is the coupling of low and
high pressures. The location and orientation of this coupling defines
the characteristics of the wave events such as wave height, direction
and period.
3.3. Average wave directional spectra and associated circulation patterns
Atmospheric circulation patterns contain important information on
wave height (or energy), direction and frequency which is of particular
importance to coastal vulnerability assessment. This is shown specifi-
cally in Fig. 9 which contains average wave directional spectra for
each CP. It is also clear that the classification algorithm is able to capture
CP classes with significantly different wave characteristics. CP07 and
CP09 in Fig. 9(b) and (d) are associated with the largest wave energies
which are also reflected in Table 3 as these two CPs contribute the most
towards extreme wave events. The direction of wave attack is strongly
linked to the orientation of the high–low pressure coupling. For
example CP09 has a high–low pressure coupling such that it drives a
strong southerly wind and hence wave energy is from the south. CP03
and CP08 in Fig. 9 are associated with low to medium wave energies.
Fig. 9(a) suggests that the higher frequency easterly component of
the wave energy is driven by the low/high coupling to the east of
the country. However the atmospheric driver of the lower frequency
southerly component is unclear. Typically this pattern (CP03)
resembles the high pressures that follow the west–east propagating
mid-latitude cyclones which drive southerly to south-easterly waves
which explain the southerly component of the wave energy. This is
also seen in Fig. 9(c) and (d) in which CP08 and CP09 resemble mid-
latitude cyclones with a strong component of southerly wave energy.
4. Discussion
The main proposition underpinning this study was that linking
the occurrence of storm waves at a location of interest to atmospheric
circulation patterns can improve analysis and modelling in coastal
vulnerability assessments or coastal engineering design applications.
We have demonstrated that spectral partitioning into non-local swell
components and local wind-wave components can be used to track
the origins of the swell waves and thus link them to their associated
atmospheric circulation patterns. The successful establishment of
these links is complex and our experimentation has highlighted some
of the difficulties in achieving this.
The partitioning procedure contains various calibration factors that
affect the outcomes e.g. for spectral peak separation and defining the
energy threshold. The reader is referred to Hanson and Phillips (2001)
for an explanation of the calibration factors. The cross assignment
conditions in the swell tracking algorithm (Section 2.3.1) may also be
site specific. The dependence on user defined calibrations makes the
procedure less robust and detracts from its generality.
Table 3
CP occurrence frequencies and their associated wave event statistics. The wave height
threshold θ used to define the wave events was θ = 3.5 m for this data.
CP CP03 CP07 CP08 CP09
Occurrence frequency (p(CP)) %
Summer 6.54 6.49 5.85 4.15
Autumn 5.41 5.55 4.83 5.27
Winter 6.07 4.66 4.30 5.31
Spring 5.53 5.70 5.58 4.74
All seasons 5.89 5.60 5.13 5.13
Contribution to extreme events (p(CP| θ)) %
Summer 0.00 26.6 0.00 0.00
Autumn 7.89 10.5 0.66 10.5
Winter 9.52 11.1 4.76 17.5
Spring 5.26 44.7 0.00 7.89
All seasons 7.38 16.2 1.48 11.1
Fig. 9. The average wave directional spectra for associated CPs: (a) CP03, (b) CP07, (c) CP08 and (d) CP09.
8 S. Corbella et al. / Coastal Engineering 100 (2015) 1–10
19. Perhaps the largest uncertainty is contained within Eqs. (5) and (6).
Due to the dispersive nature of surface waves we expect waves with
the largest wave periods to have travelled from the greatest distances.
However, there are occasions when dω/dt for wave events with long
wave periods are similar to those with small wave periods. Such events
may therefore be grouped unrealistically close to one another, perhaps
due to neglecting dissipation effects. Incorrect spatial and temporal
placement can create errors when linking CPs with the swell origins.
Therefore outlier values need to be removed from the spatial and/or
wave characteristic groupings prior to analysis of their associated CPs.
Here we eliminated frequency values that were more than one standard
deviation from the mean.
Fig. 6 shows all the unique swell events for the Durban data and
illustrates some of the above-mentioned issues with the procedure.
The swell origins are the small dots and they are coloured according
to the magnitude of their wave periods. The swell origins largely behave
as expected with the shorter period waves forming closer to shore than
the longer period waves. However there are examples when this is not
the case due to the reasons noted above. Some events are also estimated
to have formed over Madagascar which is obviously not possible.
The linking of CPs to wave origins based on the spatial grouping
method (Fig. 7) showed high variability that suggests erroneous
coupling of storm origins with CP anomalies. However the method of
grouping based on wave characteristics (Fig. 8) performed much better
in this regard. Pringle et al. (2014) noted that it is possible for a specific
storm to belong to a number of classes during its development because
the set of classes represent different atmospheric states with no
attached temporal information. The relative orientation of high and
low pressure anomalies is also not directly incorporated into the CP
classification procedure. This may be important for discriminating
between waves from different directions because the locations of high
and low pressures influence the direction of the surface wind field
that drives wave formation. In general the strongest winds occur in
the zone between high and low pressures where the pressure gradient
is high. However the results in Fig. 9 indicate that the CP classification
algorithm can successfully discriminate between wave spectra of
varying strength and direction. Therefore we propose that the CPs are
a physically meaningful way to describe complex wave climates.
Although the algorithm has limitations it can have significant
benefits in some applications. The linking of spectral wave energy to
CPs is valuable in spectral wave models. As shown in Section 3 different
circulation patterns produce different spectral shapes. It would
therefore be erroneous to assume the same spectral shape for all wave
conditions or to use the default spectral characteristics provided by
some spectral wave models (e.g. SWAN). The link between the spectral
data and the CPs can be used to fit a parametric model to the spectral
data to study the impacts of specific CPs on the coastline. For example
the specific spectral shape for swell produced by tropical cyclones can
be used to model their potential impacts. This may also be useful for
the study of climate change phenomena where one could study the
changes in forcing mechanisms as opposed to directly investigating
the wave data.
Another important application of the algorithm may be found in the
statistical analysis of extreme wave events and wave climate modelling.
Firstly it provides a physically meaningful way to identify independent
events. Furthermore it provides a method to differentiate and model
wave directional spectra in complex wave climates. The classical
method of defining independent events uses wave height thresholding
and cannot reliably define statistically independent events. The
proposed algorithm avoids the mixing of statistically independent
events by linking them to specific meteorological systems in terms
of their CPs. An example of a recorded wave event on the east coast
of South Africa with two different causal weather systems is shown
in Fig. 10. Li et al. (2014) used the classical method of defining
storm independence when they proposed a method of modelling
multivariate storm parameters. In their method they identified that
their model failed to capture the physical limits of the storm driving
forces. Camus et al. (2011) utilised classification algorithms to group
wave events with similar characteristics within a complex wave cli-
mate for modelling purposes. The more recent work by Espejo et al.
(2014) and Camus et al. (2014) also developed the links between at-
mospheric CPs and the aforementioned wave climate. However
these links were found after CP classification, whereas in the method
presented here the derivation of the CP classes is based a priori on
their link to the wave climate. This distinction and its benefits are
further discussed by Bárdossy et al. (in press). The results shown in
Sections 3.2 and 3.3 and Figs. 7 and 8 indicate that grouping events
with similar characteristics on the assumption that they are driven
by similar CPs is valid at our case study site. Exploiting these links
can significantly improve statistical models.
5. Conclusions
In this paper we have proposed a new method for linking
atmospheric circulation patterns to wave spectral characteristics.
This seems to be the first attempt at exploring this link for regional
Fig. 10. An example of storm wave events in 2001 with two different driving weather systems: (a) a mid-latitude cyclone occurring on 2001/04/03, and (b) a tropical cyclone occurring on
2001/04/08. Both events may have been grouped as one storm by traditional threshold based methods. A threshold of 3.5 m is shown by the dashed line in (c).
9S. Corbella et al. / Coastal Engineering 100 (2015) 1–10
20. wave data in the south-west Indian Ocean. The wave spectral ener-
gy distributions have been shown to be related to the relative posi-
tions and orientation of low and high pressure anomalies. The new
methodology may lead to improved inputs to spectral wave models,
aid in the study of climate change impacts, and improve the identi-
fication of statistically independent wave events and multivariate
statistical models.
Acknowledgements
The authors thank the eThekwini Municipality, the National Port
Authority, and the CSIR for access to spectral wave data. SC is supported
by a fellowship from the Nelson Endowment Fund and JP is supported
by the National Research Foundation (Grant UID 81576). DDS is grateful
to the eThekwini Municipality for sponsoring a Chair in Civil Engineering
at UKZN.
References
Aarnes, J.E., Krogstad, H.E., 2001. Partitioning sequences for the dissection of directional
ocean wave spectra: a review. Technical Report Work Package 4 (WP4) of the
EnviWave (ENG-2001-00017) Research Program, EU Energy. Environment and
Sustainable Development Program 23.
Bárdossy, A., 2010. Atmospheric circulation pattern classification for South-West
Germany using hydrological variables. Phys. Chem. Earth 35, 498–506.
Bárdossy, A., Duckstein, L., Bogardi, I., 1995. Fuzzy rule-based classification of atmospheric
circulation patterns. Int. J. Climatol. 15, 1087–1097.
Bárdossy, A., Stehlik, J., Caspary, H.J., 2002. Automated objective classification of daily
circulation patterns for precipitation and temperature downscaling based on
optimized fuzzy rules. Clim. Res. 23, 11–22.
Bárdossy, A., Pegram, G., Sinclair, S., Pringle, J., Stretch, D., 2015. Circulation patterns
identified through spatial rainfall and ocean wave fields in southern Africa. Front.
Environ. Sci. (in press).
Bartsch, H., 1974. Handbook of Mathematical Formulas. Academic Press, New York.
Booij, N., Ris, R., Holthuijsen, L.H., 1999. A third-generation wave model for coastal regions
1. Model description and validation. J. Geophys. Res. 104, 7649–7666.
Callaghan, D., Nielsen, P., Short, A., Ranasinghe, R., 2008. Statistical simulation of wave
climate and extreme beach erosion. Coast. Eng. 55, 375–390.
Camus, P., Mendez, F., Medina, R., Cofiño, A., 2011. Analysis of clustering and selection
algorithms for the study of multivariate wave climate. Coast. Eng. 58, 453–462.
Camus, P., Menéndez, M., Méndez, F., Izaguirre, C., Espejo, A., Cánovas, V., Pérez, J., Rueda,
A., Losada, I., Medina, R., 2014. A weather-type statistical downscaling framework for
ocean wave climate. J. Geophys. Res. Oceans 119, 1–17.
Corbella, S., Stretch, D.D., 2012a. a. Predicting coastal erosion trends using non-stationary
statistics and process-based models. Coast. Eng. 70, 40–49.
Corbella, S., Stretch, D.D., 2012b. The wave climate on the Kwazulu-Natal coast of South
Africa. J. South Afr. Inst. Civil Eng. 54, 45–54.
Corbella, S., Stretch, D.D., 2013. Simulating a multivariate sea storm using Archimedean
copulas. Coastal Engineering 76, 67–78.
Corbella, S., Stretch, D.D., 2014. Directional Wave Spectra on the East Coast of South Africa.
J. S. Afr. Inst. Civ. Eng. 56 (3), 53–64.
Espejo, A., Camus, P., Losada, I., Méndez, F., 2014. Spectral ocean wave climate variability
based on atmospheric circulation patterns. J. Phys. Oceanogr. 44, 2139–2152.
Gerling, T.W., 1992. Partitioning sequences and arrays of directional ocean wave spectra
into component wave systems. J. Atmos. Oceanic Tech. 9, 444–458.
Hanson, J.L., Phillips, O.M., 2001. Automated analysis of ocean surface directional wave
spectra. J. Atmos. Ocean. Technol. 18, 277–293.
Hewitson, B., Crane, R., 2002. Self-organizing maps: applications to synoptic climatology.
Clim. Res. 22, 13–26.
Hunter, I., 1987. The Weather of the Agulhas Bank and the Cape Town South Coast. Thesis
for the Department of Oceanography. University of Cape Town, Cape Town.
Huth, R., Beck, C., Philipp, A., Demuzere, M., Ustrnul, Z., Cahynová, M., Kyselý, J., Tveito,
O.E., 2008. Classifications of atmospheric circulation patterns: recent advances and
application. Ann. N. Y. Acad. Sci. 1146, 105–152.
Li, F., van Gelder, P.H.A.J.M., Ranasinghe, R., Callaghanc, D., Jongejan, R., 2014. Probabilistic
modelling of extreme storms along the Dutch coast. Coast. Eng. 86, 1–13.
Mather, A.A., Stretch, D.D., 2012. A perspective on sea level rise and coastal storm surge
from southern and eastern Africa: a case study near Durban, South Africa. Water 4,
237–259.
Mendez, F.J., Menendez, M., Luceno, A., Medina, R., Graham, N.E., 2008. Seasonality and
duration in extreme value distributions of significant wave height. Ocean Eng. 35,
131–138.
Portilla, J., Ocamp-Torres, F.J., Monbaliu, J., 2009. Spectral partitioning and identification of
wind sea and swell waves. J. Atmos. Ocean. Technol. 26, 107–122.
Preston-Whyte, R., Tyson, P., 1993. The Atmosphere and Weather of Southern Africa.
Oxford University Press, Southern Africa.
Pringle, J.J., Stretch, D.D., Bárdossy, A., 2014. Automated classification of the atmospheric
circulation patterns that drive regional wave climates. Nat. Hazards Earth Syst. Sci.
14, 2145–2155.
Pringle, J.J., Stretch, D.D., Bárdossy, A., 2015. Atmospheric circulation patterns that drive
extreme wave events: a new framework for coastal vulnerability assessment. Nat.
Hazards (in press).
Rossouw, J., Coetzee, L., Visser, C., 2011. A South African wave climate study. Coast. Eng.
Proc. 1 (18) (URL https://icce-ojs-tamu.tdl.org/icce/index.php/icce/article/view/
3618).
Stehlik, J., Bárdossy, A., 2003. Statistical comparison of European circulation patterns and
development of a continental scale classification. Theor. Appl. Climatol. 76, 31–46.
Taljaard, J., 1995. Atmospheric Circulation Systems, Synoptic Climatology and Weather
Phenomena of South Africa, Part 2: Atmospheric Circulation Systems in the South
African Region. South African Weather Bureau, Pretoria.
Voorrips, A.C., Makin, V.K., Hasselmann, S., 1997. Assimilation of wave spectra from pitch
and roll buoys in a north sea wave model. J. Geophys. Res. 102, 5829–5849.
Zadeh, L., 1965. Fuzzy sets. Inf. Control. 8 (3), 338–353.
10 S. Corbella et al. / Coastal Engineering 100 (2015) 1–10