Download to read offline
![World Academics J. of Engg. Sciences Vol. 6(1), Oct 2019, ISSN: 2348-635X
© 2019, WAJES All Rights Reserved 10
B1
2 374 535.540 1651.590 1.432 4.636 2.225
3 79 223.030 1874.620 2.823 4.734 1.972
4 21 130.550 2005.170 6.217 3.762 2.202
5 5 68.420 2073.590 13.684 4.200 2.201
6 2 6.990 2080.580 3.495 2.500 0.255
7 1 60.730 2141.310 60.730 2.000 17.376
B2
1 1286 828.930 828.930 0.645
2 266 400.140 1229.070 1.504 4.835 2.334
3 58 194.150 1423.220 3.347 4.586 2.225
4 10 77.300 1500.520 7.730 5.800 2.309
5 1 48.460 1548.980 48.460 10.000 6.269
6 0 0.000 1548.980 - - -
7 1 36.170 1585.150 36.170 - -
B3 1 2022 1308.330 1308.330 0.647
2 421 627.240 1935.570 1.490 4.803 2.303
3 86 290.350 2225.920 3.376 4.895 2.266
4 22 162.740 2388.660 7.397 3.909 2.191
5 5 40.270 2428.930 8.054 4.400 1.089
6 2 76.490 2505.420 38.245 2.500 4.749
7 1 11.470 2516.890 11.470 2.000 0.300
B4
1 1557 922.450 922.450 0.592
2 340 478.000 1400.450 1.406 4.579 2.373
3 68 207.300 1607.750 3.049 5.000 2.168
4 16 126.390 1734.140 7.899 4.250 2.591
5 4 29.550 1763.690 7.388 4.000 0.935
6 1 50.700 1814.390 50.700 4.000 6.863
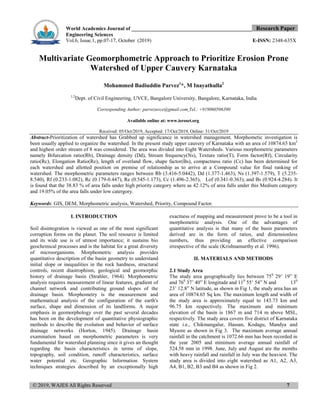
3.2 Priortization of Watershed
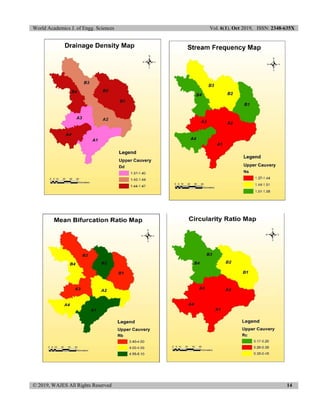
Morphometric aspects such as Drainage density (Dd),
Stream frequency (Ns), Texture ratio (T), Form factor (Rf),
Bifurcation ratio (Rb), Circularity ratio (Rc), Elongation
Ratio (Re), length of overland flow, Basin Shape (Bs),
compactness ratio(Cc) are also termed as erosin risk
assessment parameters and have been used for prioritizing
Watersheds [3]. The preliminary priority ranking of
Watersheds was done on the basis of morphological
characteristics the parameters such as Bifurcation ratio(Rb),
Stream frequency (Ns), Drainage density(Dd), Texture
ratio(T), have a direct relationship with erodibility higher
values of all these have been have been given rank 1 second
largest is rated as rank 2 and so on with the least ranked last
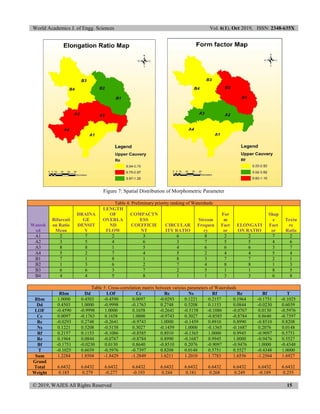
in each of the mini watersheds. Parameters such as Form
factor (Rf), Circularity ratio (Rc), Elongation Ratio (Re),
Basin Shape (Bs) have inverse relationship with the
erodibility higher the value less is erosion lower the value
high is erodibility [5]. In this manner least estimations of this
is appraised as rank 1 and second least been rated as rank 2
and so on and the highest values is given last rank. The final
priority ranking and related categorization were made on the
basis of the compound factor value, which was computed by
multiplying the ranks from morphometric analysis and their
weights obtained using cross-correlation analysis of these
parameters to give compound factor for final prioritization
of sub-watersheds[5]. The compound factor is calculated
using equation 1.
CF= PPRmp x Wmp (1) Where CF is compound factor,
PPRmp is the preliminary priority rank based on
morphometric parameter, and Wmp is the weight of
morphometric parameter obtained using cross correlation
analysis. Based on final value of compound factor
Watershed with least rating was assigned highest rank next
value was assigned second rank and so on and the
Watershed with highest compound value was assigned last
rank.
3.2.1 Prioritization of sub-watershed based on weighted
sum approach
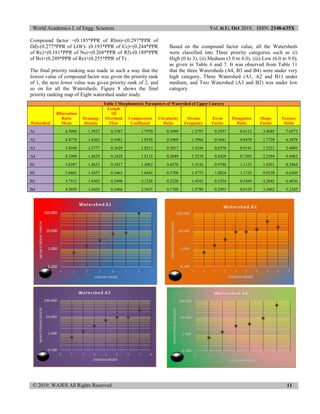
The cross-correlation analysis among various morphometric
parameters (Table 5) was performed and tested at 5% level
of significance. The priority ranks of Watersheds were
determined on the basis of compound factor (Table 4),
which was calculated using Eq.1.The value of weights
assigned to a morphometric parameter was calculated by
dividing the sum of correlation coefficient of each parameter
by the grand total of correlations (Table 5)[5]. By assigning
the weights to different parameters, a model was formulated
to assess the final priority ranking. The compound factor for
Watershed A1 prioritization was computed as follows:](https://image.slidesharecdn.com/2-wajes-02668-191216064522/85/2-wajes-02668-4-320.jpg)

![World Academics J. of Engg. Sciences Vol. 6(1), Oct 2019, ISSN: 2348-635X
© 2019, WAJES All Rights Reserved 16
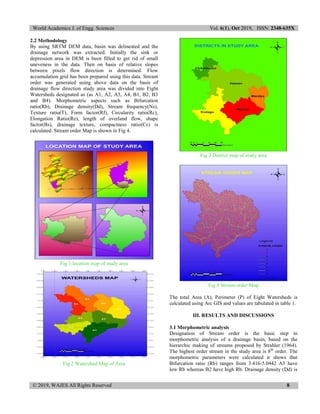
Table 6 : Final Priority Ranking
Watershed
Name
Compound factor Rank
A1 4.323 4
A2 5.042 5
A3 8.852 8
A4 2.497 3
B1 5.156 6
B2 6.118 7
B3 2.275 2
B4 1.809 1
Table 7: Priority category based on compound factor for mini-
watershed 1
Sl
No
Priority
Level
Priority
Category
Watershed name % Area
1 0.0-2.5 High A4, B3, B4 38.83
2 2.5-5.0 Medium A1, A2, B1 42.12
3 5.0-7.5 Low A3, B2 19.05
Figure 8 Priority Map
IV. CONCLUSIONS
The length of overland flow (lof) for all the Watersheds in
the present study is more than 0.30 hence they have longer
flow paths associated with more infiltration and reduced
runoff. Stream frequency (Ns) for present study is low
demonstrating relatively a low runoff. Higher value of form
factor (Rf) indicates wider basin and lower value indicates
narrow basin. Drainage density varies from1.377 km/km2
to
1.463 km/km2
indicating watersheds fall under coarse and
very coarse texture. From Table 6 and 7 it can be found that
the 38.83 % of area falls under high priority category where
as 42.12% of area falls under this Medium category and
19.05% of the area falls under low catergory. We can also
conclude that in case of unavailability of soil maps this type
of study could be used in selecting area for soil conservation
measure.
REFERENCES
[1] Horton R.E.(1945). Erosional Development of streams and their
drainage basins, Hydro physical approach to quantitative
morphology. Geological Society of American Bulletin. 56: 275-
370.
[2] Horton,R.E.(1932).Drainage Basin Characteristics. Transfixions of
Am.Geophysics.Union, 13:350
[3] Mohammed Badiuddin Parvez, M Inayathulla “Prioritization Of
Subwatersheds of Cauvery Region Based on Morphometric
Analysis Using GIS”, International Journal for Research in
Engineering Application & Management (IJREAM), Volume: 05
Issue: 01, April -2019.
[4] Mohammed Badiuddin Parvez, M Inayathulla “Modelling of Short
Duration Isopluvial Map For Raichur District Karnataka”,](https://image.slidesharecdn.com/2-wajes-02668-191216064522/85/2-wajes-02668-10-320.jpg)
![World Academics J. of Engg. Sciences Vol. 6(1), Oct 2019, ISSN: 2348-635X
© 2019, WAJES All Rights Reserved 17
International Journal for Science and Advance Research in
Technology (IJSART), Volume: 05 Issue: 4, April -2019.
[5] Mohammed Badiuddin Parvez, and M .Inayathulla. "Morphometry,
Hypsometry Analysis and Runoff Estimation of Aam Talab
Watershed Raichur, Karnataka" International Journal Of Advance
Research And Innovative
Ideas In Education Volume 5 Issue 3 2019 Page 1713-1727 [6]
Strahler.A.N(1964) : Quantitative geomorphology of drainage
basin sand channel networks, section 4II, in: Handbook of Applied
Hydrology, edited by V.T.Chow, Mc GrawHill:439
[7] Vijith, H and Sateesh, R. (2006). GIS based morphometric analysis
of two major upland Sub-watershed of Meenachil river in Kerala.
Journal of Indian society of Remote Sensing. 34(2): 181-185.
AUTHORS PROFILE
Mohammed Badiuddin Parvez Is a life
member of Indian Water Resources
Society, ASCE Born in Gangavathi,
Obtained his BE in Civil Engineering in
the year 2009-2013 from UVCE,
Banagalore and M.E with specialization
in Water Resources Engineering during
2013-2015 from UVCE, Bangalore University and Pursuing
Ph.D from Bangalore University. And has 3 years of
teaching experience. Till date, has presented and published
several technical papers in many National and International
seminars, Journals and conferences.
M Inayathulla Is a life member of
Environmental and Water Resources
Engineering (EWRI), ASCE, WWI,
ASTEE, ASFPM. Born in Karnataka,
Obtained his BE in Civil Engineering in
the year 1987-1991 from UBDT,
Davanagere and M.E with specialization
on Water Resources Engineering during 1992-1994 from
UVCE, Bangalore University and got Doctorate from
Bangalore University. Presently working as Professor at
UVCE, Bangalore University, India. And has more than 25
years of teaching experience. Till date, has presented and
published several technical papers in many National and
International seminars and conferences](https://image.slidesharecdn.com/2-wajes-02668-191216064522/85/2-wajes-02668-11-320.jpg)

The study examines the prioritization of erosion-prone watersheds in the Upper Cauvery region of Karnataka, utilizing various morphometric parameters such as bifurcation ratio, drainage density, and stream frequency. Results indicate that 38.83% of the watershed area is classified as high priority, while 42.12% falls under medium priority and 19.05% under low priority categories. The methodology utilizes GIS techniques to analyze watershed characteristics and their implications for effective watershed management.