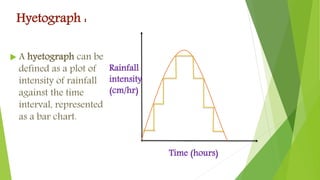
SHREE S’AD VIDHYA MANDAL
INSTITUTE OF TECHNLOGY
Faculty:- Payal shah
SUBJECT:- Hydrology & Water resources engineering
SR NO . NAME ENROLLMENT NO .
1 Patel Margi M. 130450106035
2 Shah Ishani M. 130450106044
Hyetograph :
 A hyetograph can be
defined as a plot of
intensity of rainfall
against the time
interval, represented
as a bar chart.
Time (hours)
Rainfall
intensity
(cm/hr)
 The intensity of rain is expressed in cm/hr .
 This time intensity curve is generally assumed to be
made up of straight lines as shown in figure and is
called hyetograph .
 The hyetograph can be prepared either from the mass
curve of rainfall, or directly from the data obtained
from automatic raingauges .
 The area under a hyetograph represents the total
rainfall received in that period .
 This chart is very usefull in presenting the
characteristics of a storm, and is particularly important
in developing the design to predict extreme floods .
Hyetograph from mass curve of rainfall
:
 The mass curve of
rainfall is a plot of
accumulated rainfall
(cumulative rainfall)
against time .
 The hyetograph is
derived from the
mass curve and is
usually represent as
a bar chart . Time (hours)
1st storm
2nd storm
3rd storm
A
D
B C
E
F
i =
∆𝑝
∆𝑡 ∆𝑝
∆𝑡
Cumulative rainfall
(cm)
 The steepness of the curve indicates the intensity of
rainfall.
 The horizontal portion of the curve indicates that
there was no rainfall during that period .
 The mass curve of rainfall is rising curve .
 The intensity of rainfall during any period is given by
intensity of rainfall = i =
∆𝑝
∆𝑡
 The mass curve of rainfall gives very useful
information regarding duration and magnitude .
HYDROGRAPH
 A hydrograph is a graph showing variation of
discharge (Q) with time (t) , at a particular point of
stream or river,
 River discharge = Cross sectional area x rivers mean
velocity
 Discharge is usually expressed in cumec or hectare
meter per day and time is expressed in hours or days.
 Since the hydrograph is generated from runoff due to
precipitation resulting from an isolated storm or a series
of consecutive storms, it is also known as a storm
hydrograph.
Components of a single peaked hydrograph
D
B
CA
Rising
limb recession
peak
Direct
runoff
Ground water
Flow due to
channel storage
E
Point of inflection
N DAYS
Discharg
e
time
 The rising limb is the ascending portion of the
hydrograph corresponding to increase of discharge
due to gradual accumulation of storage in the channels
existing in the area.
 The peak segment includes the part of the
hydrograph from the inflection point on rising limb to
an inflection point on recession line.
 The recession limb extends from the inflection point to
the point which represents the recommencement of the
natural base flow or ground water flow.
Separation of base flow from direct
run off
 1) Straight line method :
Figure shows the two points A and C which mark
the beginning and end of the direct run off.
 2)Two tangent method:
This is the most widely used method in which
the base flow is separated from direct runoff
by two lines.
 The first line AB is obtained by extending the base flow
curve existing prior to the commencement of the surface
runoff, till it intersects a vertical line, drawn from the
peak.
 Point B and C are joined by straight line.
 Empirical equation to locate point C:
N = 0.83 days
Where
N = time interval in days from peak
A = area of drainage basin
A
2.0
UNIT HYDROGRAPH
 A unit hydrograph is a hydrograph representing 1
cm of runoff from a rainfall of some unit duration.
ASSUMPTIONS :
1) The effective rainfall is uniformly distributed
within its duration or specified period of time.
2) The base or time duration of hydrograph of direct
runoff due to effective rainfall of unit duration is
constant
3) The ordinates of all direct runoff hydrographs are
proportional to the total amount of direct runoff .
4) The effective rainfall is uniformly distributed over
the entire area of drainage basin.
DERIVATION OF UNIT HYDROGRAPH :
 The unit hydrograph method is used for estimation
of the maximum flood discharge of stream as well as
for developing a flood hydrograph corresponding to
anticipated rainfall.
 For the application of this method unit hydrograph of
suitable unit duration is derived from an observed
hydrograph of drainage basin.
 In order to derive unit hydrograph from storm
hydrograph of same unit duration following steps are
followed.
1) From the past records select hydrograph resulting
from an isolated, intense, short duration rainfall of
uniform duration over the drainage basin.
Construction of unit hydrograph
Direct
runoff
Base flow
N DAYS
Discharg
e
time
Flood
hydrograph
Unit
Hydrograph
2) Separate the base flow from direct runoff.
3) Subtracting the ordinates of base flow from the total
ordinates, find the ordinates of direct runoff.
4) Compute the depth of direct runoff .
Depth of direct runoff =
where ,
= sum of direct runoff ordinates in cumec.
= time interval in hours between successive ordinates.
A = area of drainage basin in square kilometers.
5) by dividing each of direct runoff by depth of direct runoff ,
the ordinates of unit hydrograph are obtained.
LIMITATION :
1) The unit hydrograph theory can not be applied to catchment
areas greater than 500square km.
2) The unit hydrograph theory cannot be applied to very small
catchments with area less than 2 km square.
3) This theory cannot be applied when the major portion of the
storm is in form of snow.
4) This theory is not accurate.
USES:
1) It can be used for flood forecasting and flood warning
based on the observed rainfall in the basin.
2) To determine runoff from a storm of unit duration.
3) To draw maximum flood hydrograph for the design of
spillways.
SUMMATION HYDROGRAPH
(s –hydrograph)
 S- hydrograph is hydrograph that is produced by a
continuous effective rainfall at a constant rate for
indefinite period.
 It is continuous rising curve , in the form of letter s , till
equilibrium is reached.
SYNTHETIC UNIT HYDROGRAPH
 The unit hydrograph determined for the ungauged
catchment is known as synthetic unit hydrograph.
 Several techniques are adopted for establishing
relationship between the basin characteristics and the
unit hydrograph characteristics for unit rainfall , but
most commonly method is Snyder's method.
INSTANTANEOUS UNITHYDROGRAPH
 If the duration of rainfall excess becomes infinitesimally
small ( T 0 ) the resulting unit hydrograph is called
instantaneous unit hydrograph.
 This is only a theoretical concept , because 1 cm of
rainfall cannot occur in a zero time on any catchment ,
but it is useful because , such a unit hydrograph
represents watershed’s response to a rainfall without
reference t the duration of rainfall.
 A comparatively easier method for developing an IUH
has been evolved by clark and is known as clark’s
method or time area histogram method.
Hwre en nu 35,44

Hwre en nu 35,44

  • 1.
    SHREE S’AD VIDHYAMANDAL INSTITUTE OF TECHNLOGY
  • 2.
    Faculty:- Payal shah SUBJECT:-Hydrology & Water resources engineering SR NO . NAME ENROLLMENT NO . 1 Patel Margi M. 130450106035 2 Shah Ishani M. 130450106044
  • 4.
    Hyetograph :  Ahyetograph can be defined as a plot of intensity of rainfall against the time interval, represented as a bar chart. Time (hours) Rainfall intensity (cm/hr)
  • 5.
     The intensityof rain is expressed in cm/hr .  This time intensity curve is generally assumed to be made up of straight lines as shown in figure and is called hyetograph .  The hyetograph can be prepared either from the mass curve of rainfall, or directly from the data obtained from automatic raingauges .  The area under a hyetograph represents the total rainfall received in that period .  This chart is very usefull in presenting the characteristics of a storm, and is particularly important in developing the design to predict extreme floods .
  • 6.
    Hyetograph from masscurve of rainfall :  The mass curve of rainfall is a plot of accumulated rainfall (cumulative rainfall) against time .  The hyetograph is derived from the mass curve and is usually represent as a bar chart . Time (hours) 1st storm 2nd storm 3rd storm A D B C E F i = ∆𝑝 ∆𝑡 ∆𝑝 ∆𝑡 Cumulative rainfall (cm)
  • 7.
     The steepnessof the curve indicates the intensity of rainfall.  The horizontal portion of the curve indicates that there was no rainfall during that period .  The mass curve of rainfall is rising curve .  The intensity of rainfall during any period is given by intensity of rainfall = i = ∆𝑝 ∆𝑡  The mass curve of rainfall gives very useful information regarding duration and magnitude .
  • 8.
    HYDROGRAPH  A hydrographis a graph showing variation of discharge (Q) with time (t) , at a particular point of stream or river,  River discharge = Cross sectional area x rivers mean velocity  Discharge is usually expressed in cumec or hectare meter per day and time is expressed in hours or days.  Since the hydrograph is generated from runoff due to precipitation resulting from an isolated storm or a series of consecutive storms, it is also known as a storm hydrograph.
  • 9.
    Components of asingle peaked hydrograph D B CA Rising limb recession peak Direct runoff Ground water Flow due to channel storage E Point of inflection N DAYS Discharg e time
  • 10.
     The risinglimb is the ascending portion of the hydrograph corresponding to increase of discharge due to gradual accumulation of storage in the channels existing in the area.  The peak segment includes the part of the hydrograph from the inflection point on rising limb to an inflection point on recession line.  The recession limb extends from the inflection point to the point which represents the recommencement of the natural base flow or ground water flow.
  • 11.
    Separation of baseflow from direct run off  1) Straight line method : Figure shows the two points A and C which mark the beginning and end of the direct run off.  2)Two tangent method: This is the most widely used method in which the base flow is separated from direct runoff by two lines.
  • 12.
     The firstline AB is obtained by extending the base flow curve existing prior to the commencement of the surface runoff, till it intersects a vertical line, drawn from the peak.  Point B and C are joined by straight line.  Empirical equation to locate point C: N = 0.83 days Where N = time interval in days from peak A = area of drainage basin A 2.0
  • 13.
    UNIT HYDROGRAPH  Aunit hydrograph is a hydrograph representing 1 cm of runoff from a rainfall of some unit duration. ASSUMPTIONS : 1) The effective rainfall is uniformly distributed within its duration or specified period of time. 2) The base or time duration of hydrograph of direct runoff due to effective rainfall of unit duration is constant
  • 14.
    3) The ordinatesof all direct runoff hydrographs are proportional to the total amount of direct runoff . 4) The effective rainfall is uniformly distributed over the entire area of drainage basin. DERIVATION OF UNIT HYDROGRAPH :  The unit hydrograph method is used for estimation of the maximum flood discharge of stream as well as for developing a flood hydrograph corresponding to anticipated rainfall.
  • 15.
     For theapplication of this method unit hydrograph of suitable unit duration is derived from an observed hydrograph of drainage basin.  In order to derive unit hydrograph from storm hydrograph of same unit duration following steps are followed. 1) From the past records select hydrograph resulting from an isolated, intense, short duration rainfall of uniform duration over the drainage basin.
  • 16.
    Construction of unithydrograph Direct runoff Base flow N DAYS Discharg e time Flood hydrograph Unit Hydrograph
  • 17.
    2) Separate thebase flow from direct runoff. 3) Subtracting the ordinates of base flow from the total ordinates, find the ordinates of direct runoff. 4) Compute the depth of direct runoff . Depth of direct runoff =
  • 18.
    where , = sumof direct runoff ordinates in cumec. = time interval in hours between successive ordinates. A = area of drainage basin in square kilometers. 5) by dividing each of direct runoff by depth of direct runoff , the ordinates of unit hydrograph are obtained.
  • 19.
    LIMITATION : 1) Theunit hydrograph theory can not be applied to catchment areas greater than 500square km. 2) The unit hydrograph theory cannot be applied to very small catchments with area less than 2 km square. 3) This theory cannot be applied when the major portion of the storm is in form of snow. 4) This theory is not accurate.
  • 20.
    USES: 1) It canbe used for flood forecasting and flood warning based on the observed rainfall in the basin. 2) To determine runoff from a storm of unit duration. 3) To draw maximum flood hydrograph for the design of spillways.
  • 21.
    SUMMATION HYDROGRAPH (s –hydrograph) S- hydrograph is hydrograph that is produced by a continuous effective rainfall at a constant rate for indefinite period.  It is continuous rising curve , in the form of letter s , till equilibrium is reached.
  • 22.
    SYNTHETIC UNIT HYDROGRAPH The unit hydrograph determined for the ungauged catchment is known as synthetic unit hydrograph.  Several techniques are adopted for establishing relationship between the basin characteristics and the unit hydrograph characteristics for unit rainfall , but most commonly method is Snyder's method.
  • 23.
    INSTANTANEOUS UNITHYDROGRAPH  Ifthe duration of rainfall excess becomes infinitesimally small ( T 0 ) the resulting unit hydrograph is called instantaneous unit hydrograph.  This is only a theoretical concept , because 1 cm of rainfall cannot occur in a zero time on any catchment , but it is useful because , such a unit hydrograph represents watershed’s response to a rainfall without reference t the duration of rainfall.
  • 24.
     A comparativelyeasier method for developing an IUH has been evolved by clark and is known as clark’s method or time area histogram method.